. 2025 Jul 2;15(1):23439.
doi: 10.1038/s41598-025-07070-x.

Mechanisms of delayed ischemia/reperfusion evoked ROS generation in the hippocampal CA1 zone of adult mouse brain slices

Affiliations

Mechanisms of delayed ischemia/reperfusion evoked ROS generation in the hippocampal CA1 zone of adult mouse brain slices

Yuliya V Medvedeva et al. Sci Rep. .

Abstract

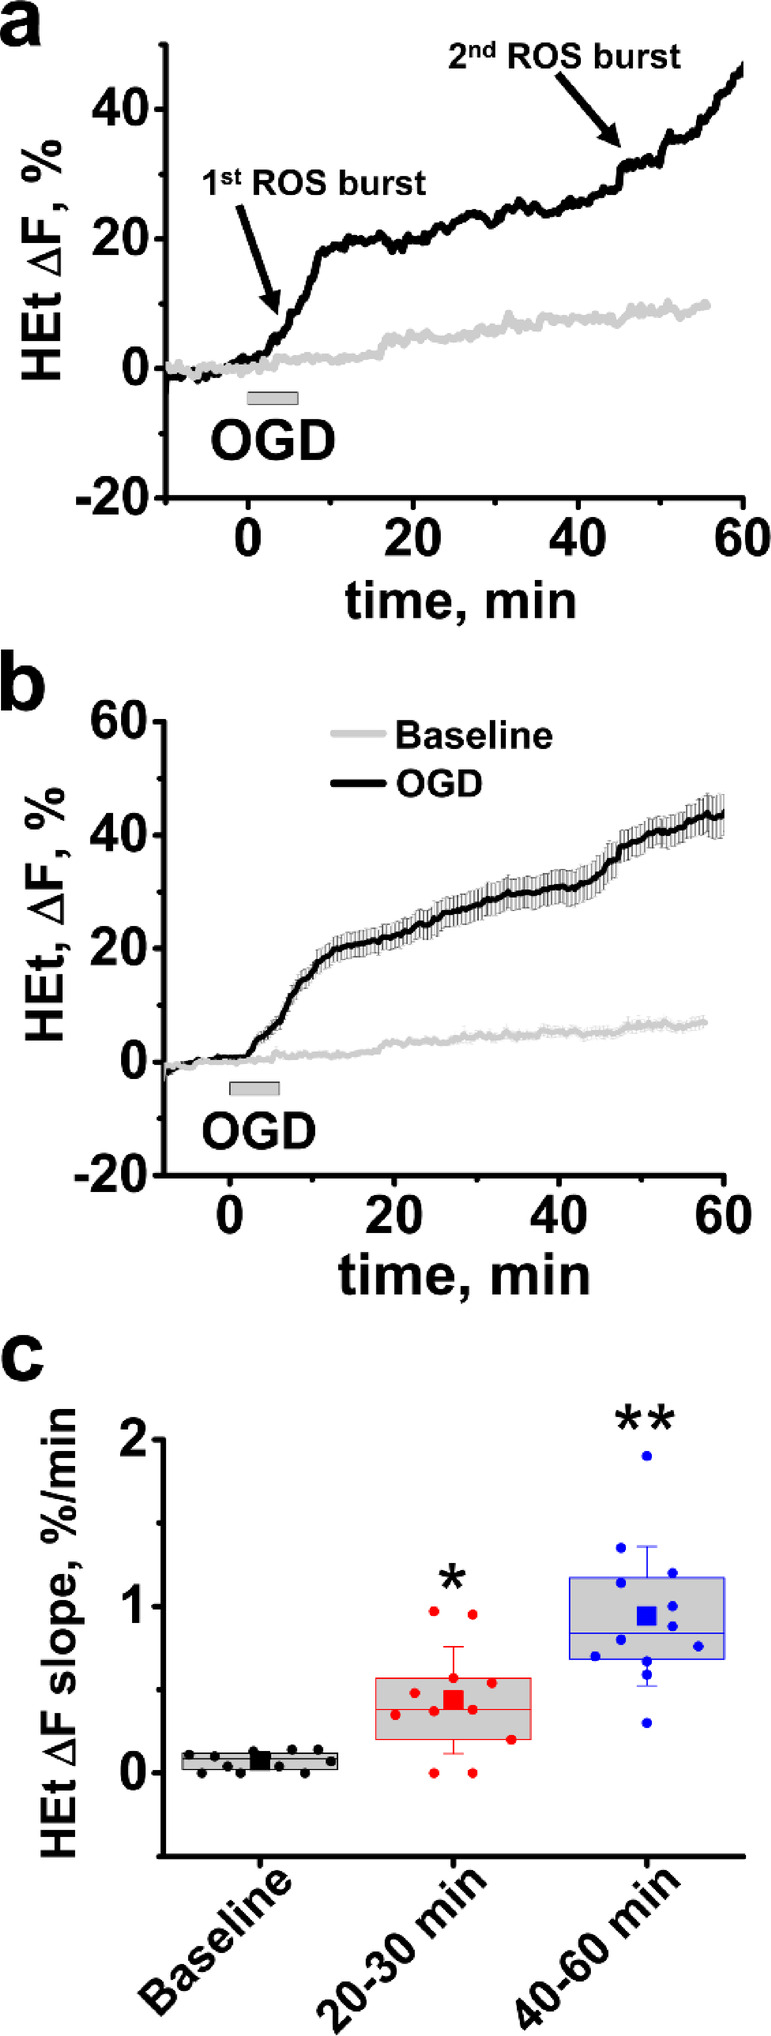
ROS overproduction is an important contributor to delayed ischemia/reperfusion induced neuronal injury, but relevant mechanisms remain poorly understood. We used oxygen-glucose deprivation (OGD)/reperfusion in mouse hippocampal slices to investigate ROS production in the CA1 pyramidal cell layer during and after transient ischemia. OGD evoked a 2-stage increase in ROS production: 1st-an abrupt increase in ROS generation starting during OGD followed by a marked slowing; and 2nd-a sharp ROS burst starting ~ 40 min after reperfusion. We further found that a slight mitochondrial hyperpolarization occurs shortly after OGD termination. Consequently, we showed that administration of low dose FCCP or of FTY720 (both of which cause mild, ~ 10%, mitochondrial depolarization), markedly diminished the delayed ROS burst, suggesting that mitochondrial hyperpolarization contributes to ROS production after reperfusion. Zn2+ chelation after OGD withdrawal also substantially decreased the late surge of ROS generation-in line with our prior studies indicating a critical contribution of Zn2+ entry into mitochondria via the mitochondrial Ca2+ uniporter (MCU) to mitochondrial damage after OGD. Thus, reperfusion-induced mitochondria hyperpolarization and mitochondrial Zn2+ accumulation both contribute to mitochondrial ROS overproduction after ischemia. As these events occur after reperfusion, they may be amenable to therapeutic interventions.

Keywords: Hippocampal slice; MCU; Mitochondria; Mitochondrial hyperpolarization; Oxygen glucose deprivation; Zn2+.


Conflict of interest statement

Declarations. Competing interests: The authors declare no competing interests.

Figures

Fig. 1
Fig. 1
OGD/reperfusion evokes a two-phase acceleration in ROS production. Slices were bath loaded with HEt and subjected to OGD/reperfusion. Traces demonstrate dynamic changes in HEt fluorescence in the CA1 zone of hippocampus during OGD/reperfusion (black traces) and in slices not subjected to treatment (gray traces) in a representative slice (a) and as an average (± SE) of 14 slices (b). (c) Box chart represents the average rate of HEt ΔF changes (with borders at the 25th and 75th percentile, presented as % per min) during baseline, and during 2 time intervals—from 20–30 min, and from 40–60 min after OGD withdrawal. Circle symbols show data points for individual slices, squares show mean value, central line demonstrate median, and error bars show SD of mean. * p < 0.019 vs baseline, ** p < 0.01 compared to both baseline and 20–30 min intervals.
Fig. 2
Fig. 2
Mitochondria are moderately hyperpolarized 30 min after OGD withdrawal. Slices were loaded with Rhod123. (a) Representative traces show changes of Rhod123 fluorescence in the CA1 pyramidal cell zone of a slice exposed to OGD followed 30 min later by FCCP (2 μM, Left), or in a control slice treated with FCCP only (Right). (b) Box chart represents Rhod123 fluorescence changes in responce to FCCP treatment (these changes are indicative of the ∆Ψm prior to FCCP exposure) in slices ~ 30 min after an OGD episode or in control untreated slices. The squire symbol point to average, borders show 25th and 75th percentiles, circle symbols show data points for individual slices, and error bars indicate standard deviation. , *p = 0.038 vs control.
Fig. 3
Fig. 3
Mild mitochondrial depolarization inhibits the reperfusion evoked ROS burst in CA1. (a) Low dose FCCP (100 nM) decreases ROS generation after OGD. Slices were bath loaded with HEt and subjected to short OGD followed by application of FCCP 5 min later. Traces show average (± SE) changes in HEt ΔF in control slices subjected to OGD alone (black) and in slices treated with FCCP (red). (b) FTY720 causes a slight and reversible loss of ∆Ψm. Slices were bath loaded with Rhod123. Representative trace (from n = 11) show changes in Rhod123 fluorescence after application of FTY720 (10 µM) for 15 min followed by FCCP (2 µM) 30 min later, as indicated. (c) FTY720 inhibits the reperfusion-evoked ROS generation. Traces show average changes in HEt fluorescence in control slices (black) and in slices treated withFTY720 (blue, 10 µM) after OGD termination, as indicated. d Box chart shows average (square symbol, borders are at 25th and 75th percentiles) HEt ΔF 50 min after the start of the OGD episode in control slices and in slices treated with FCCP or FTY720. Circle symbols show data points for individual slices, and error bars indicate standard deviation. *p < 0.01 vs control.
Fig. 4
Fig. 4
Mitochondrial Ca2+ and Zn2+ accumulation through the MCU contribute to the post-ischemic ROS overproduction. (ad) Average traces show changes in HEt fluorescence in control slices subjected to OGD alone (black trace) and in experiments where treatments were administered after OGD withdrawal, as indicated. (a) Zn2+ chelation with TPEN after OGD (red trace) attenuates the sharp increase in ROS generation. (b) MCU inhibition with RU265 changes dynamics but does not decrease ROS production (blue trace). (c) MCU blockade combined with inhibition of NOX by apocynin considerably diminishes the reperfusion-evoked ROS burst (magenta trace). (d) NOX inhibition alone (olive) does not notably affect ROS. (e) Box chart shows average HEt ΔF 50 min after the start of OGD. *p = 0.02, **p < 0.01 vs control.
Fig. 5
Fig. 5
Events likely occurring after ischemia and contributing to ROS production. Mitochondria repolarize/hyperpolarize and commence reuptake of Zn2+ and Ca2+ (These ions initially enter mitochondria during ischemia and are released into cytosol upon loss of ∆Ψm) Ca2+ is then released from mitochondria through the Na+/Ca2+ exchanger, but Ca2+ triggered overactivation of the ETC and consequent mitochondrial hyperpolarization causes accelerated ROS production. In the cytoplasm Ca2+ can activate NOX, which causes additional ROS generation. Zn2+ stays in mitochondria for a prolonged period of time, causing mitochondrial dysfunction and contributing to the delayed ROS burst. The mitochondrial hyperpolarization and the Zn2+ accumulation in mitochondria (possibly in combination with NOX inhibition) can be targeted after restoration of blood flow to prevent excessive ROS generation.

Update of

Similar articles

References

    1. Petito, C. K., Feldmann, E., Pulsinelli, W. A. & Plum, F. Delayed hippocampal damage in humans following cardiorespiratory arrest. Neurology37, 1281–1286 (1987). - PubMed
    1. Sugawara, T., Fujimura M., Morita-Fujimura Y., Kawase M. & Chan P. H. Mitochondrial release of cytochrome c corresponds to the selective vulnerability of hippocampal CA1 neurons in rats after transient global cerebral ischemia. J. Neurosci.19, RC39 (1999). - PMC - PubMed
    1. Chouchani, E. T. et al. Ischaemic accumulation of succinate controls reperfusion injury through mitochondrial ROS. Nature515, 431–435 (2014). - PMC - PubMed
    1. Sugawara, T. & Chan, P. H. Reactive oxygen radicals and pathogenesis of neuronal death after cerebral ischemia. Antioxid. Redox. Signal5, 597–607 (2003). - PubMed
    1. Abramov, A. Y., Scorziello, A. & Duchen, M. R. Three distinct mechanisms generate oxygen free radicals in neurons and contribute to cell death during anoxia and reoxygenation. J. Neurosci.27, 1129–1138 (2007). - PMC - PubMed