. 2024 Oct 1;2(1):40.
doi: 10.1038/s44303-024-00045-z.

KMnO4/Pb staining allows uranium free imaging of tissue architectures in low vacuum scanning electron microscopy

Affiliations

KMnO4/Pb staining allows uranium free imaging of tissue architectures in low vacuum scanning electron microscopy

Akira Sawaguchi et al. Npj Imaging. .

Abstract

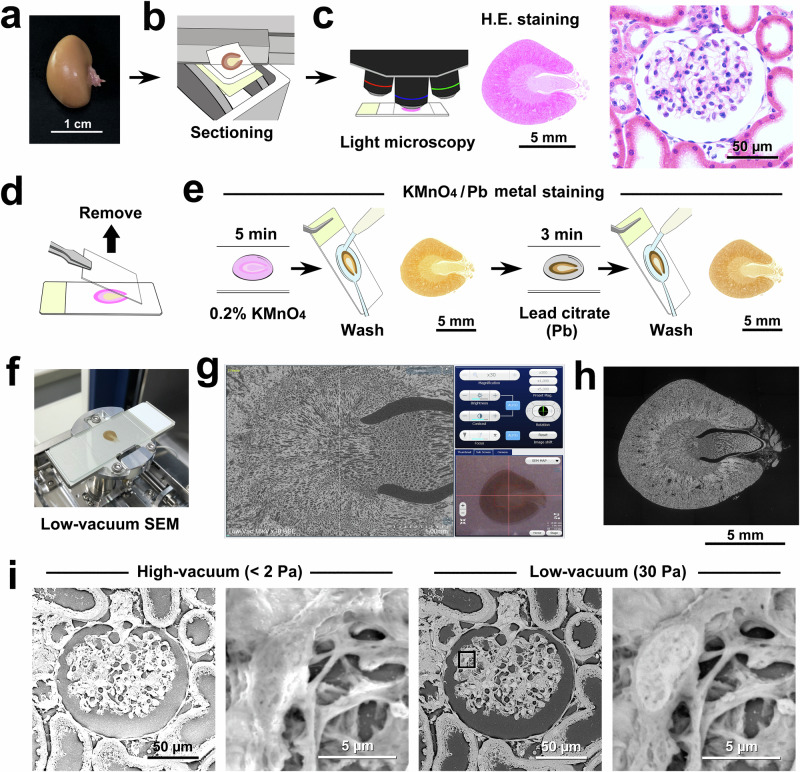
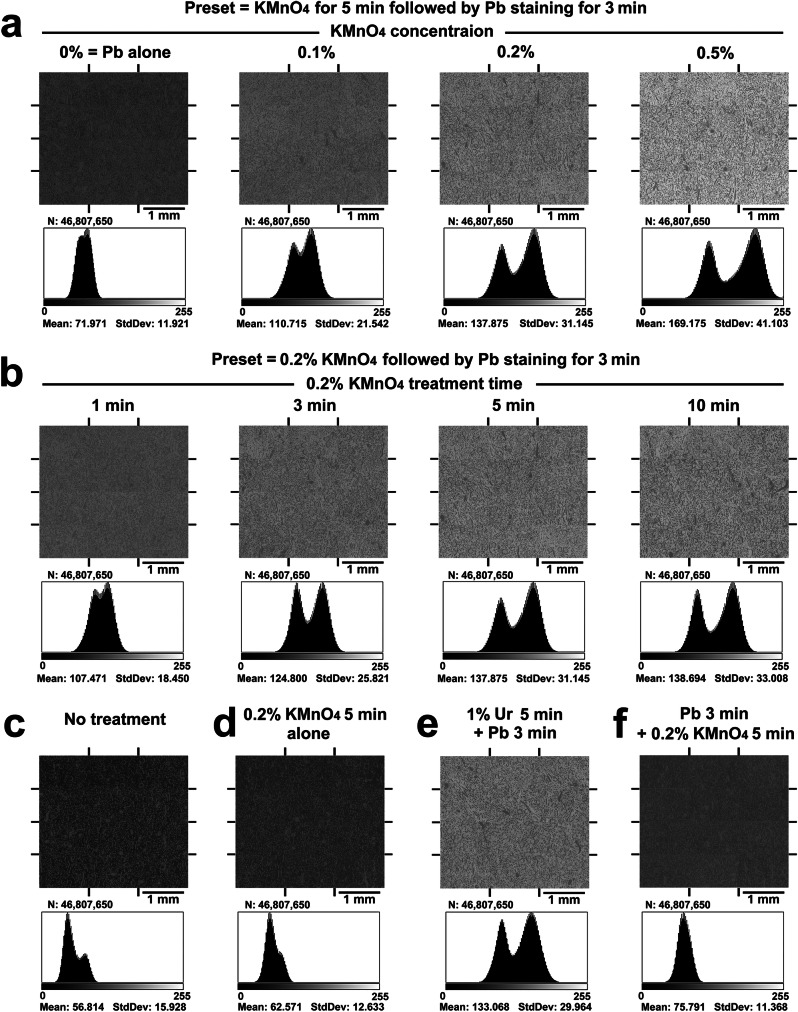
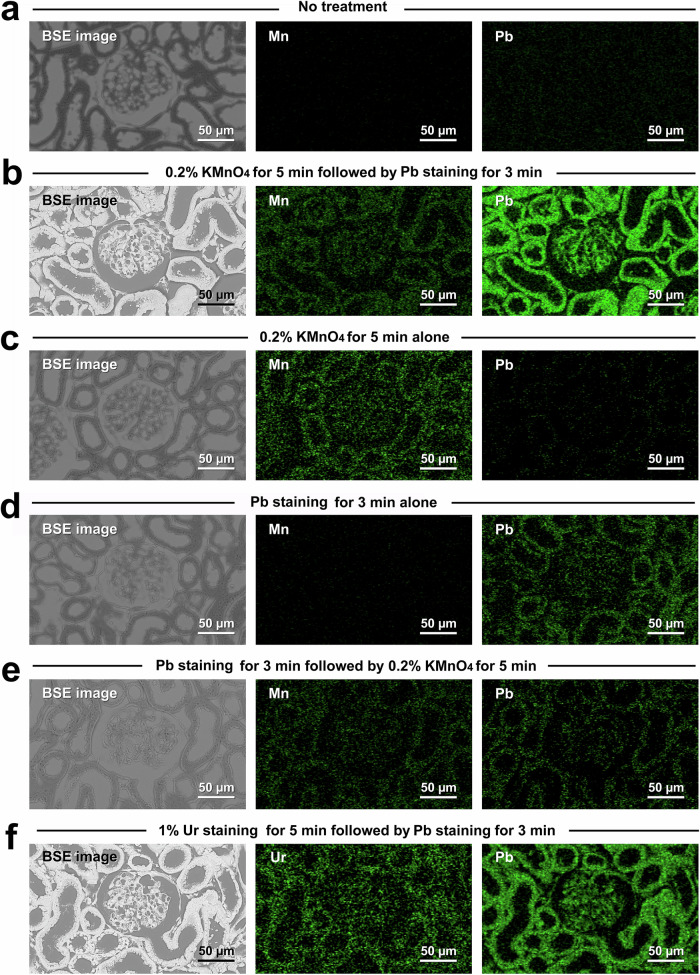
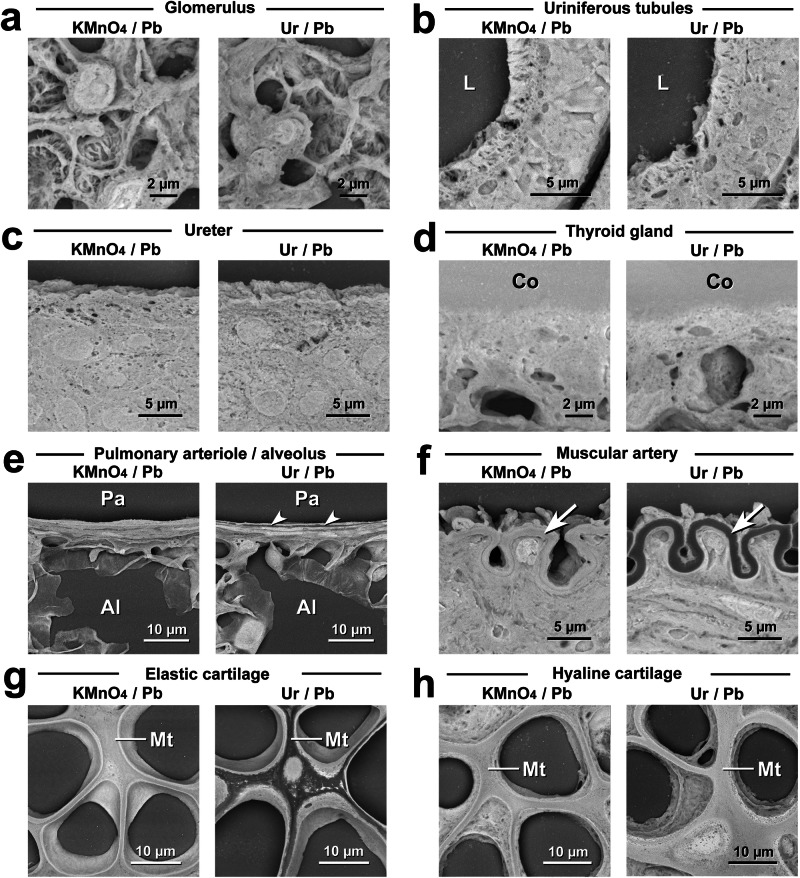
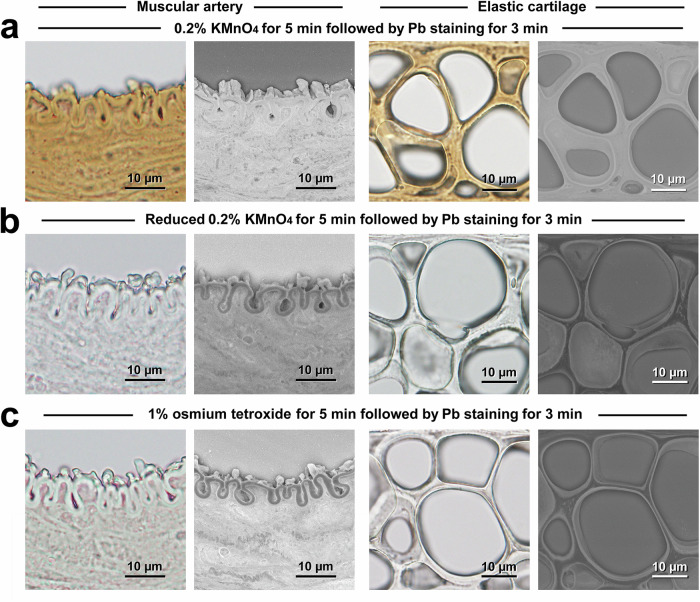
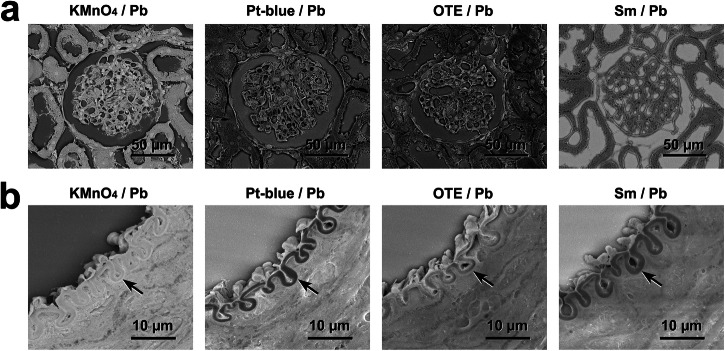
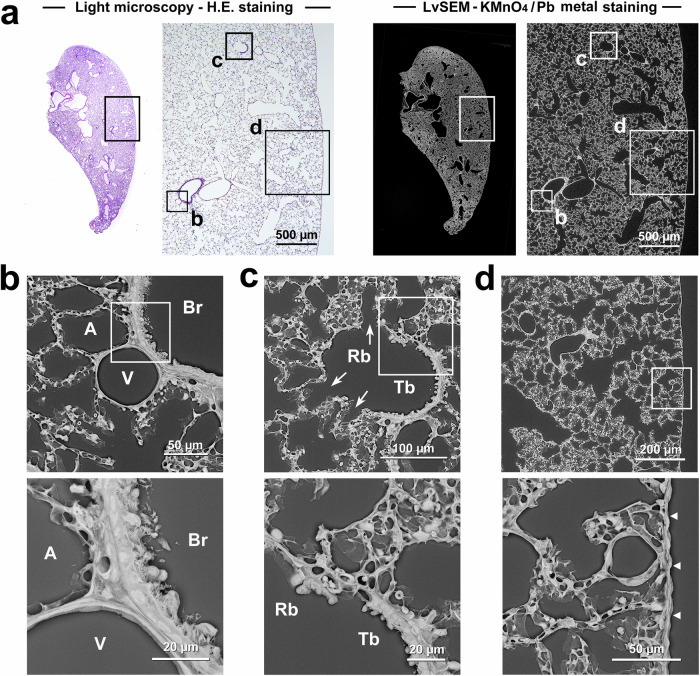
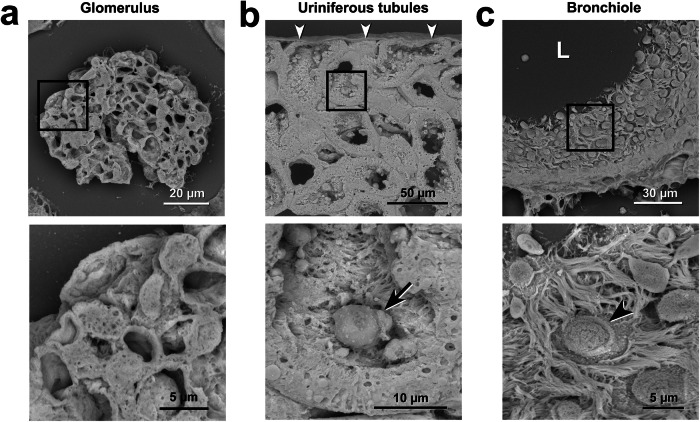
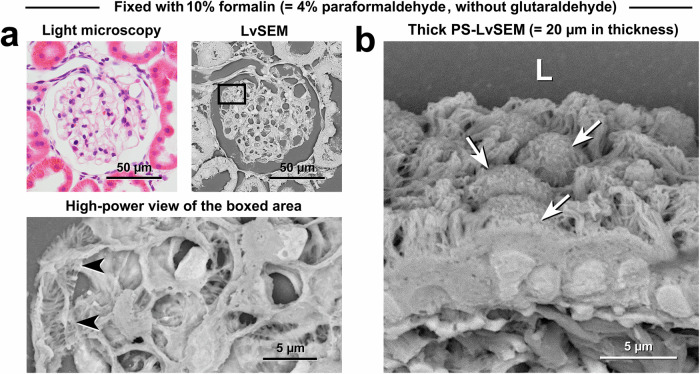
Scanning electron microscopy under low-vacuum conditions allows high-resolution imaging of complex cell/tissue architectures in nonconductive specimens. However, the conventional methods for metal staining of biological specimens require harmful uranium compounds, which hampers the applications of electron microscopy. Here, we introduce a uranium-free KMnO4/Pb metal staining protocol that allows multiscale imaging of extensive cell/tissue architectures to intensive subcellular ultrastructures. The obtained image contrast was equivalent to that of Ur/Pb staining and sufficient for ultrastructural observation, showing the fine processes of podocytes in the glomerulus, which were invisible by light microscopy. The stainability in the elastic tissue indicated that the distinct histochemical properties of KMnO4 oxidation led to Pb deposition and BSE signal enhancement superior to Ur staining. Elemental analysis clarified that the determinant of the backscattered electron signal intensity was the amount of Pb deposition enhanced by KMnO4 oxidation. This user-friendly method is anticipated to create a new approach for biomedical electron microscopy.


Conflict of interest statement

Competing interests: The authors declare no competing interests.

Figures

Fig. 1
Fig. 1. Practical flow diagram of correlative light microscopy and PS-LvSEM imaging by KMnO4/Pb metal staining.
a Gross view of the rat kidney. be Procedure for correlative light and electron microscopy. b Generation of paraffin-embedded kidney sections. c Light microscopic survey by haematoxylin and eosin staining. d Removal of the coverslip. e Oxidative treatment with 0.2% KMnO4 followed by the application of Reynold’s lead citrate solution. f Setting onto the slide-glass holder. g The operation screen combined with the camera navigation window (lower right). h Montage image of the whole section (compare to the light micrograph in (c). i Correlative light microscopy and PS-LvSEM images of the renal corpuscle, correlating to the light micrograph in (c), without charge-up obstruction in low-vacuum mode at 30 Pa. The high-power view shows the processes of podocytes in the glomerulus.
Fig. 2
Fig. 2. Histogram analysis to determine the optimal KMnO4/Pb metal staining protocol.
Electron micrographs were randomly collected from the renal cortex and tilled for histogram analysis (Supplementary Fig. 3). Grayscale histograms depicting the number of pixels at each grey level, ranging from 0 to 255, present in each staining protocol. a All sections were preset for treatment with KMnO4 for 5 min followed by Pb staining for 3 min. b All sections were preset for treatment with 0.2% KMnO4 followed by Pb staining for 3 min. c No treatment; d 0.2% KMnO4 for 5 min, alone; e 1% uranyl acetate for 5 min followed by Pb staining for 3 min; and f Pb staining for 3 min followed by 0.2% KMnO4 for 5 min. Note the representative histogram after treatment with 0.2% KMnO4 for 5 min followed by Pb staining for 3 min (a, b), corresponding to the conventional treatment with 1% uranyl acetate for 5 min followed by Pb staining for 3 min (e). N total number of pixels, Mean mean grey level, StdDev standard deviation.
Fig. 3
Fig. 3. Elemental analysis of the metal distribution after diverse staining protocols.
Elemental mapping indicating the distributions of manganese (Mn), lead (Pb) and uranium (Ur) after diverse staining protocols. a No treatment; b 0.2% KMnO4 for 5 min, followed by Pb staining for 3 min; c 0.2% KMnO4 for 5 min, alone; d Pb staining for 3 min, alone; e Pb staining for 3 min followed by 0.2% KMnO4 for 5 min; and f 1% uranyl acetate for 5 min followed by Pb staining for 3 min. Note the intense Pb distribution in the high-contrast PS-LvSEM images in (b, f), which corresponds to the renal corpuscle and uriniferous tube.
Fig. 4
Fig. 4. Comparison of PS-LvSEM imaging after KMnO4/Pb and Ur/Pb metal staining.
a Glomerulus in the renal corpuscle. b Uriniferous tubules. L lumen. c Transitional epithelium in the ureter. d Follicular epithelium and colloid (Co) in the thyroid gland. e Pulmonary arteriole (Pa) and alveolus (Al). Arrowheads indicate the dark layer by Ur/Pb metal staining. f Muscular artery in the kidney. Note the internal elastic lamina (arrows) and their dark appearance after Ur/Pb metal staining. g Elastic cartilage in the auricle. Note the interterritorial matrix (Mt) and its dark appearance after Ur/Pb metal staining. h Hyaline cartilage in the trachea. Note the bright appearance of the interterritorial matrix (Mt) after both KMnO4/Pb and Ur/Pb metal staining.
Fig. 5
Fig. 5. Dependence on oxidation by KMnO4 for high-contrast PS-LvSEM imaging.
Correlative light microscopy and PS-LvSEM images after treatment with oxidative 0.2% KMnO4 for 5 min followed by Pb staining for 3 min (a), nonoxidative reduced 0.2% KMnO4 for 5 min followed by Pb staining for 3 min (b), and oxidative 1% osmium tetroxide for 5 min followed by Pb staining for 3 min (c). Note the brownish-light microscopic appearance and the high contrast of the PS-LvSEM image obtained after KMnO4/Pb metal staining.
Fig. 6
Fig. 6. Comparison of PS-LvSEM imaging after KMnO4/Pb, Pt-blue/Pb, OTE/Pb and Sm/Pb metal staining.
a Renal corpuscle and uriniferous tubules. b Muscular artery in the kidney. Arrows indicate internal elastic lamina. KMnO4/Pb: 0.2% KMnO4 for 5 min followed by Pb staining for 3 min. Pt-blue/Pb: Pt-blue (pH 9) for 15 min followed by Pb staining for 3 min. OTE/Pb: 0.2% OTE in 0.1 M PB for 20 min followed by Pb staining for 3 min. Sm/Pb: 2.5% samarium triacetate for 20 min followed by Pb staining for 3 min. Note the highest contrast by KMnO4/Pb metal staining in comparison with conventional uranium-free Pt-blue/Pb, OTE/Pb and Sm/Pb metal staining.
Fig. 7
Fig. 7. Correlative light microscopy and PS-LvSEM images of rat lungs after KMnO4/Pb metal staining.
a Overview of rat lungs by correlative light microscopy and PS-LvSEM imaging. bd Representative PS-LvSEM images after KMnO4/Pb metal staining corresponding to the light micrographs. b Distinct ultrastructure of the ciliated cuboidal epithelium of the bronchiole (Br), simple squamous endothelium of the blood vessel (V), and thin capillary vessels surrounding the alveoli (A). c Transition from the terminal bronchiole (Tb), which consists of nonciliated cuboidal epithelium, to the respiratory bronchiole (Rb), which branches to the alveoli via openings (arrows). d Spongy structure of the lung parenchyma consisting of alveoli covered by the visceral pleura (arrowheads).
Fig. 8
Fig. 8. Three-dimensional cell/tissue architectures in 20-µm-thick sectioned organs.
Representative Thick PS-LvSEM micrographs of 20-µm-thick sections after KMnO4/Pb metal staining. a Glomerulus. Overview (upper) of the glomerulus within the renal corpuscle and high-power view (lower) of the podocytes covering the glomerular capillaries with their processes. b Uriniferous tubules. Overview (upper) of the uriniferous tubules beneath the renal capsules (arrowheads) and high-power view (lower) of the microvilli and the exfoliated epithelial cells in the lumen (lower, arrow). c Bronchioles in the lung. Overview (upper) of the bronchioles consisting of ciliated epithelium and high-power view (lower) of the exocrine cells (arrowhead) among the ciliated cells.
Fig. 9
Fig. 9. Fine structural preservation by fixation with conventional 10% formalin (4% paraformaldehyde) without glutaraldehyde.
a Correlative light microscopy and PS-LvSEM images of the renal corpuscle. The high-power view shows the processes of podocytes (arrowhead) in the glomerulus. b Thick PS-LvSEM micrographs of the bronchioles. Note the three-dimensional cell/tissue architectures in 20-µm-thick sections consisting of ciliated cuboidal cells and exocrine cells (arrows).

Similar articles

References

    1. Griffiths, G. Ultrastructure in cell biology: do we still need it? Eur. J. Cell Biol.83, 245–251 (2004). - PubMed
    1. Knott, G. & Genoud, C. Is EM dead? J. Cell Sci.126, 4545–4552 (2013). - PubMed
    1. Ochs, M. et al. Using electron microscopes to look into the lung. Histochem. Cell Biol.146, 695–707 (2016). - PubMed
    1. Ravi, R. T., Leung, M. R. & Zeev-Ben-Mordehai, T. Looking back and looking forward: contributions of electron microscopy to the structural cell biology of gametes and fertilization. Open Biol.10, 200186 (2020). - PMC - PubMed
    1. Danilatos, G. Mechanisms of detection and imaging in the ESEM. J. Microsc.160, 9–19 (1989).

LinkOut - more resources