. 2025 Jul;7(7):1476-1492.
doi: 10.1038/s42255-025-01318-6. Epub 2025 Jul 2.

Multi-omic analysis reveals transkingdom gut dysbiosis in metabolic dysfunction-associated steatotic liver disease

Affiliations

Multi-omic analysis reveals transkingdom gut dysbiosis in metabolic dysfunction-associated steatotic liver disease

Hanseul Kim et al. Nat Metab. 2025 Jul.

Abstract

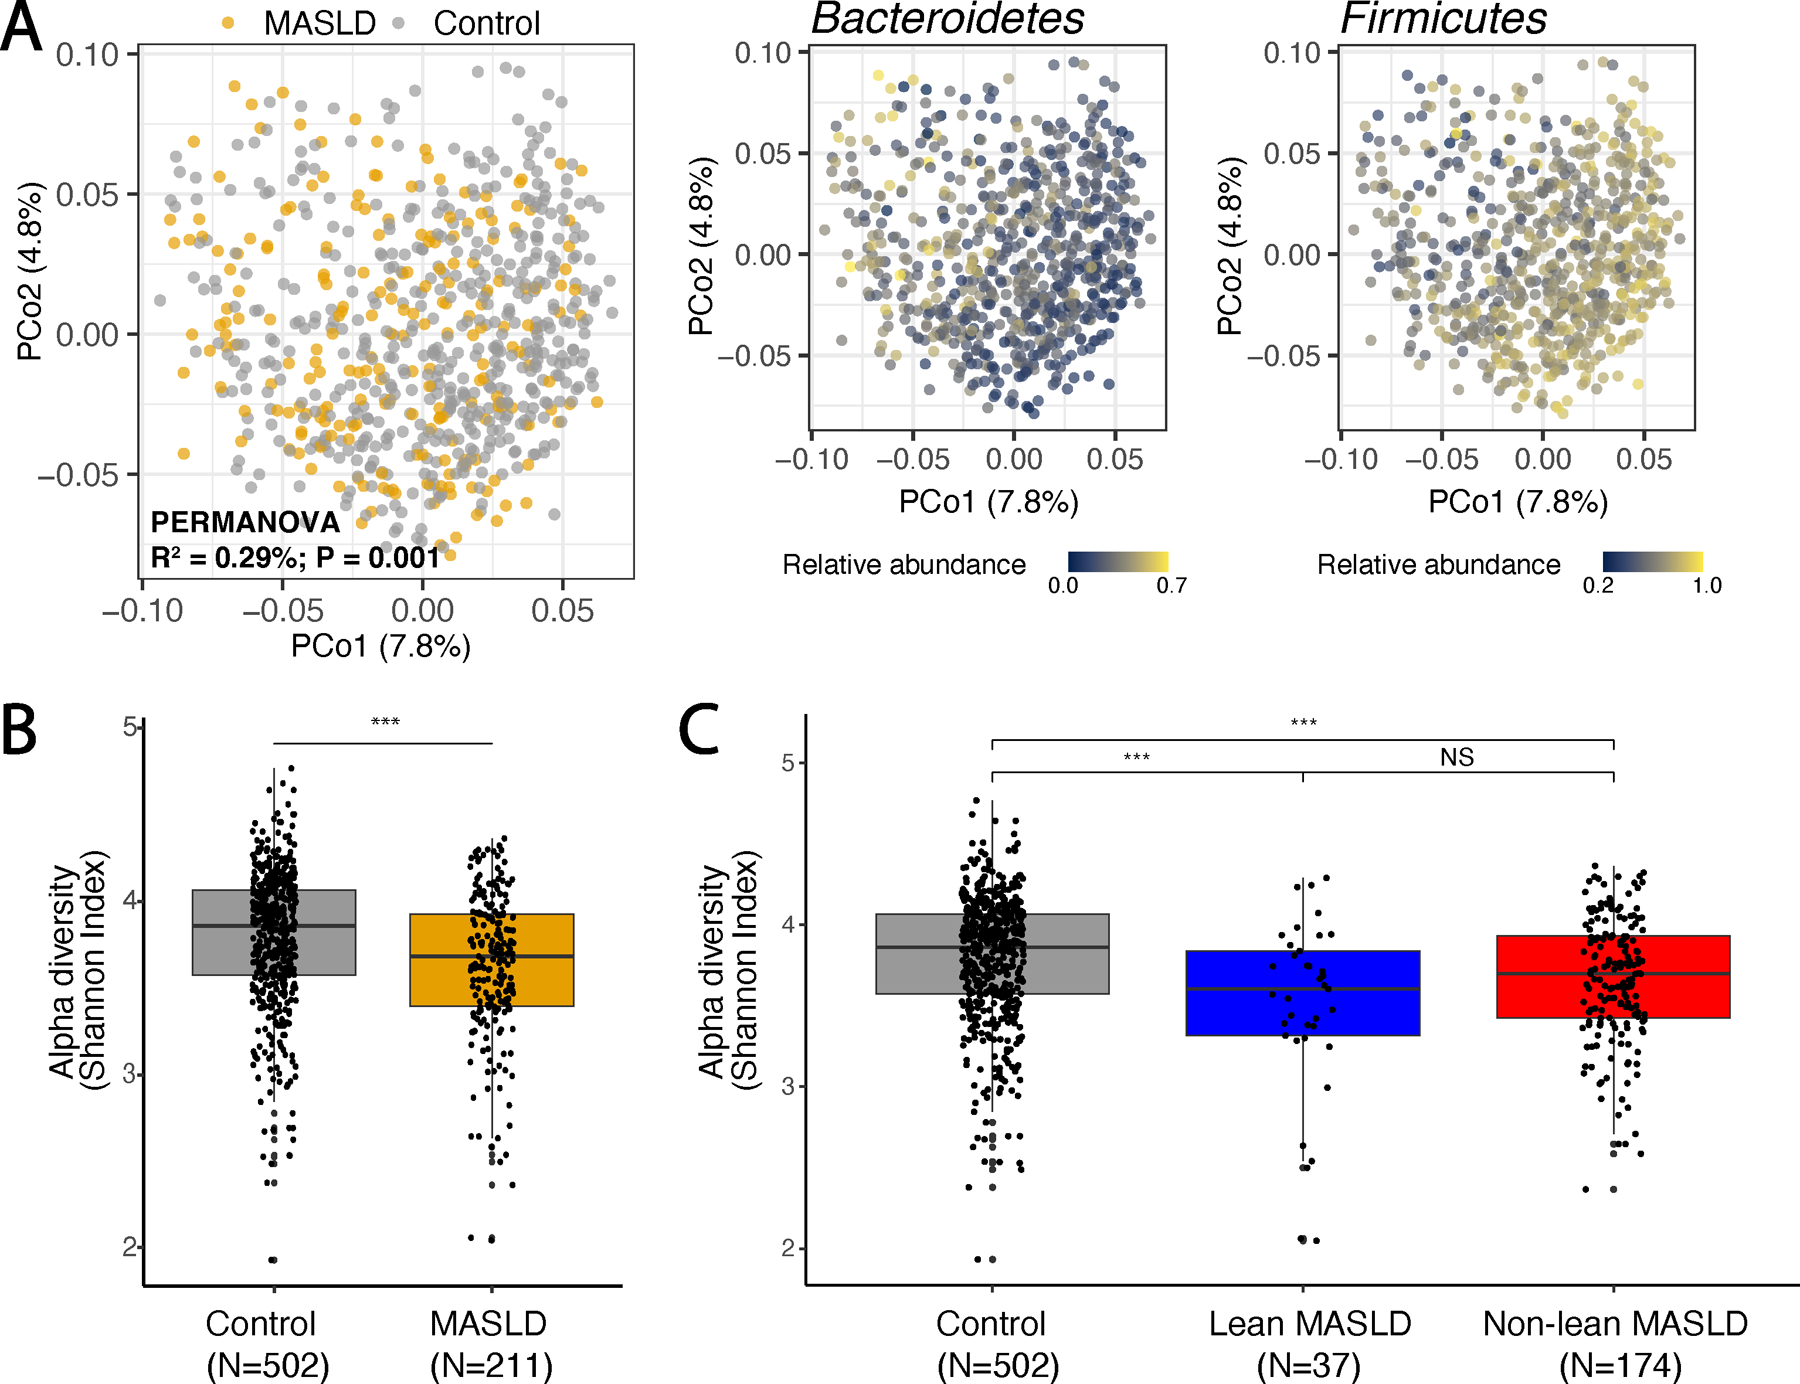
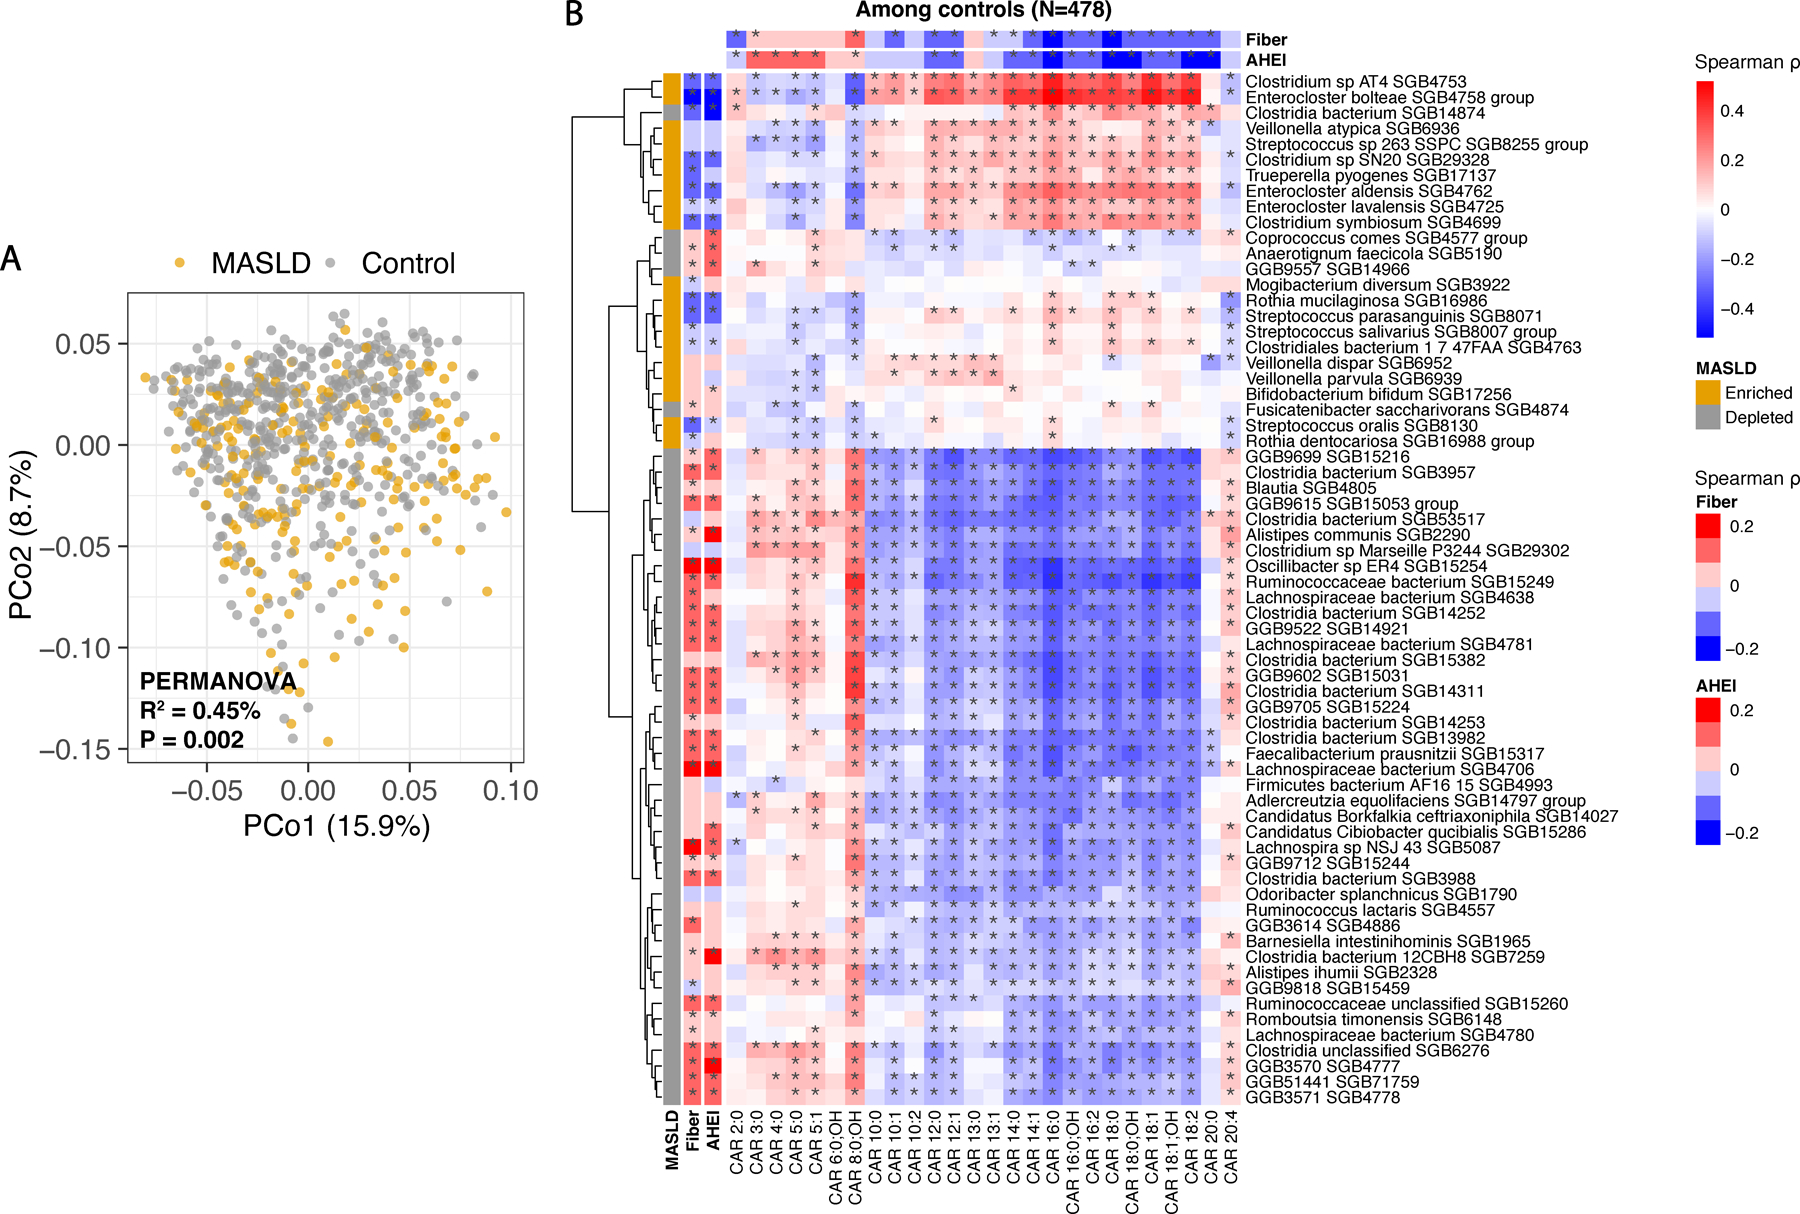
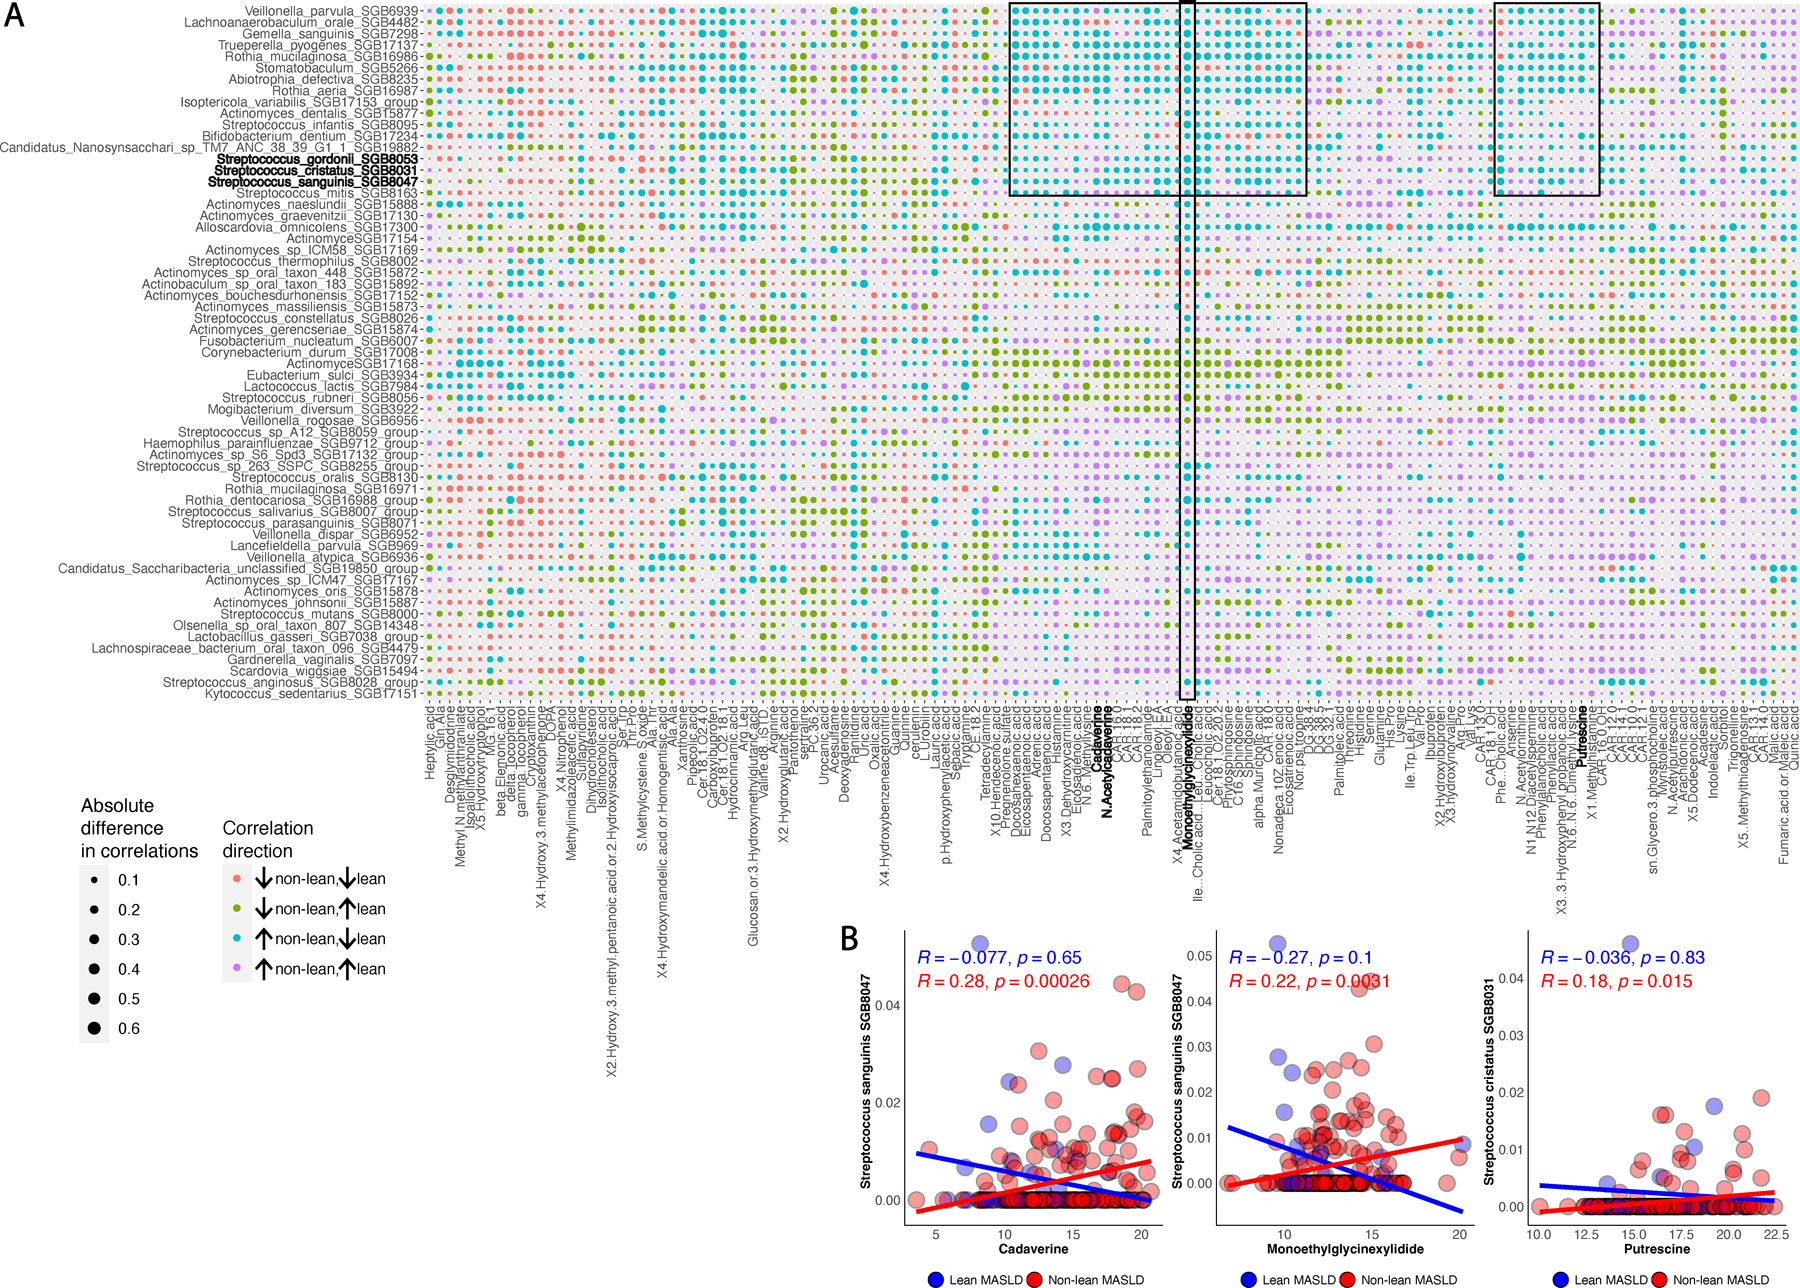
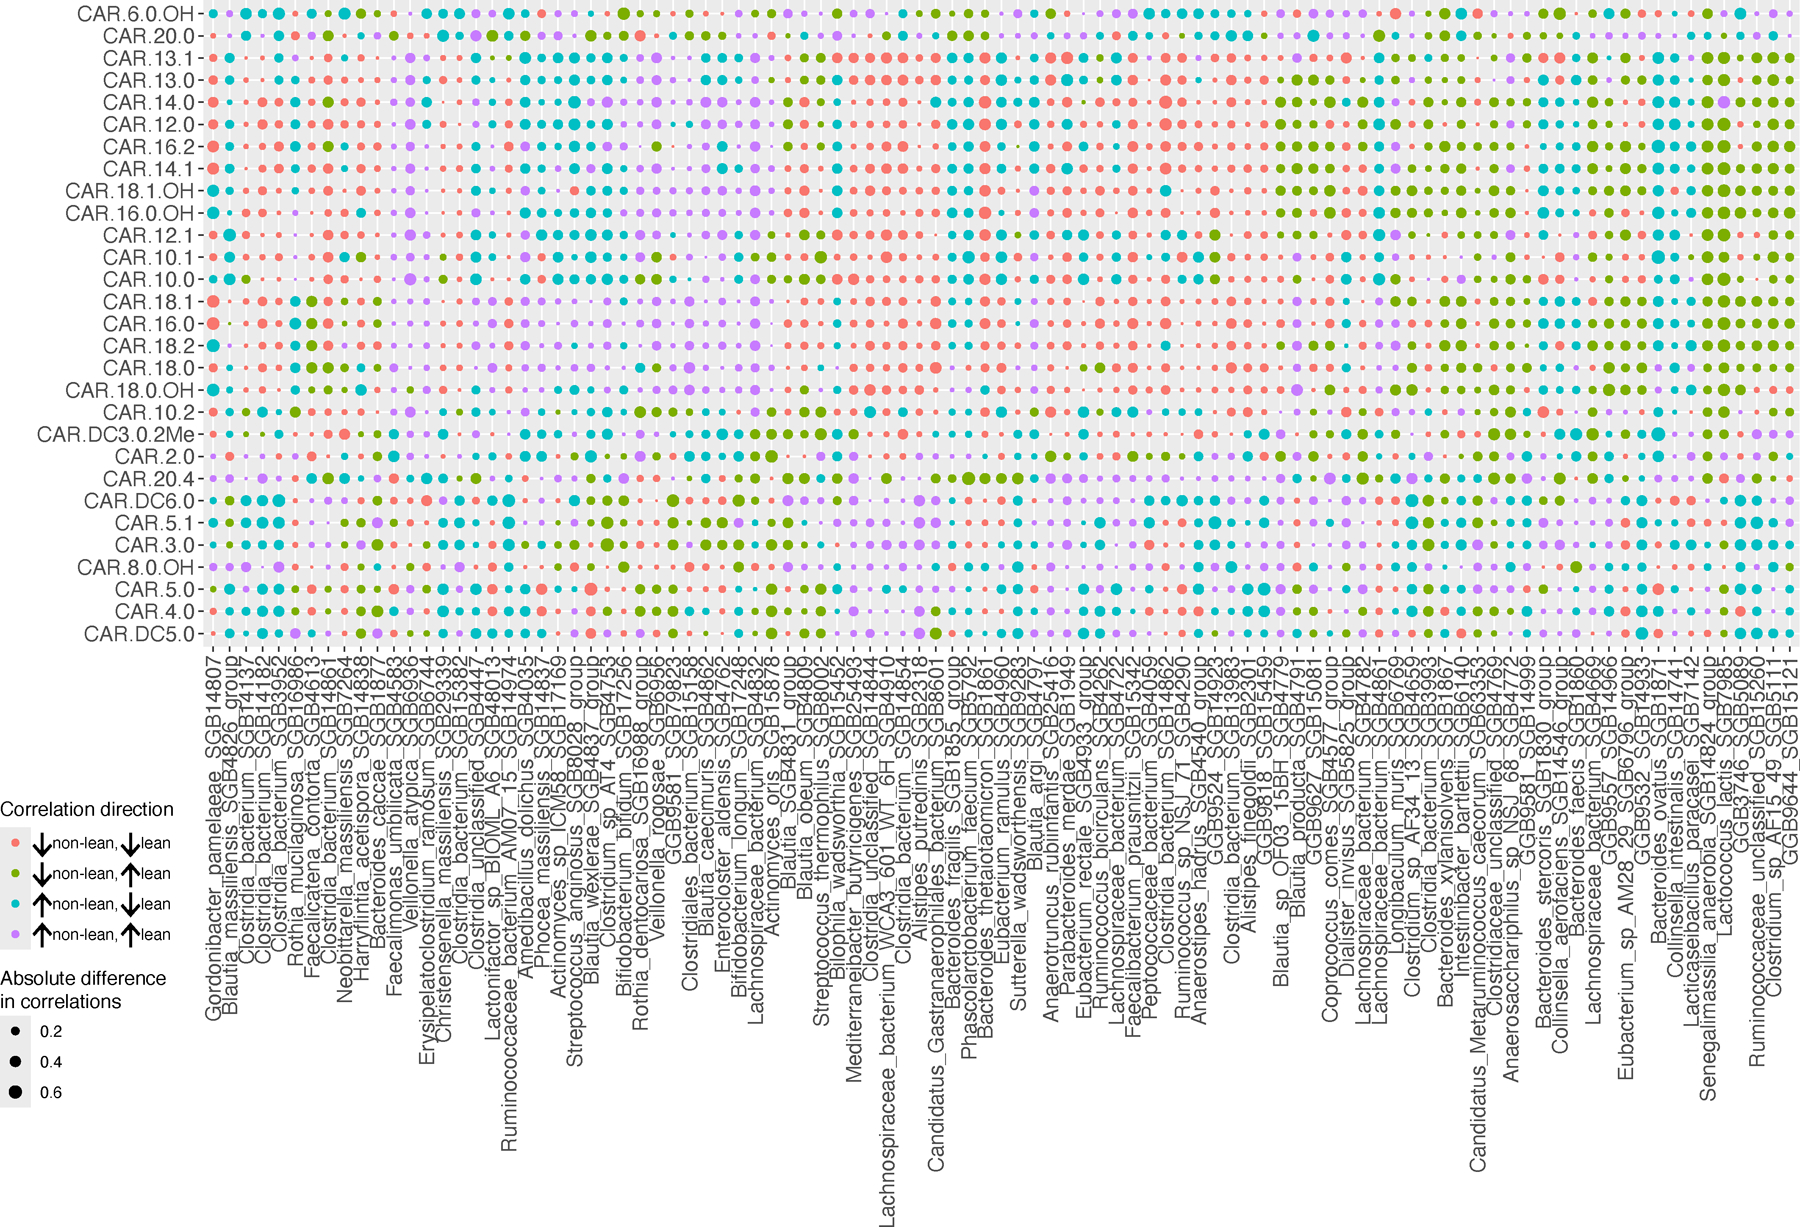
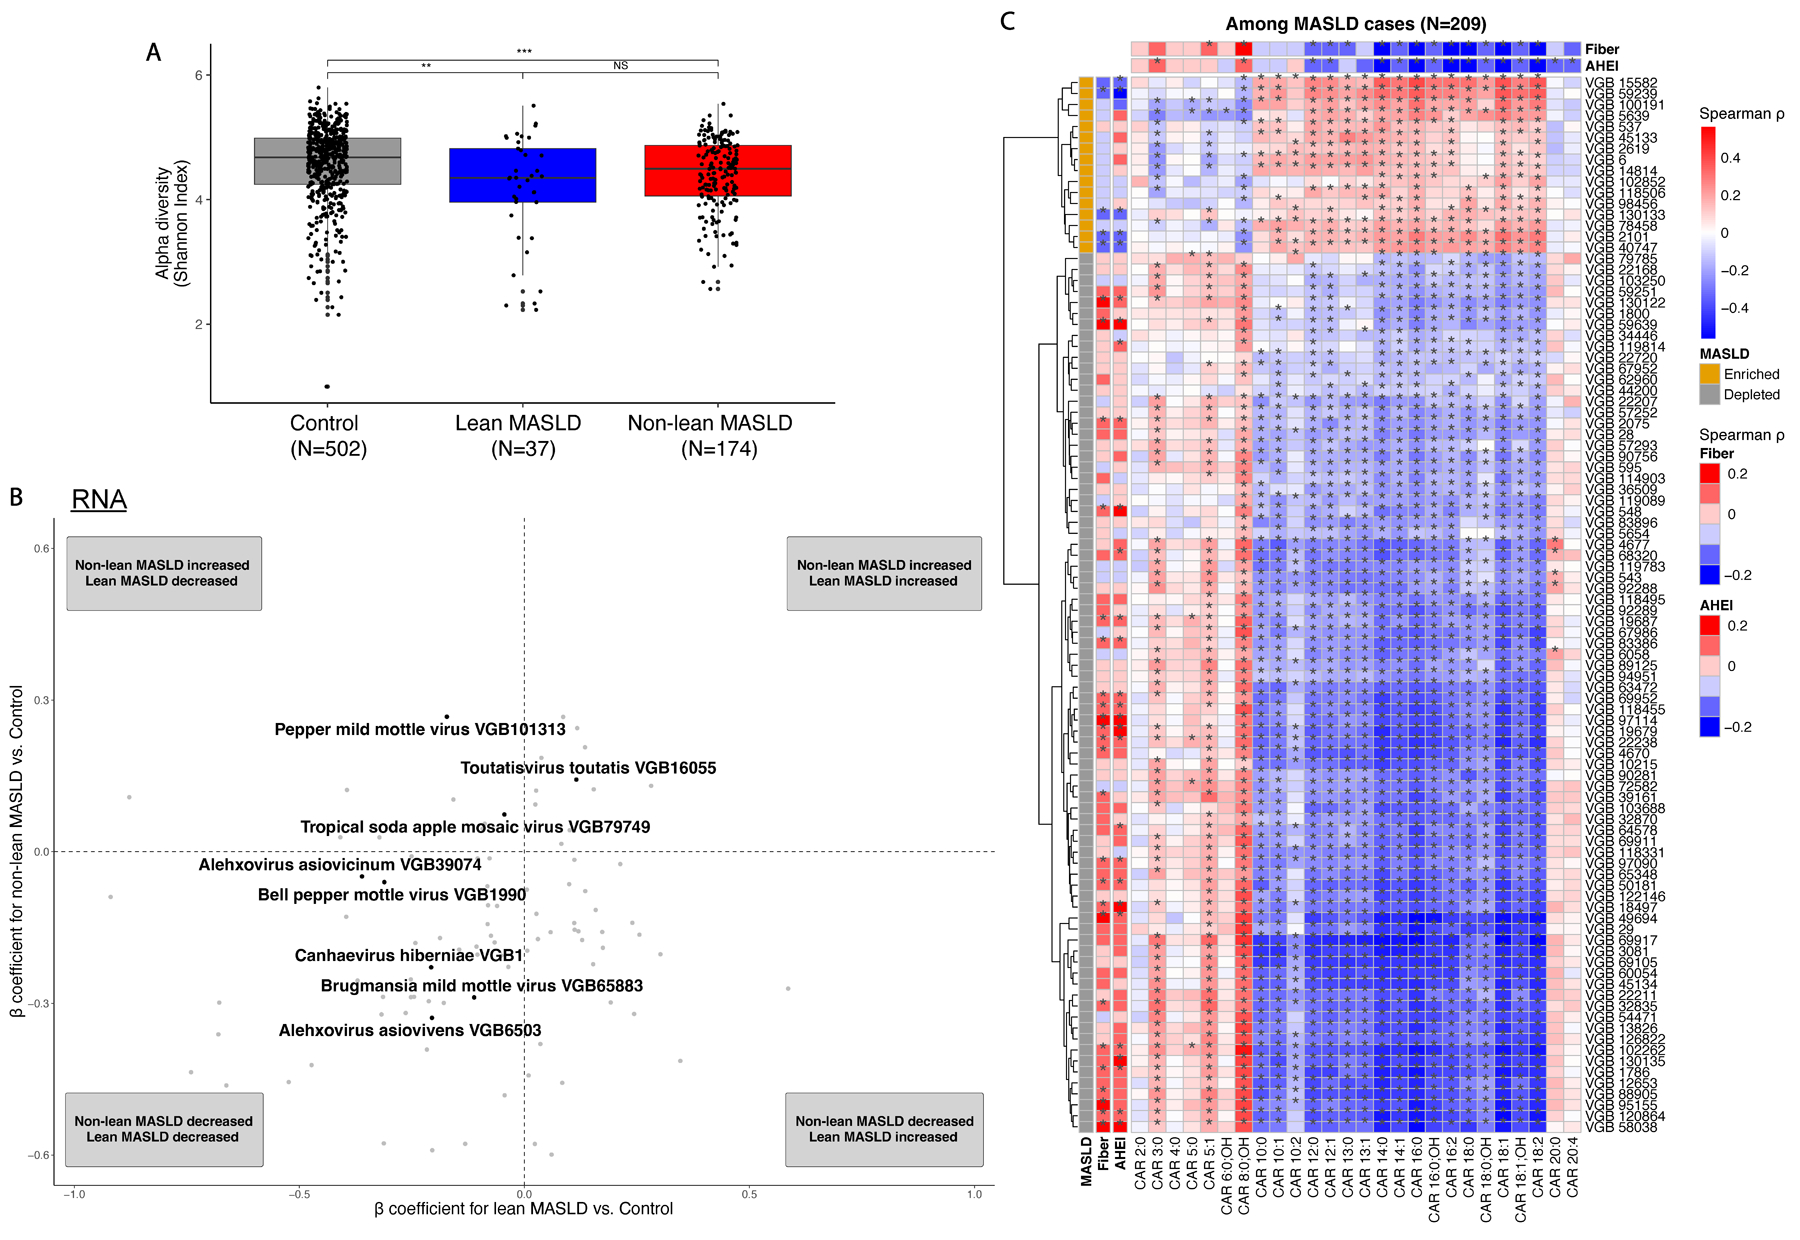
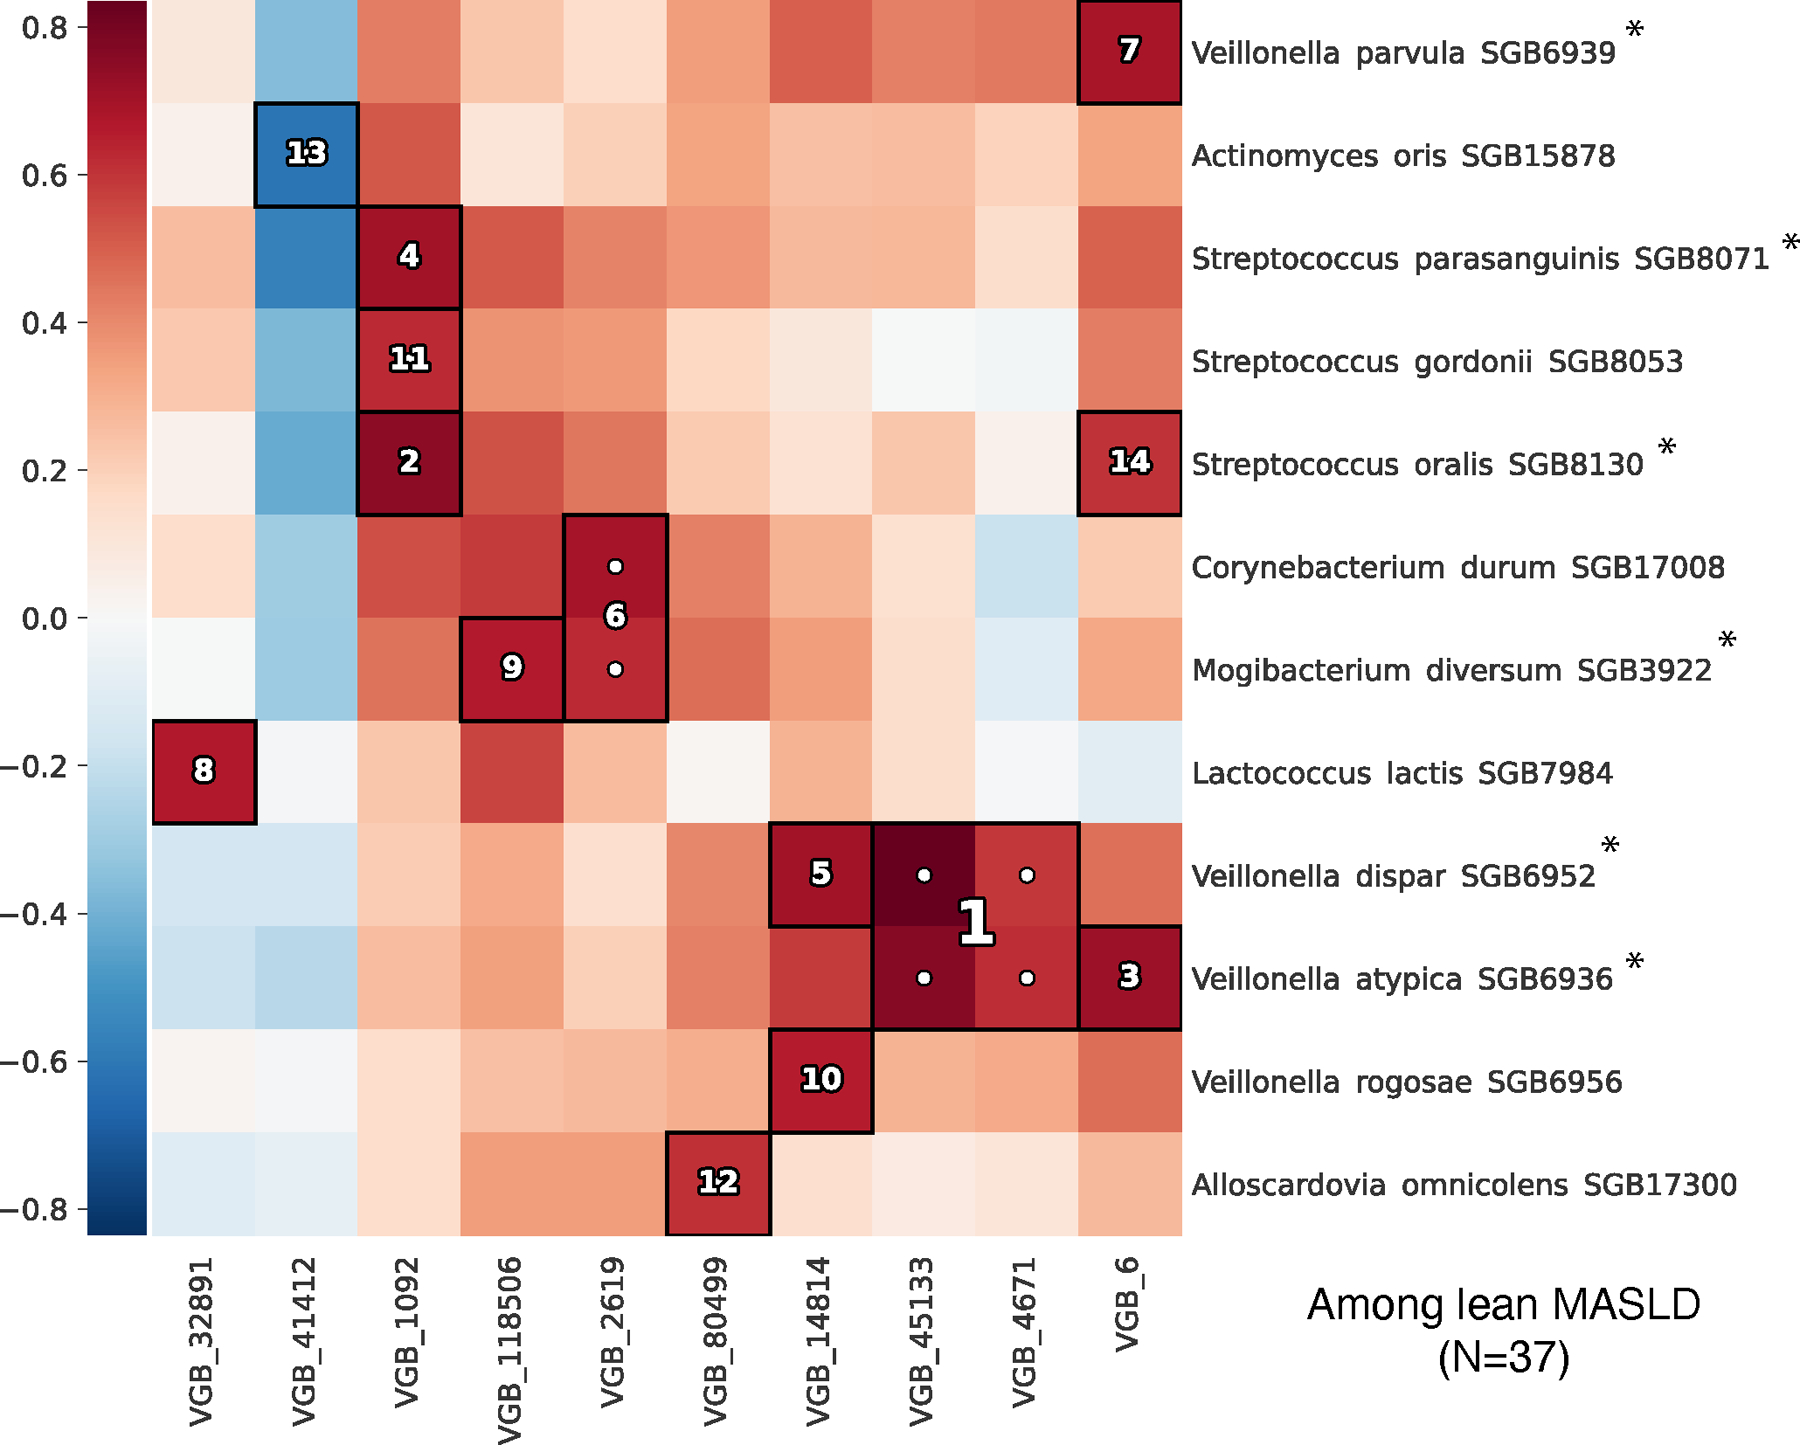
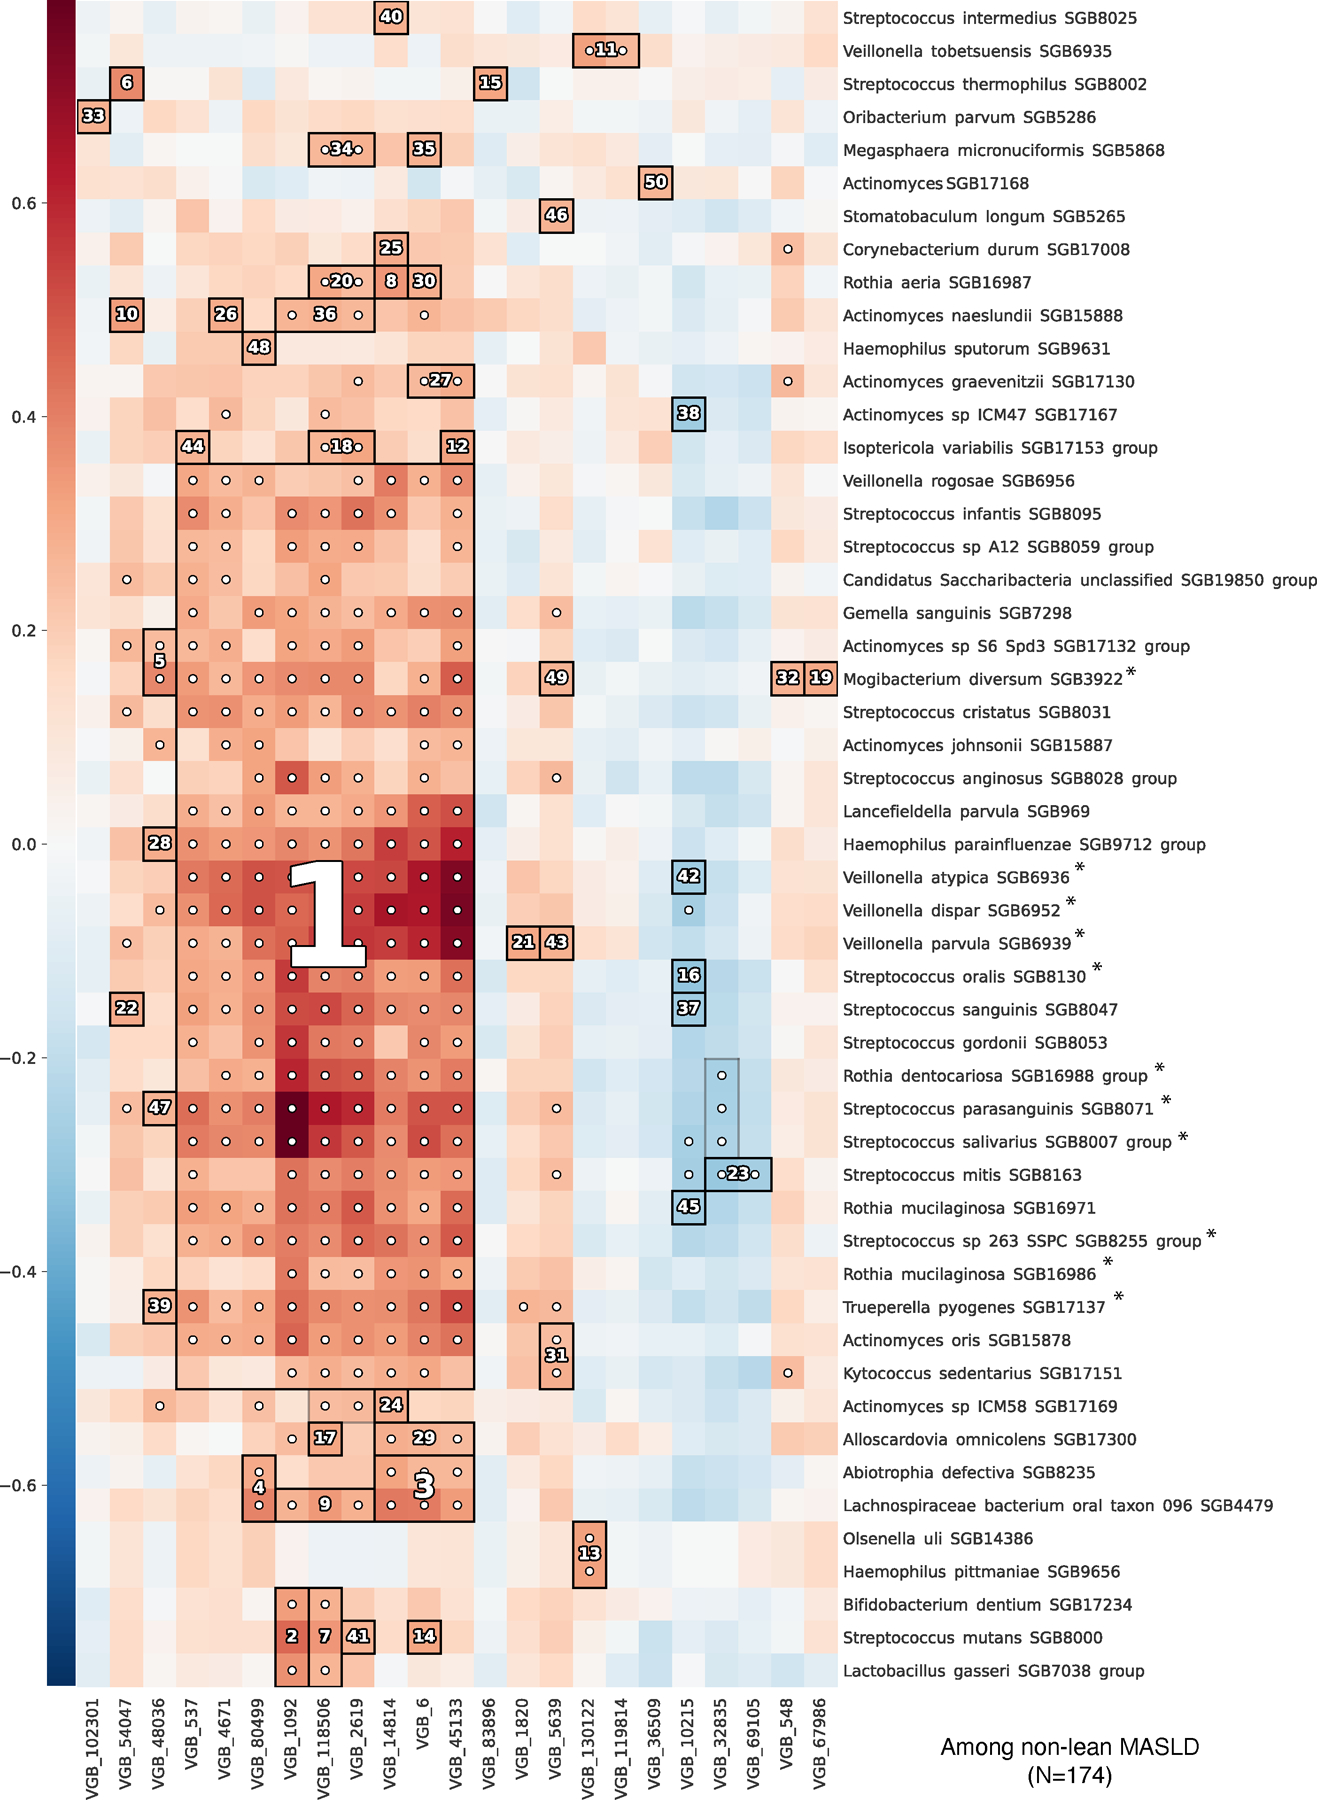
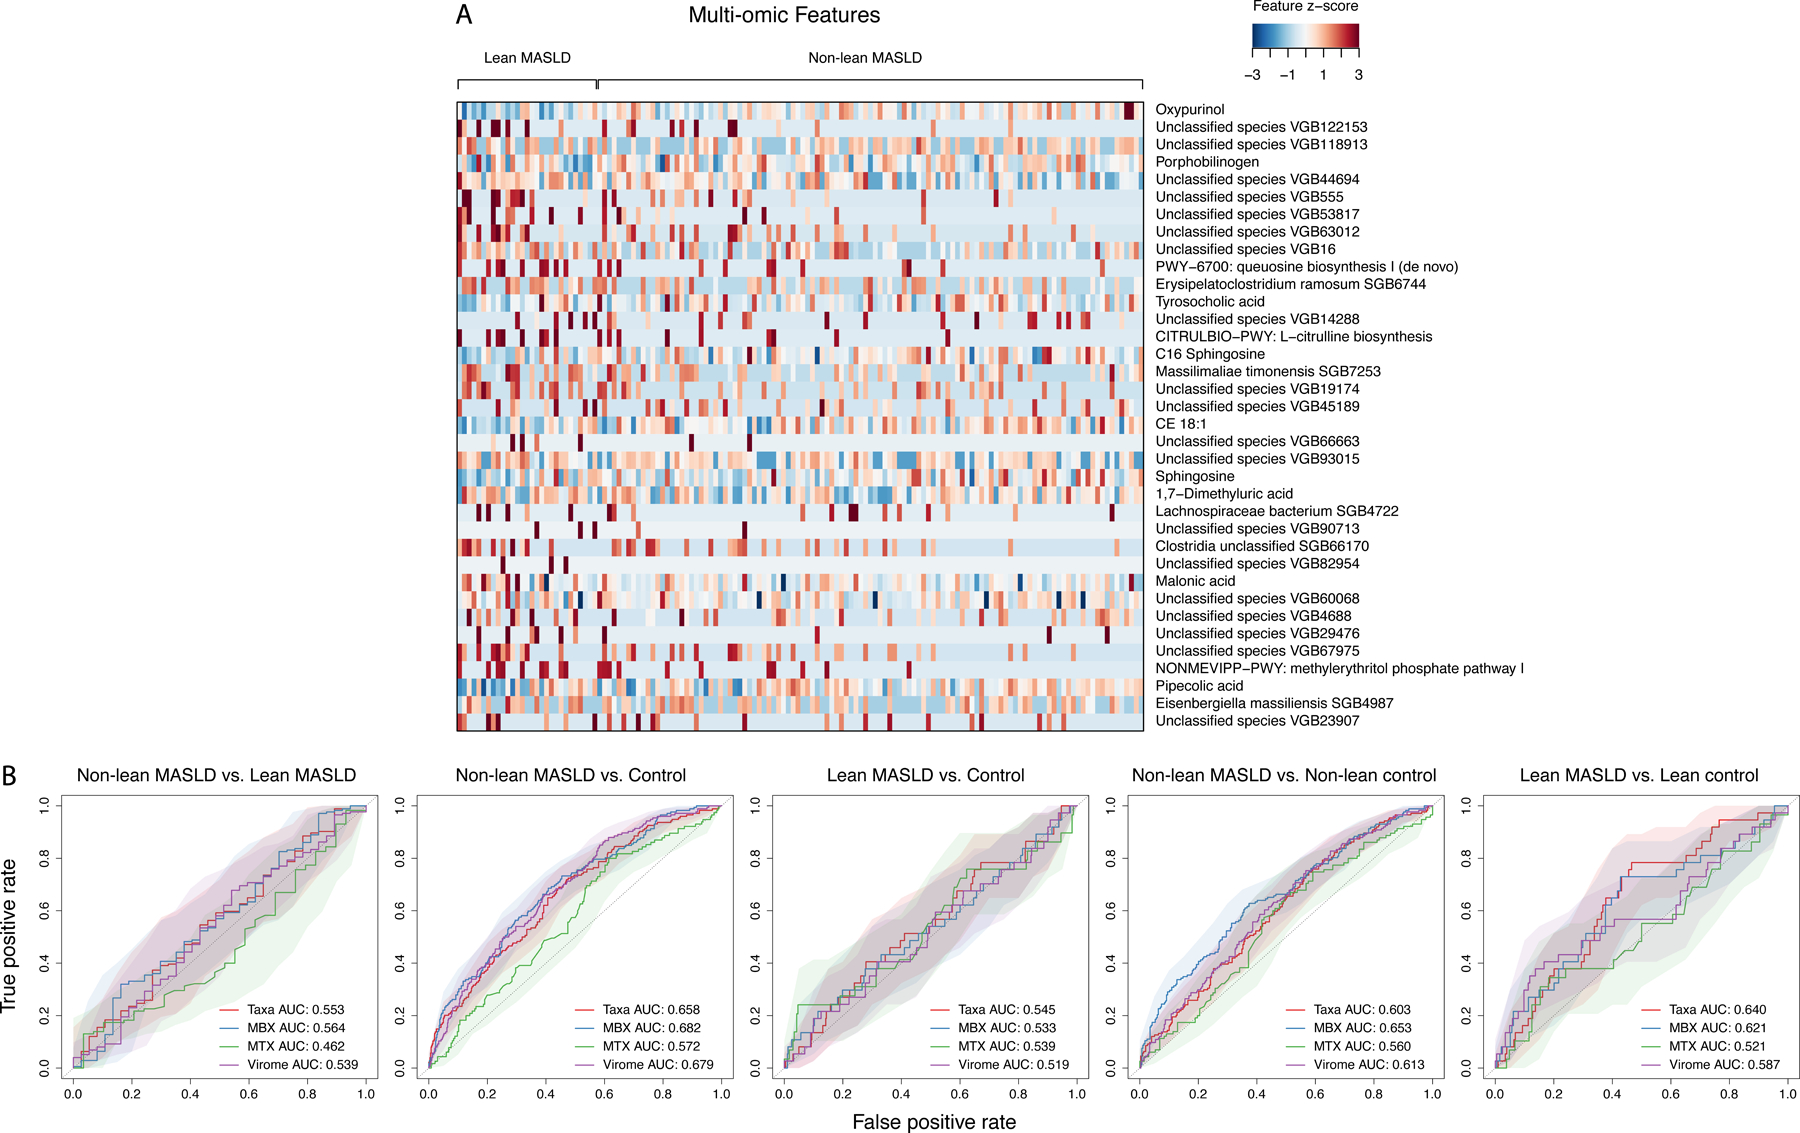
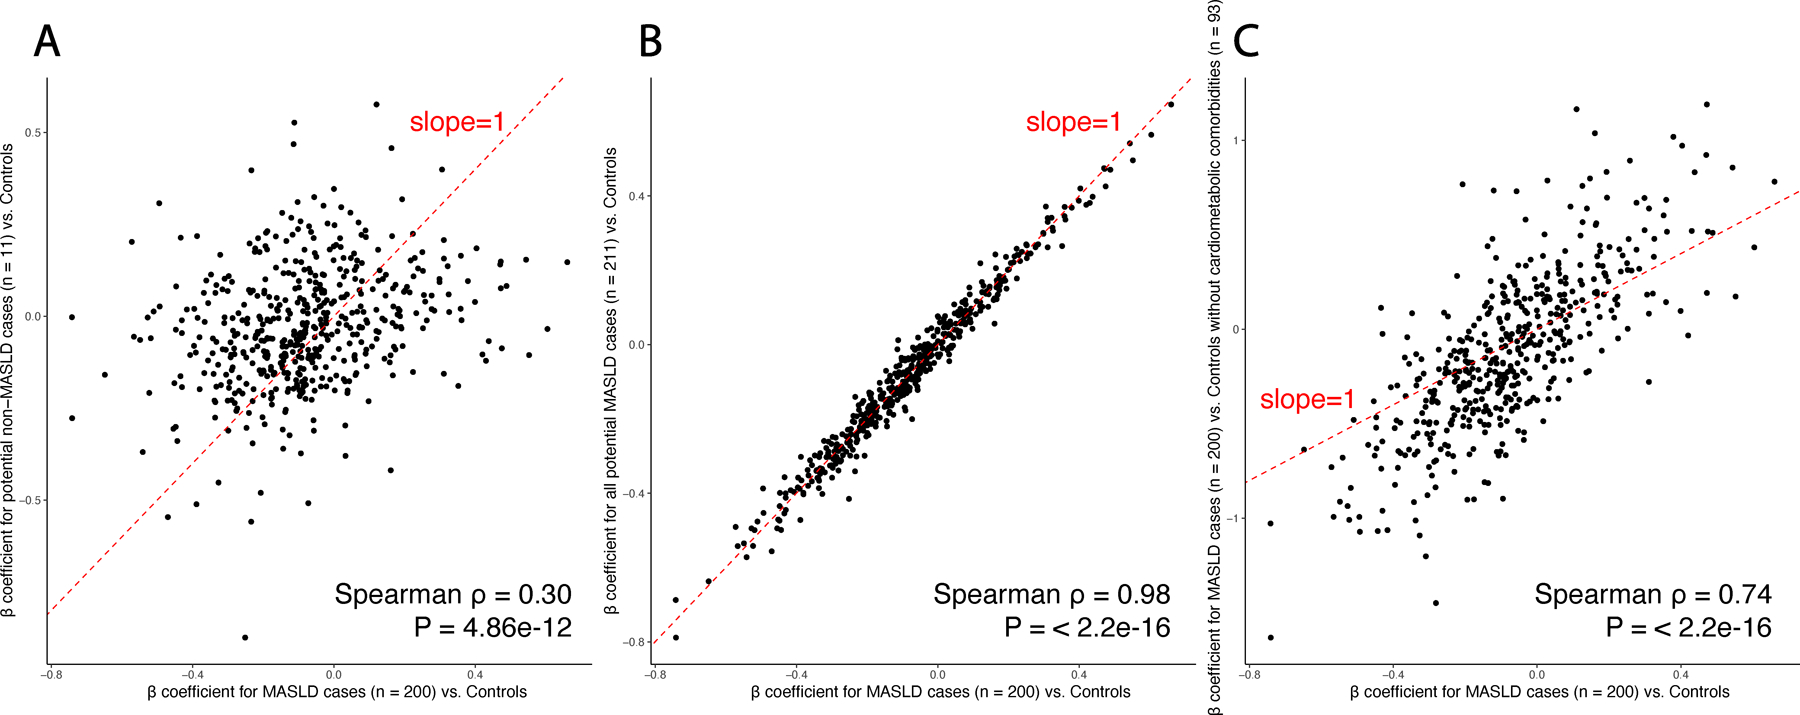
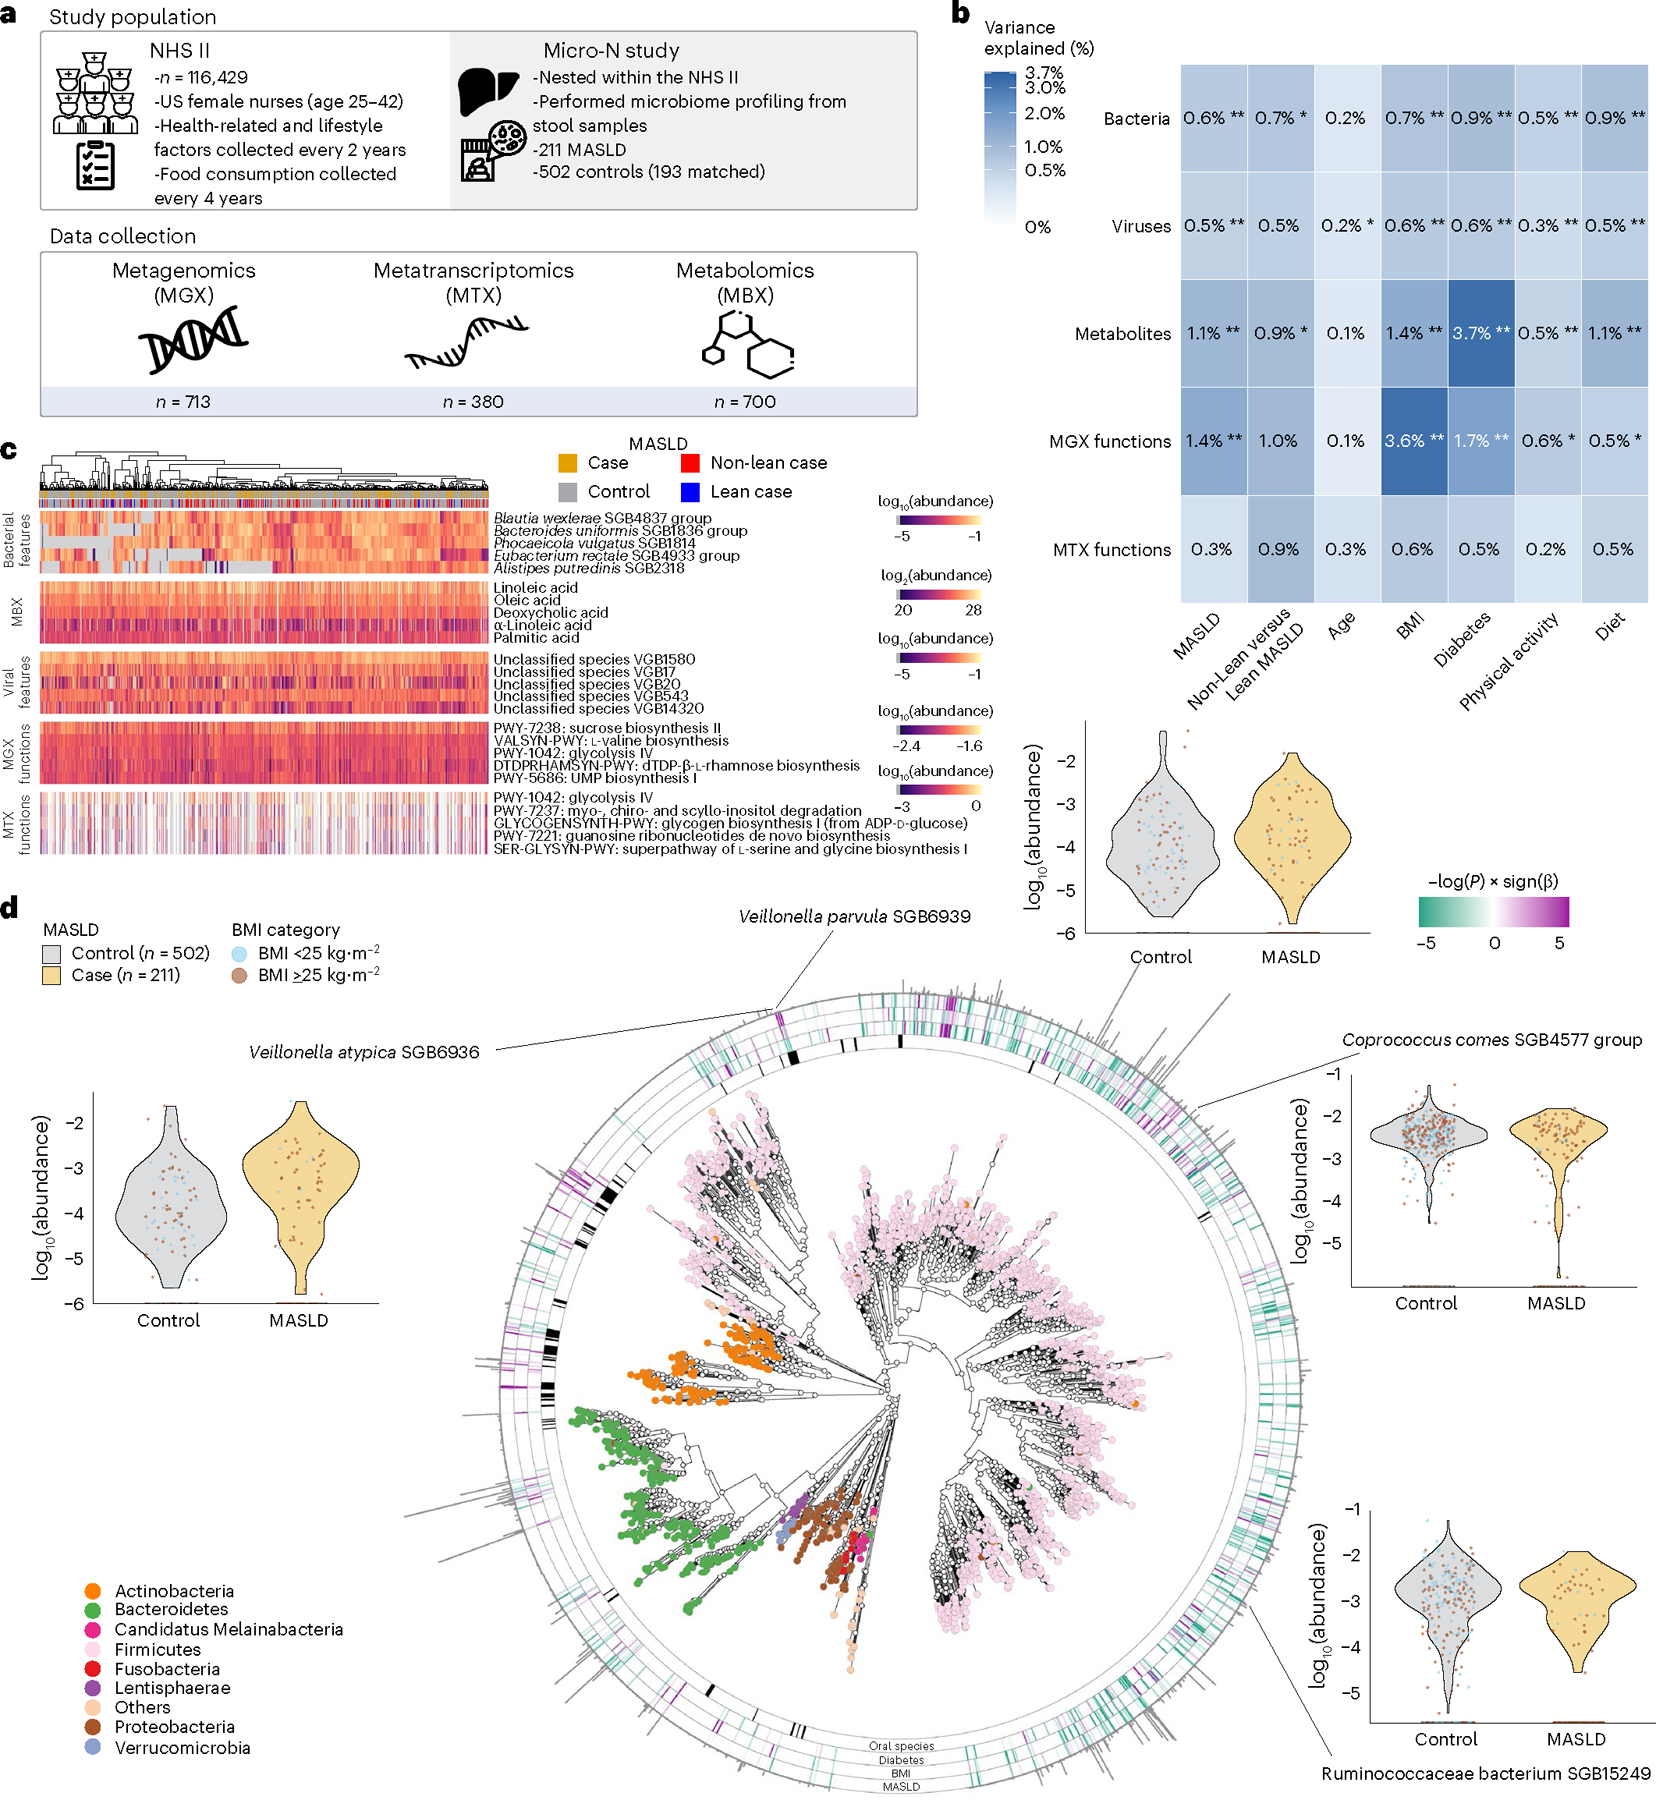
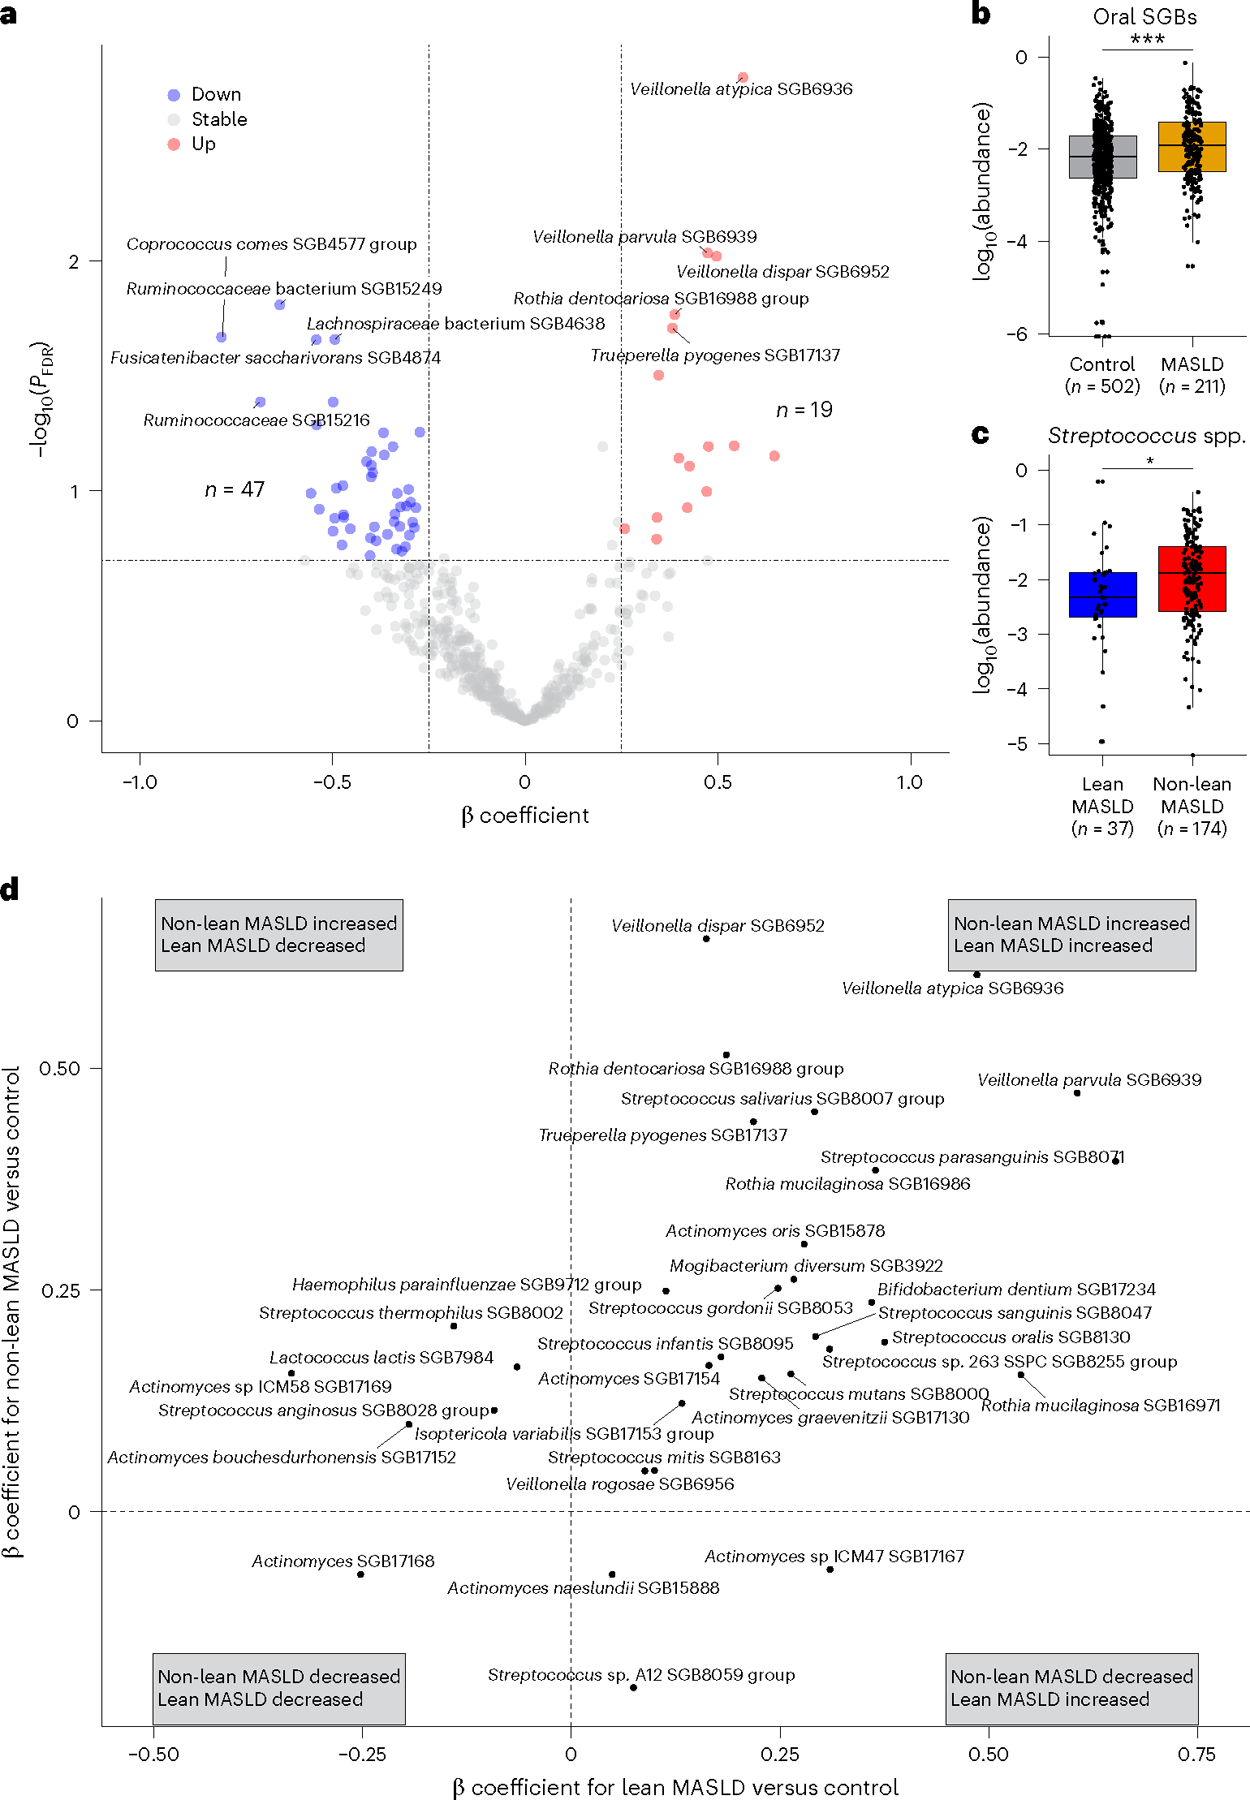
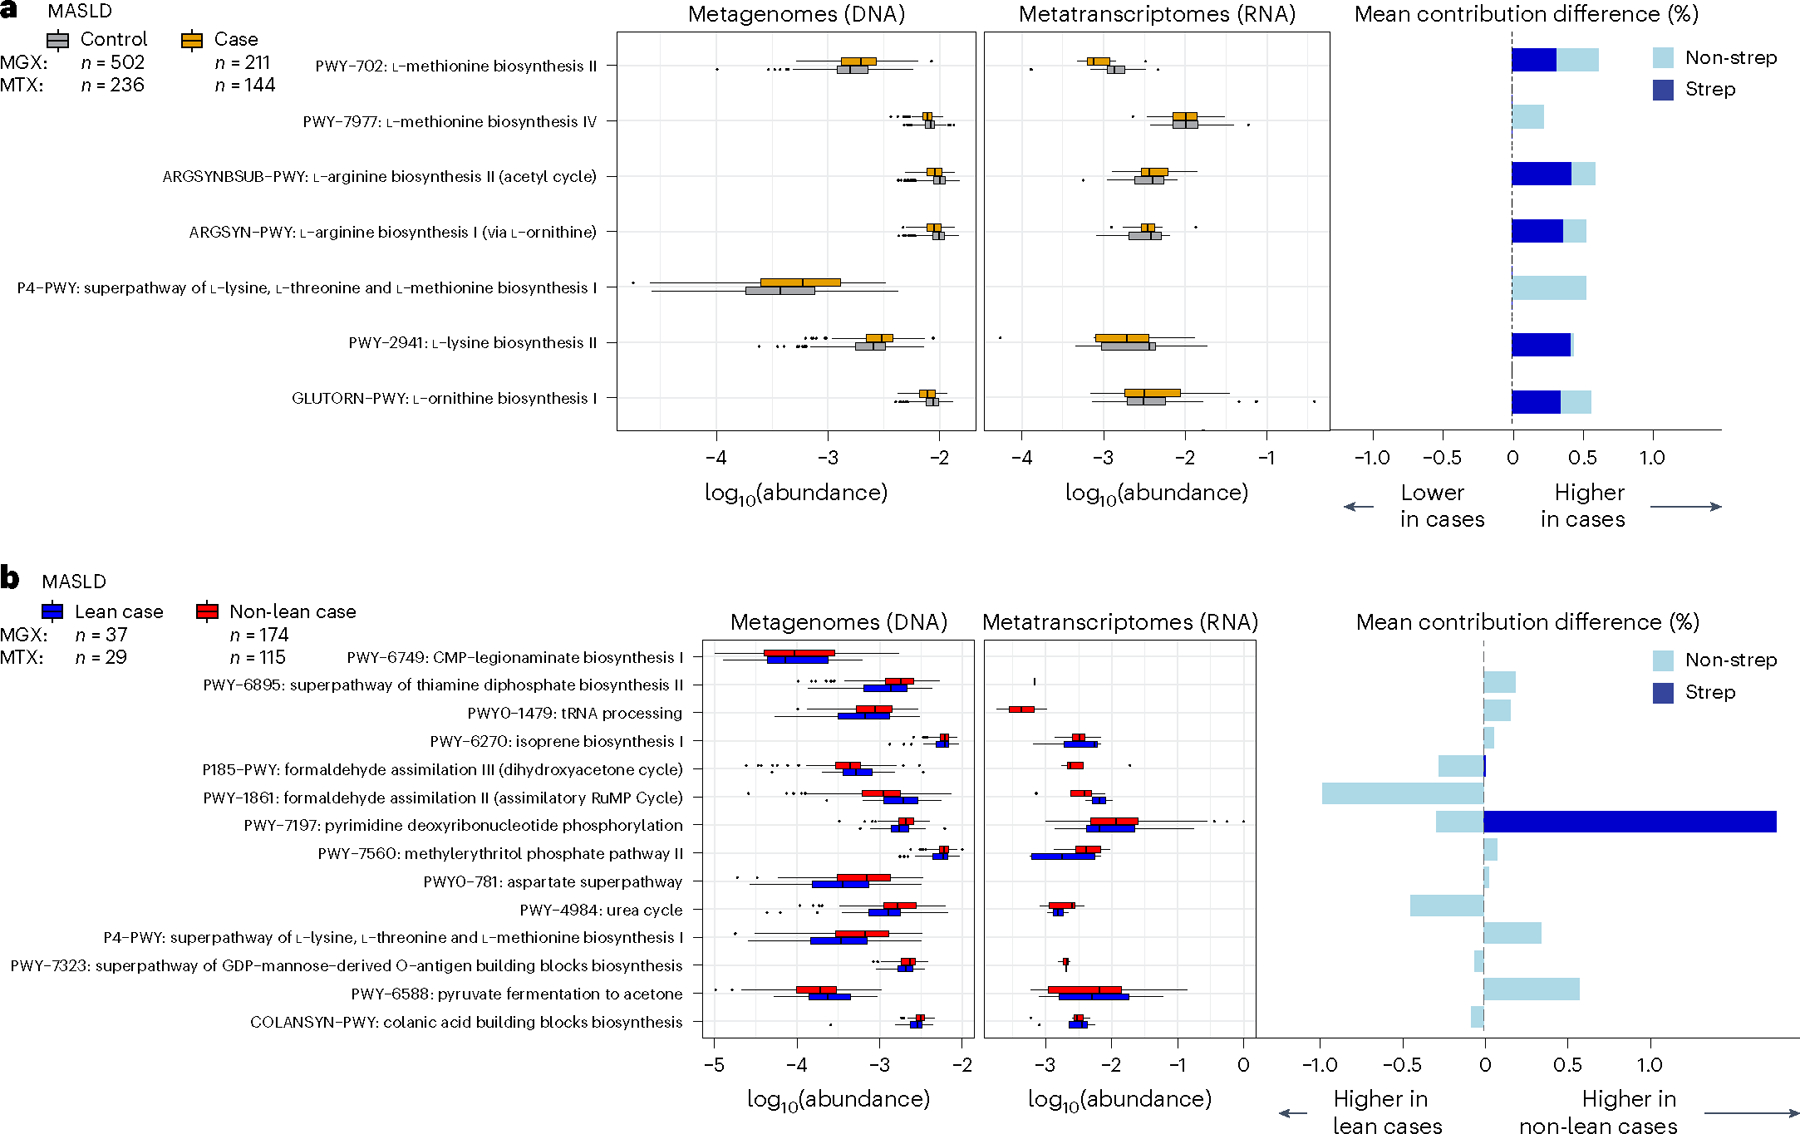
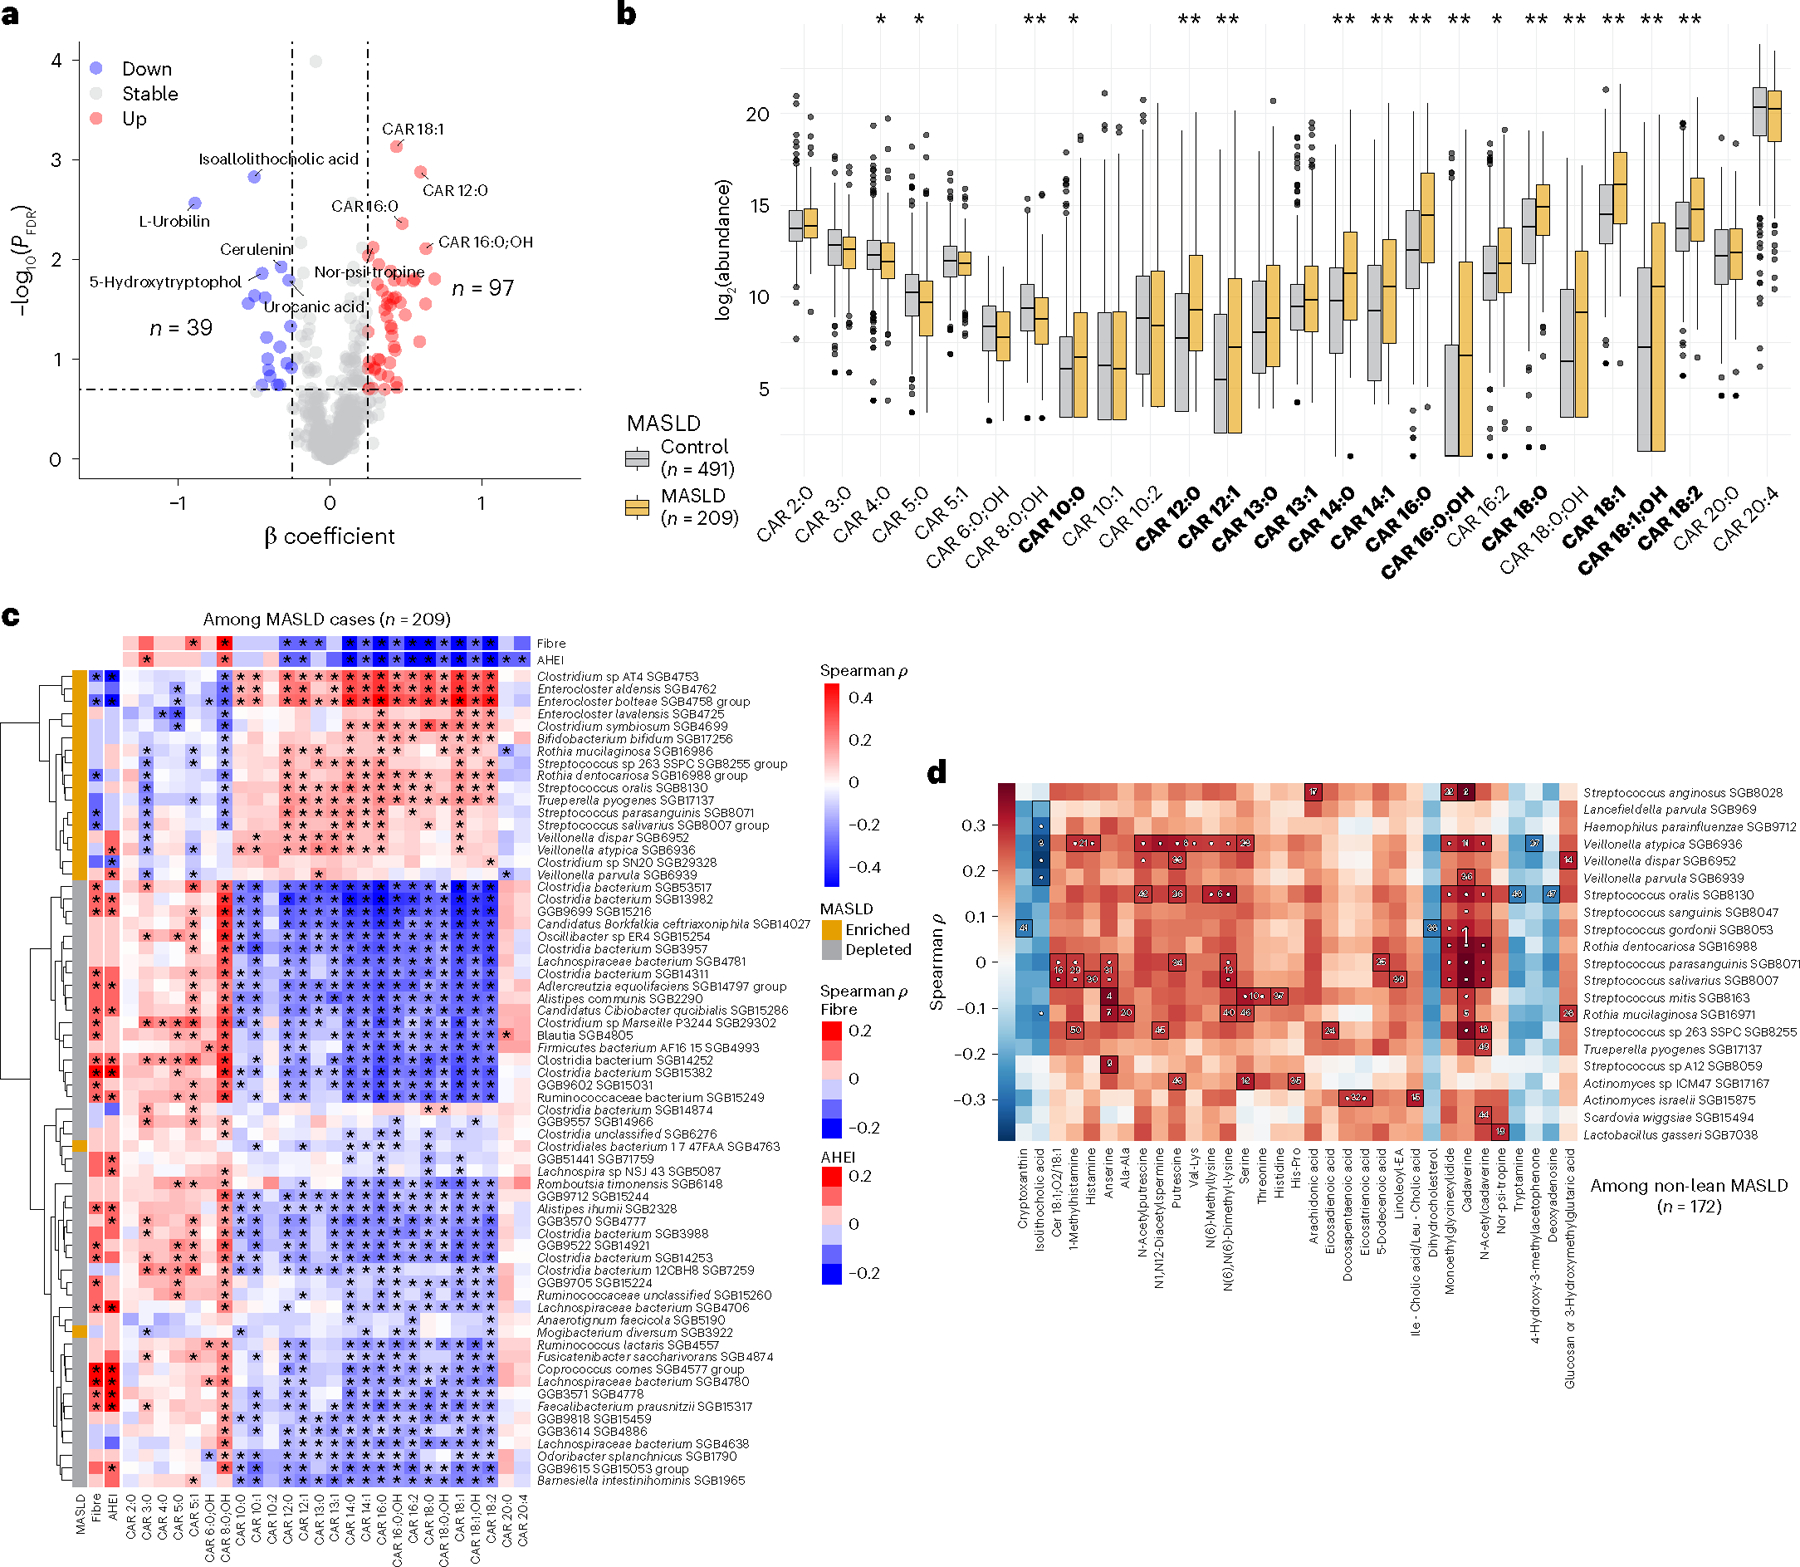
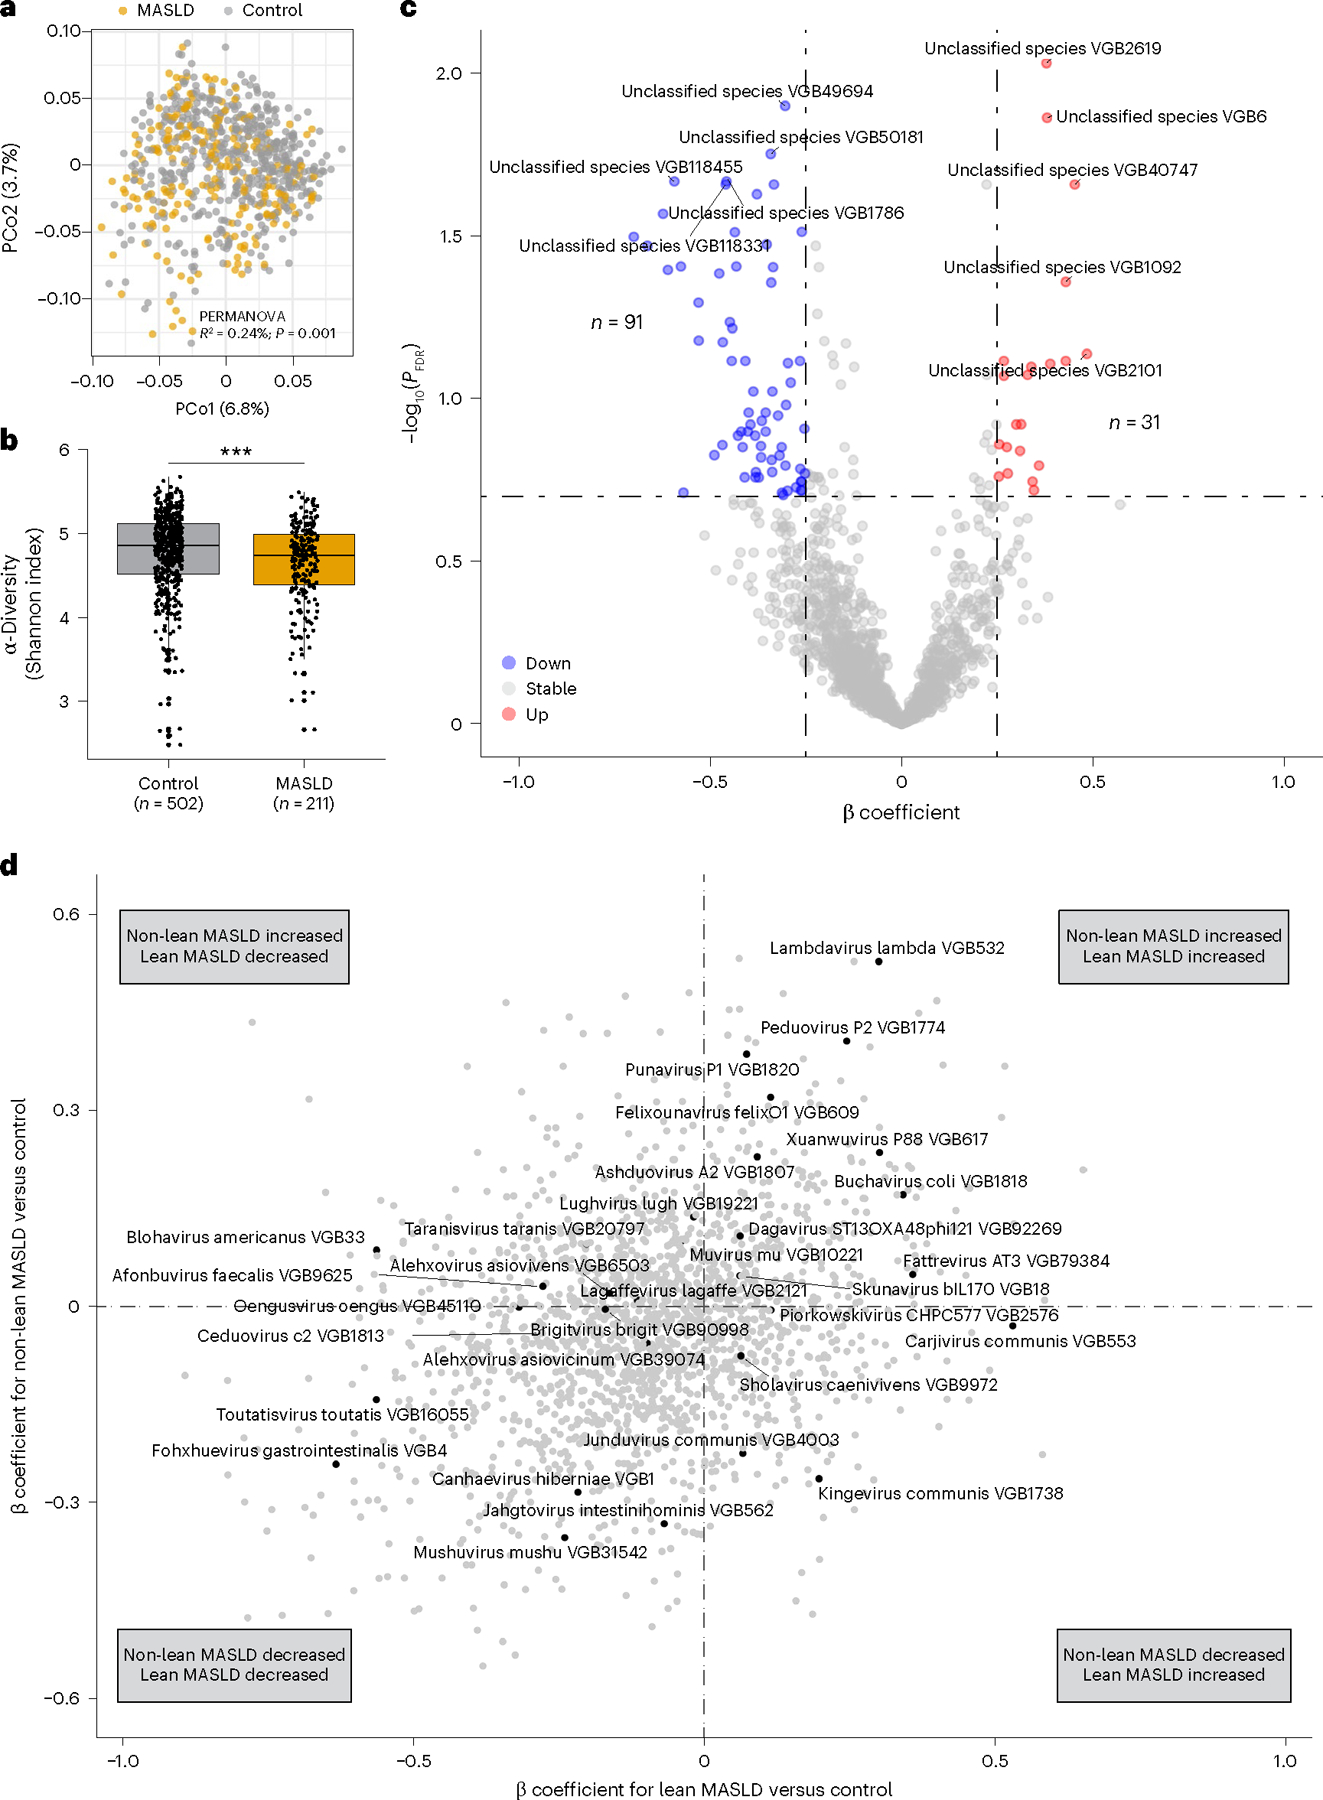
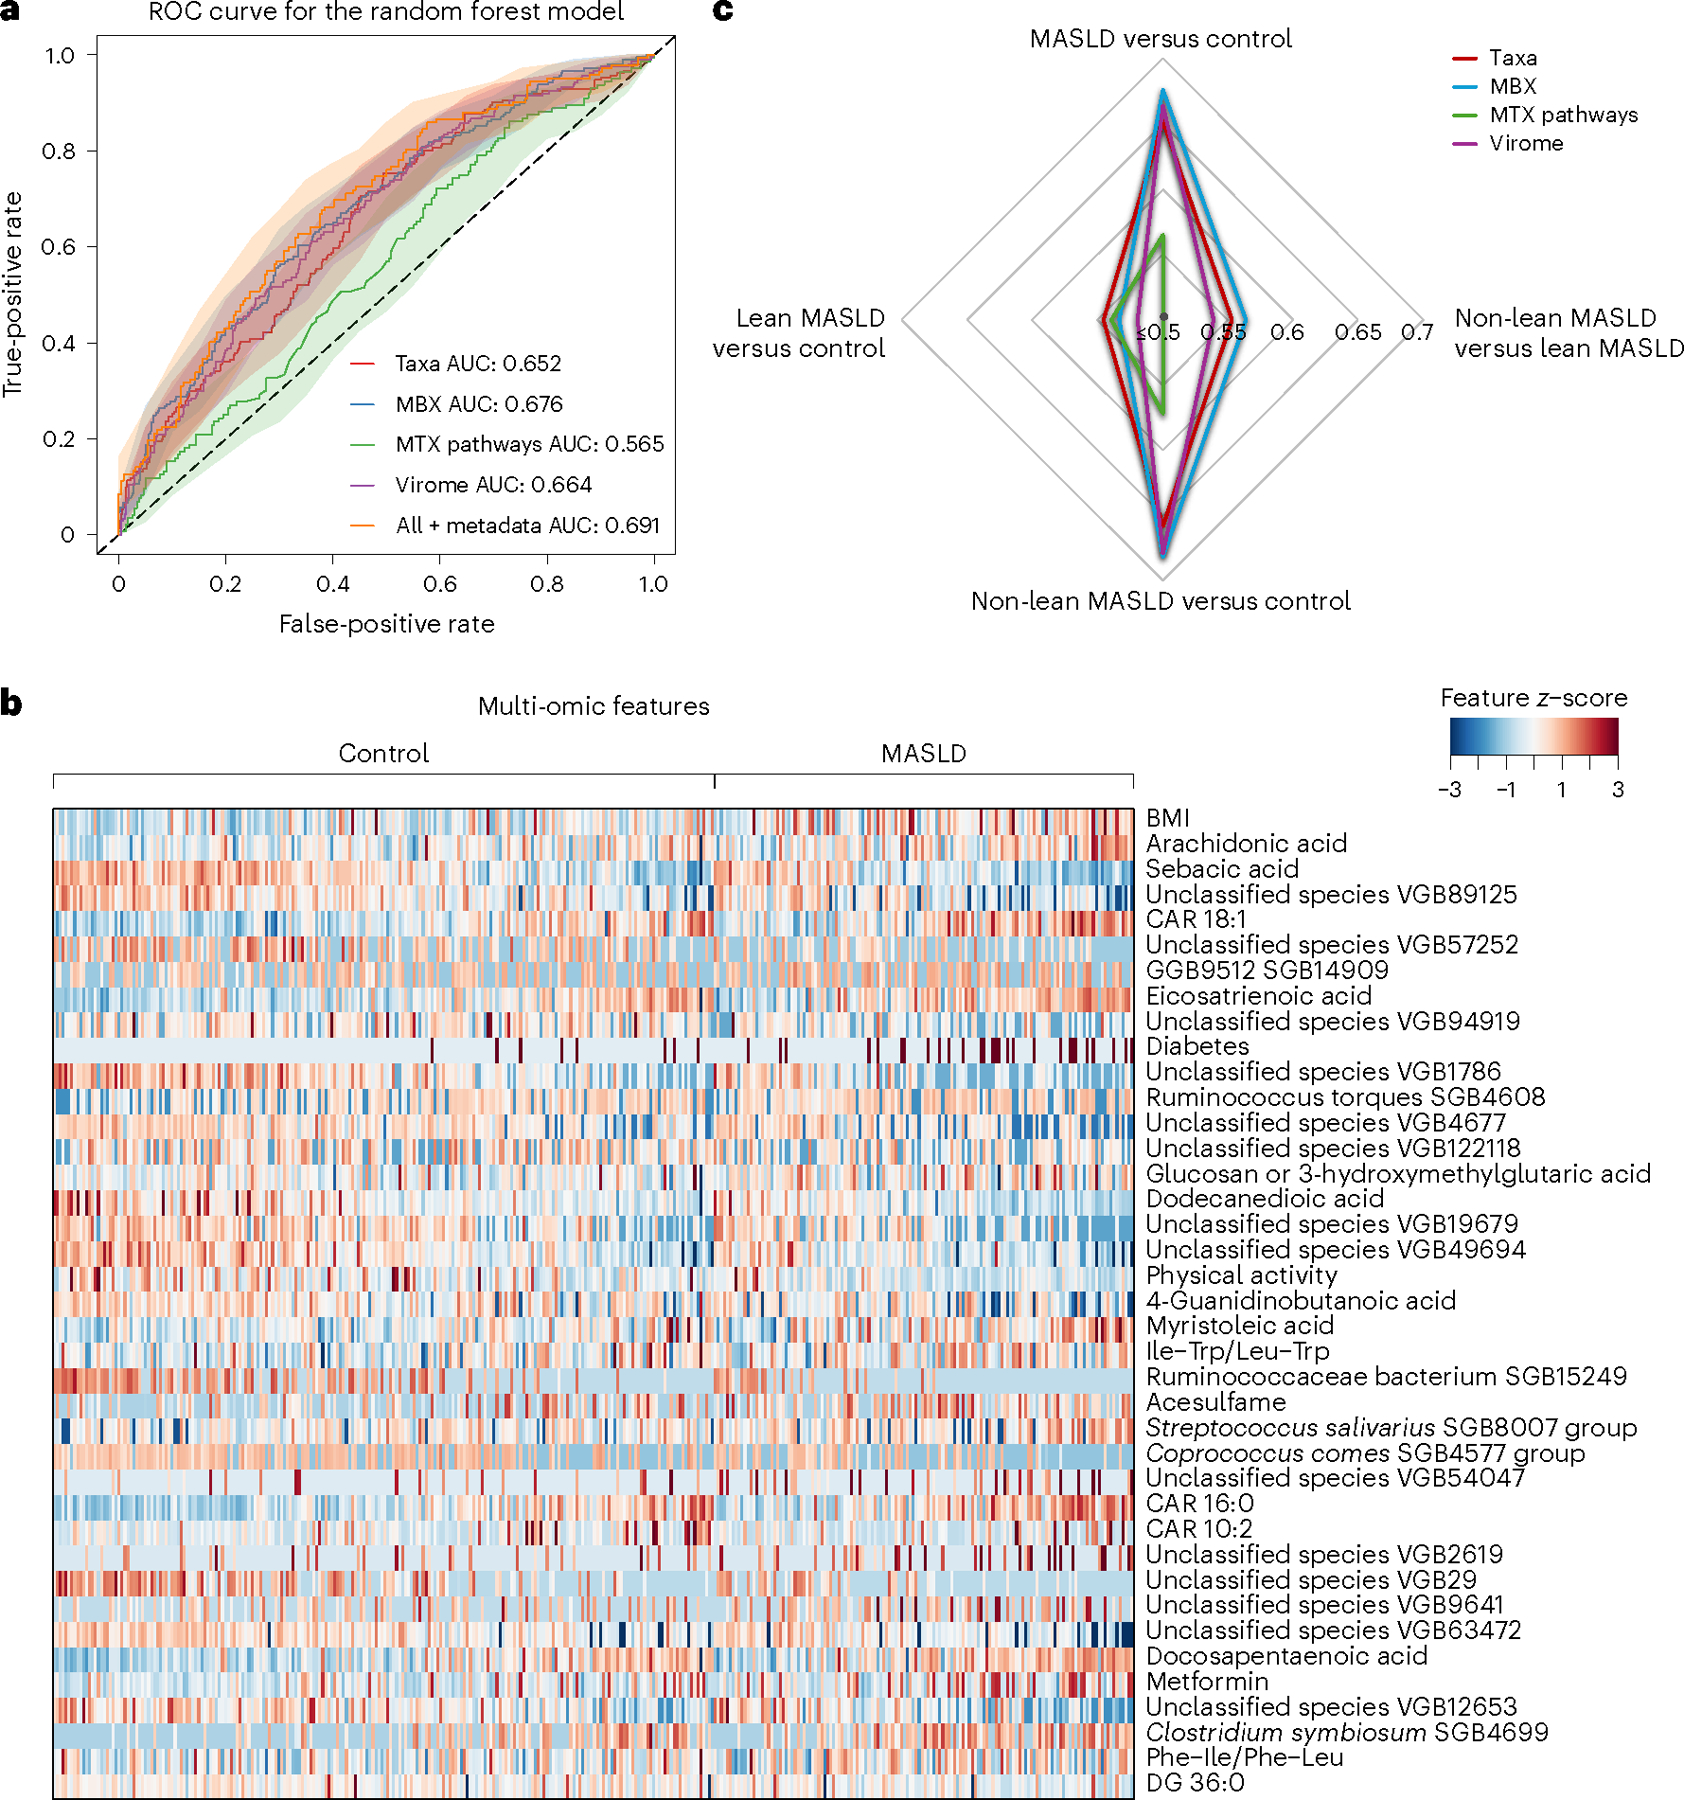
Metabolic dysfunction-associated steatotic liver disease (MASLD) is a common condition linked to obesity and the metabolic syndrome, yet its transkingdom connections have been under-investigated. We performed high-resolution multi-omic profiling-including stool metagenomes, metatranscriptomes and metabolomes-in 211 MASLD cases and 502 controls from a cohort of female nurses. Here we show that MASLD is associated with shifts in 66 gut bacterial species, including widespread enrichment of oral-typical microbes, and transkingdom dysbiosis involving not only bacterial but also viral taxa. Streptococcus spp. are more abundant in non-lean versus lean MASLD, the latter being a paradoxical subtype of a disease typically associated with increased adiposity. These microbial changes correspond with shifts in transcripts and metabolites, including increases in polyamines and acylcarnitines and reductions in secondary bile acids. We highlight gut viral perturbations in MASLD, showing that expansions of bacteriophage targeting oral-typical bacteria correspond to expansions of their bacterial hosts in the gut. We provide a comprehensive resource for understanding MASLD and highlight transkingdom multi-omic microbial shifts as potential contributors to its aetiopathogenesis.


Conflict of interest statement

Competing interests: P.N. and B.H. were employees of Empress Therapeutics. C.H. is on the Scientific Advisory Board of Empress Therapeutics, Seres Therapeutics and ZOE Nutrition. All others declare no competing interests.

Figures

Extended Data Figure 1:
Extended Data Figure 1:. Bacterial alpha- and beta-diversity differ by MASLD case status and MASLD subtype.
A. There was a small but statistically significant difference in beta-diversity based on case/control status, largely attributable to characteristic and previously documented trade-offs between Bacteroidetes and Firmicutes. The plot shows a principal coordinates analysis (PCoA) based on Bray-Curtis dissimilarity. Multivariable PERMANOVA adjusting for age, body mass index, physical activity, diabetes mellitus, and diet quality was performed among prevalent species (after 10% prevalence filter), with two-sided p-value reported. B. In 211 individuals with MASLD (compared to 502 non-MASLD controls), alpha-diversity was reduced, which is a broad measure of overall community structure and indicates lower species richness and evenness. Boxplots are presented as median with the lower and upper hinges corresponding to the interquartile range. The lower and upper whiskers show the smallest and largest value within the 1.5 x interquartile range. Statistical comparisons were performed using the Wilcoxon rank-sum test (p-value = 2.1e-6). ***: Two-sided p-value ≤ 0.001 C. Alpha-diversity was similarly lower among 37 participants with lean MASLD and 174 participants with non-lean MASLD. Boxplots are presented as median with the lower and upper hinges corresponding to the 25% and 75%, respectively. The lower and upper whiskers show the smallest and largest value within the 1.5 x interquartile range. Statistical comparisons were performed using the Wilcoxon rank-sum test (p-value = 9.2e-5 comparing non-lean MASLD vs. controls; p-value = 4.1e-4 comparing lean MASLD vs. controls; p-value = 0.12 comparing non-lean MASLD vs. lean MASLD). ***: Two-sided p-value ≤ 0.001
Extended Data Figure 2:
Extended Data Figure 2:. Differences in overall metabolomic profiles in MASLD and correlations between bacteria and acylcarnitines by chain length in controls.
A. The community-level metabolomic abundance in MASLD and controls is depicted by principal coordinates analysis (PCoA) using Bray-Curtis dissimilarity. Multivariable PERMANOVA results (with two-sided p-value) demonstrate distinct metabolomic landscapes between the groups. B. Similar to samples from MASLD, among controls, there were clear clustering patterns between bacteria and acylcarnitines based on chain length and dietary intake. Alternative Healthy Eating Index (AHEI) and fiber represent long-term dietary intake using the cumulative average prior to stool collection (Methods). Cells are colored by Spearman correlation coefficient. *: PFDR < 0.20, adjusted for multiple comparisons between metabolites.
Extended Data Figure 3:
Extended Data Figure 3:. Distinct correlation patterns between oral-typical bacteria and MASLD-associated metabolites in non-lean vs. lean MASLD.
A. The correlations between oral-typical bacteria and metabolites vary between non-lean and lean MASLD cases. The analysis includes all oral-typical bacteria and MASLD-associated metabolites. Dot size represents the magnitude of the absolute difference in correlations between non-lean and lean MASLD cases (i.e., |ρ(bacteria and metabolites) for non-lean - ρ(bacteria and metabolites) for lean|). Dot color reflects the directionality of the correlations in each group: e.g., green dots signify correlations that are negative for non-lean and positive for lean MASLD, whereas blue dots indicate correlations that are positive for non-lean and negative for lean MASLD, respectively. This visualization highlights the nuanced interplay between oral-typical microbes and metabolites across MASLD phenotypes. B. Selected microbe-metabolite pairs show different interaction patterns between non-lean vs. lean MASLD (Suppl. Table 9). Spearman correlation test was used to fit the line, with the corresponding two-sided p-value shown. Bacteria are arcsine square root transformed and metabolites are log2 transformed.
Extended Data Figure 4:
Extended Data Figure 4:. Distinct correlation patterns between bacterial taxa and long-chain acylcarnitines in non-lean vs. lean MASLD.
The analysis includes bacterial taxa with at least four instances of absolute correlation differences greater than 0.3 and acylcarnitines. Dot size represents the magnitude of the absolute difference in correlations between non-lean and lean MASLD cases (i.e., |ρ(bacteria and acylcarnitines) for non-lean - ρ(bacteria and acylcarnitines) for lean|). Dot color reflects the directionality of the correlations in each group. This visualization highlights the interplay between microbes and acylcarnitines (based on chain length) across MASLD phenotypes.
Extended Data Figure 5:
Extended Data Figure 5:. Alpha-diversity and gut viral taxa.
A. Compared to non-MASLD controls (502 individuals), both non-lean MASLD (174 individuals) and lean MASLD (37 individuals) had reduced viral alpha-diversity. Boxplots are presented as median with the lower and upper hinges corresponding to the 25% and 75%, respectively. The lower and upper whiskers show the smallest and largest value within the 1.5 x interquartile range. Statistical comparisons were performed using the Wilcoxon rank-sum test (p-value = 9.1e-4 comparing non-lean MASLD vs. controls; p-value = 7.5e-3 comparing lean MASLD vs. controls; p-value = 0.24 comparing non-lean MASLD vs. lean MASLD). ***: Two-sided p-value ≤ 0.001; **: p-value ≤ 0.01 B. Similar to metagenomic analysis, metatranscriptomic analysis also demonstrated that lean MASLD had a different proportion of classified/unclassified viruses compared to non-lean MASLD. β coefficients of non-lean MASLD (vs. controls) are plotted against β coefficients of lean MASLD (vs. controls) from multivariable linear models. Black dots indicate classified or known RNA viral species, while gray dots indicate unclassified RNA viral species. C. As with bacteria/archaea, in MASLD, there were distinct clustering patterns between MASLD-associated viruses (largely unclassified) and acylcarnitines based on chain length. *: PFDR < 0.20, adjusted for multiple comparisons between metabolites. The heatmap includes viral taxa with at least ten significant correlations (PFDR < 0.20) with acylcarnitines.
Extended Data Figure 6:
Extended Data Figure 6:. Co-occurrence and co-exclusion of oral-typical bacteria and MASLD-associated viruses in lean MASLD.
In lean MASLD, hierarchical all-against-all association testing demonstrated broad co-occurrence and co-exclusion of oral-typical bacteria and MASLD-associated viruses. *: differentially abundant bacteria in MASLD.
Extended Data Figure 7:
Extended Data Figure 7:. Co-occurrence and co-exclusion of oral-typical bacteria and MASLD-associated viruses in non-lean MASLD.
In non-lean MASLD, hierarchical all-against-all association testing demonstrated broad co-occurrence and co-exclusion of oral-typical bacteria and MASLD-associated viruses. *: differentially abundant bacteria in MASLD.
Extended Data Figure 8:
Extended Data Figure 8:. Comparison of machine learning models.
Random forest, kernel support vector machine, linear support vector machine, elastic net, LASSO, and ridge regression models using bacterial/archaeal, metabolomic, viral, and metatranscriptomic features along with clinical metadata, with random forest model showing a comparatively high area under the receiver operating curve (AUC = 0.691) and the highest area under the precision-recall curve (0.599).
Extended Data Figure 9:
Extended Data Figure 9:. Top multi-omic features distinguishing non-lean vs. lean MASLD and comparative classification performance across MASLD subtypes.
A. Feature importance for the comprehensive random forest model (i.e., with all multi-omic data types with clinical metadata) differentiating non-lean MASLD cases vs. lean MASLD cases. Z-scores for the top selected features with high median Gini importance (Suppl. Table 12) are displayed as a heatmap. B. The classifications of non-lean vs. lean MASLD cases, non-lean MASLD cases vs. controls, lean MASLD cases vs. controls, non-lean MASLD cases vs. non-lean cases, and lean MASLD cases vs. lean controls were performed using bacteria/archaea, metabolites (MBX), unstratified metatranscriptomic (MTX) pathways, and viral features.
Extended Data Figure 10:
Extended Data Figure 10:. Strong correlation between cases with and without defined cardiometabolic diagnostic criteria.
A. Confirmed MASLD cases and potential non-MASLD cases demonstrated reasonable correlation given the small sample size of steatotic liver disease without a confirmed cardiometabolic comorbidity (N=11). β coefficients for bacteria/archaea among potential non-MASLD cases (vs. controls) are plotted against β coefficients of confirmed MASLD cases (vs. controls) from multivariable linear models adjusted for age, body mass index, physical activity, diabetes mellitus, and diet quality. Spearman correlation test was used to fit the line, with the corresponding two-sided p-value shown. B. Confirmed MASLD cases and all potential MASLD cases demonstrated high correlation. β coefficients for bacteria/archaea among all potential MASLD cases (vs. controls) are plotted against β coefficients of confirmed MASLD cases (vs. controls) from multivariable linear models. Spearman correlation test was used to fit the line, with the corresponding two-sided p-value shown. C. Effect estimates in microbial differences from multivariable linear modeling between MASLD vs. controls with and without MASLD-defining comorbidities were generally concordant. Comparing the effect estimates for cases vs. controls without comorbid conditions (body mass index ≥ 25 kg/m2, have type 2 diabetes, high blood pressure, high cholesterol, or reported using medications for hypertension, diabetes, or high cholesterol) demonstrated high correlation with those for cases vs. all controls. Multivariable β coefficients for confirmed MASLD cases vs. controls without cardiometabolic comorbidities are on the y-axis vs. β coefficients for confirmed MASLD cases vs. all controls are on the x-axis. Spearman correlation test was used to fit the line, with the corresponding two-sided p-value shown.
Figure 1:
Figure 1:. Experimental design to link transkingdom gut multi-omics and MASLD.
A. We profiled stool samples from 713 individuals embedded within the Micro-N study, including 211 MASLD cases and 502 controls. All participants provided detailed health and lifestyle information every two years since 1989 and dietary data every four years through validated food frequency questionnaires (FFQs). B. PERMANOVA testing demonstrates that MASLD has a small but statistically significant association with overall bacterial, viral, and metabolic community structure, as well as functional potential (metagenomic profiles), and that diabetes status accounts for the largest proportion of inter-individual variation in metabolite profiles. Diet was represented by Alternative Healthy Eating Index (AHEI). Univariable models were fitted. MetaCyc functions were unstratified. **: p-value < 0.01; *: p-value < 0.05 C. Stool samples were profiled using shotgun metagenomics, metatranscriptomics, and metabolomics. The five most abundant (by mean) gut bacterial features, metabolites, viruses, and metagenomic and metatranscriptomic MetaCyc functions are shown. For visualization, zero values were assigned half the minimum value prior to log transformation. D. Phylogenetic differences drive segregation of MASLD gut microbial communities. Despite some overlap in signatures with co-occurring diabetes mellitus and increased BMI, gut bacterial features exclusively associated with MASLD are present, particularly among oral-typical microbes. Outermost barplots represent the average relative abundance for each species. Top two enriched and top two depleted taxa in MASLD are depicted, demonstrating no clear association with BMI.
Figure 2:
Figure 2:. Oral-typical microbes drive differences in MASLD gut microbial ecology.
A. 66 microbial species were significantly associated with case/control status (significant enrichment of 19 and depletion of 47 species), including 11 oral-typical taxa. Top five enriched and top five depleted species in MASLD are labeled (Suppl. Table 2). β coefficients are from multivariable linear modeling adjusting for age, BMI, physical activity, diabetes mellitus, and diet quality (Methods). For multiple hypothesis testing correction, the Benjamini-Hochberg method was applied to control the false discovery rate (FDR), considering differences with FDR-corrected p-values (PFDR) < 0.20 significant. B. Systematic assessment revealed a broad expansion of oral-typical microbes in MASLD (211 individuals with MASLD). The summed abundance of oral-typical species is depicted (Methods). Boxplots are presented as median with the lower and upper hinges corresponding to the interquartile range. The lower and upper whiskers show the smallest and largest value within a 1.5 x interquartile range. Statistical comparisons were performed using the Wilcoxon rank-sum test (p-value = 2.8e-5). ***: Two-sided p-value ≤ 0.001 C. The expansion of oral-typical microbes is mainly driven by increases in Streptococcus spp., particularly among 174 non-lean participants with MASLD. Boxplots are presented as median with the lower and upper hinges corresponding to the interquartile range. The lower and upper whiskers show the smallest and largest value within a 1.5 x interquartile range. Statistical comparisons were performed using the Wilcoxon rank-sum test (p-value = 0.021). ***: Two-sided p-value ≤ 0.05 D. While the direction of association between oral-typical microbes and non-lean vs. lean MASLD was generally concordant (quadrants I and III), several bacteria were more strongly linked to one MASLD subtype over the other (quadrants II and IV), with an increase in Streptococcus spp. more frequently observed in non-lean MASLD. β coefficients are calculated as above for prevalent oral taxa (i.e., detected in ≥ 10% samples).
Figure 3:
Figure 3:. Functional metagenomic and metatranscriptomic signatures of MASLD reveal disruptions in arginine and ornithine biosynthesis pathways in MASLD and perturbed cholesterol metabolism in lean vs. non-lean cases.
A. A subset of the 69 differentially abundant MetaCyc metagenomic pathways in MASLD (211 individuals with MASLD with metagenomic data and 144 with metatranscriptomic data; Suppl. Table 5). Barplots depict the mean difference in gene carriage contribution from Streptococcus vs. non-Streptococcus oral taxa for metagenomic pathways (right). Boxplots are presented as median with the lower and upper hinges corresponding to the interquartile range. The lower and upper whiskers show the smallest and largest value within a 1.5 x interquartile range. B. 14 unique MetaCyc metagenomic pathways were significantly altered between non-lean (174 individuals with non-lean MASLD with metagenomic data and 115 with metatranscriptomic data) and lean MASLD. Barplots depict the mean difference in gene carriage contribution from Streptococcus vs. non-Streptococcus oral taxa for metagenomic pathways (right). Boxplots are presented as median with the lower and upper hinges corresponding to the interquartile range. The lower and upper whiskers show the smallest and largest value within a 1.5 x interquartile range.
Figure 4:
Figure 4:. Widespread disruption of gut metabolites in MASLD.
A. We observed the significant enrichment of 97 and depletion of 39 gut metabolites in MASLD, including alterations in isoalloLCA and CARs. β coefficients from multivariable linear modeling are plotted against PFDR. For multiple hypothesis testing correction, the Benjamini-Hochberg method was applied, considering differences with PFDR < 0.20 significant. B. Long-chain CAR abundance was notably enriched in 209 individuals with MASLD. Bolded CARs indicate those significantly altered in MASLD (all enriched) compared to controls after multivariable linear modeling adjusting for age, body mass index, physical activity, diet, and diabetes (Suppl. Table 8). CARs sorted by chain length. Boxplots are presented as median with the lower and upper hinges corresponding to the interquartile range. The lower and upper whiskers show the smallest and largest value within a 1.5 x interquartile range. Statistical comparisons were performed using the Wilcoxon rank-sum test. For multiple hypothesis testing correction among CARs, the Benjamini-Hochberg method was applied. PFDR values were 0.009, 0.004, 4.0e-4, 0.004, 2.5e-7, 5.9e-4, 2.0e-7, 8.4e-5, 3.8e-9, 9.0e-9, 0.007, 1.6e-6, 1.1e-6, 3.8e-9, 4.9e-6, and 1.2e-5 for the corresponding asterisks shown from left to right. *: PFDR < 0.01; **: PFDR < 0.001 C. In MASLD, microbes that were differentially abundant by case/control status demonstrate clear blocks and clustering behavior that was, in turn, linked to dietary quality and fiber intake. Alternative Healthy Eating Index (AHEI) and fiber represent long-term dietary intake using the cumulative average prior to stool collection (Methods). Cells are colored by Spearman correlation coefficient. *: PFDR < 0.20, adjusted for multiple comparisons between metabolites. D. In non-lean MASLD, hierarchical all-against-all association testing demonstrates broad co-occurrence and co-exclusion of oral-typical bacteria and MASLD-associated metabolites.
Figure 5:
Figure 5:. Comparatively understudied gut viral communities segregate individuals with MASLD and its subtypes.
A. MASLD was responsible for a small but statistically significant difference in community-level viral ecology. PERMANOVA was performed on prevalent viral features (present in ≥ 10% samples), with corresponding two-sided p-value shown. B. Viral alpha-diversity was lower in 211 individuals with MASLD vs. 502 controls. Boxplots are presented as median with the lower and upper hinges corresponding to the interquartile range. The lower and upper whiskers show the smallest and largest value within the 1.5 x interquartile range. Statistical comparisons were performed using the Wilcoxon rank-sum test (p-value = 9.4e-5). ***: Two-sided p-value ≤ 0.001 C. 122 differentially abundant viral species (91 depleted and 31 enriched) distinguish the MASLD gut microbiome with annotations for top five enriched and depleted species, most of which were unclassified/novel (Suppl. Table 10). β coefficients from multivariable linear modeling are plotted against PFDR. For multiple hypothesis testing correction, the Benjamini-Hochberg method was applied, considering differences with PFDR < 0.20 significant. D. There is general concordance between viruses enriched and depleted across MASLD subtypes, with most features falling in quadrants I and III. β coefficients of non-lean MASLD (vs. controls) are plotted against β coefficients of lean MASLD (vs. controls) from multivariable linear models. Black dots indicate classified or known viral species, while gray dots indicate unclassified viral species.
Figure 6:
Figure 6:. Combinatorial gut multi-omic analysis reveals transkingdom dysbiosis and accurately classifies MASLD status.
A. A random forest machine learner using bacterial/archaeal, metabolomic (MBX), viral, and metatranscriptomic (MTX) features, with and without clinical metadata, accurately discriminated MASLD cases from controls. B. Feature importance for the comprehensive random forest model (i.e., with all multi-omic data types with clinical metadata) was particularly driven by unclassified viral species. Z-scores for the top selected features with high median Gini importance (Suppl. Table 12) are displayed as a heatmap. C. Area under the receiver operating characteristic curves (AUC) for multiple comparisons using the random forest framework: MASLD vs. controls, non-lean MASLD vs. lean MASLD, non-lean MASLD vs. controls, and lean MASLD vs. controls, with the highest performance for discriminating non-lean MASLD from controls.

Similar articles

Cited by

References

    1. Rinella ME et al. A multisociety Delphi consensus statement on new fatty liver disease nomenclature. J. Hepatol 79, 1542–1556 (2023). 10.1016/j.jhep.2023.06.003 - DOI - PubMed
    1. Estes C, Razavi H, Loomba R, Younossi Z & Sanyal AJ Modeling the epidemic of nonalcoholic fatty liver disease demonstrates an exponential increase in burden of disease. Hepatology 67, 123–133 (2018). 10.1002/hep.29466 - DOI - PMC - PubMed
    1. Yu L-X & Schwabe RF The gut microbiome and liver cancer: mechanisms and clinical translation. Nat. Rev. Gastroenterol. Hepatol 14, 527–539 (2017). 10.1038/nrgastro.2017.72 - DOI - PMC - PubMed
    1. Adams LA, Anstee QM, Tilg H & Targher G Non-alcoholic fatty liver disease and its relationship with cardiovascular disease and other extrahepatic diseases. Gut 66, 1138–1153 (2017). 10.1136/gutjnl-2017-313884 - DOI - PubMed
    1. Simon TG, Roelstraete B, Khalili H, Hagström H & Ludvigsson JF Mortality in biopsy-confirmed nonalcoholic fatty liver disease: results from a nationwide cohort. Gut 70, 1375–1382 (2021). 10.1136/gutjnl-2020-322786 - DOI - PMC - PubMed

LinkOut - more resources