. 2025 Jul 2;15(1):23603.
doi: 10.1038/s41598-025-07717-9.

Modeling mesenchymal stromal cell support to hematopoiesis within a novel 3D artificial marrow organoid system

Affiliations

Modeling mesenchymal stromal cell support to hematopoiesis within a novel 3D artificial marrow organoid system

Bérénice Schell et al. Sci Rep. .

Abstract

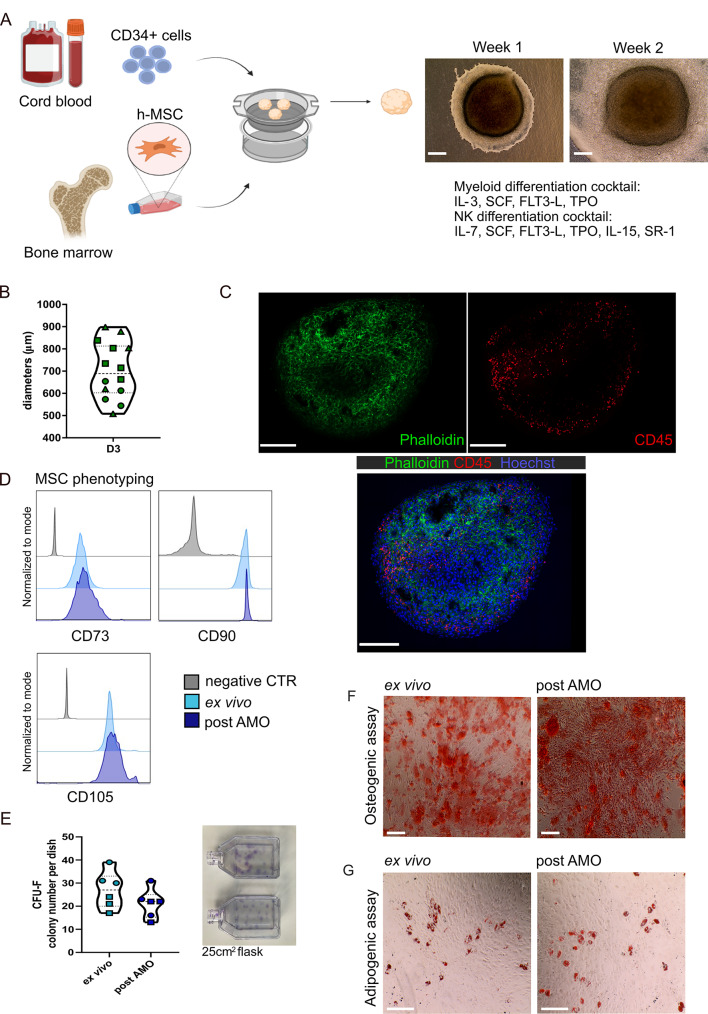
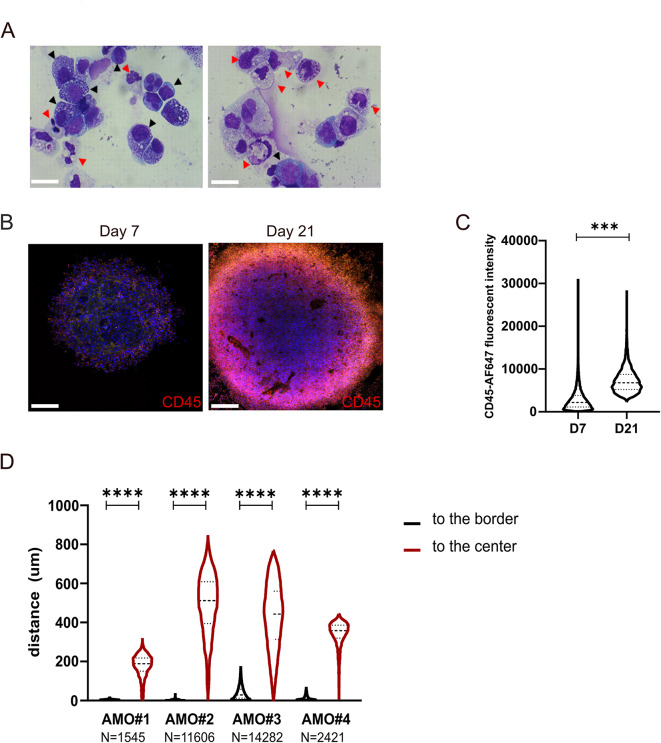
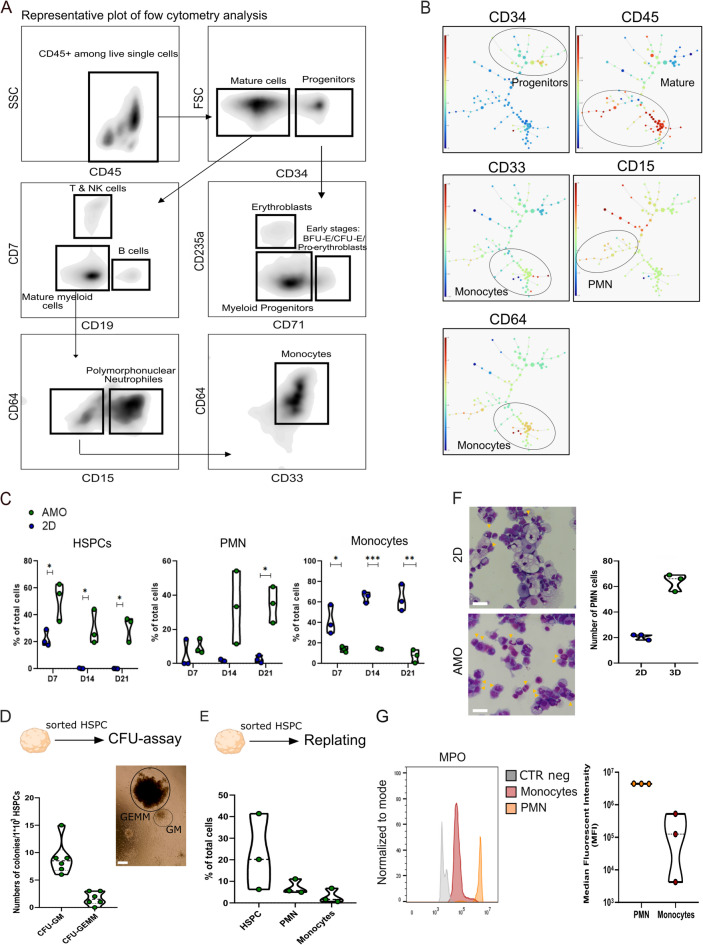
The human bone marrow (BM) microenvironment involves hematopoietic and non-hematopoietic cell subsets organized in a complex architecture. Tremendous efforts have been made to model it in order to analyze normal or pathological hematopoiesis and its stromal counterpart. Herein, we report an original, fully-human in vitro 3D model of the BM microenvironment dedicated to study interactions taking place between mesenchymal stromal cells (MSC) and hematopoietic stem and progenitor cells (HSPC) during the hematopoietic differentiation. This fully-human Artificial Marrow Organoid (AMO) model is highly efficient to recapitulate MSC support to myeloid differentiation and NK cell development from the immature CD34 + HSPCs to the most terminally differentiated CD15 + polymorphonuclear neutrophils, CD64 + monocytes or NKG2A-KIR2D + CD57 + NK subset. Lastly, our model is suitable for evaluating anti-leukemic NK cell function in presence of therapeutic agents. Overall, the AMO is a versatile, low cost and simple model able to recapitulate normal hematopoiesis and allowing more physiological drug testing by taking into account both immune and non-immune BM microenvironment interactions.


Conflict of interest statement

Declarations. Competing interests: Bérénice SCHELL, Lin-Pierre ZHAO, Antoine TOUBERT, Marion ESPELI, Karl BALABANIAN, Nicolas DULPHY, Valeria BISIO and the French National Institute of Health and Medical Research (INSERM) declare pending patent application (#EP23306658.8) relating to the AMO system. All other authors have no competing interest.

Figures

Fig. 1
Fig. 1
Artificial Marrow Organoid (AMO) formation and observation. AMO can be formed by concentrating h-MSCs and other cell types and depositing a drop of cell concentrate in a membrane placed over cell-culture medium. (A) CD34 + hematopoietic stem and progenitor cells isolated from cord blood were differentiated into myeloid and NK cells in AMO using an appropriate cocktail of cytokines. Direct optical microscopic observations of AMO with CD34 + HSPCs after 7 and 14 days of culture are shown. Scale bar 100 μm. (B) Violin plot of the AMO diameters on day 3 of culture (n = 14, 3 different h-MSCs are indicated with different shape: MSC#1 square, MSC#2 triangle and MSC#3 circle. N= 5, 5 and 4 replicates respectively). Data are represented as mean ± SD. (C) Analysis of a representative whole mount organoid stained with Hoechst (nuclei, blue), Phalloidin-FITC (stromal counterpart, green) and CD45-AF647 (hematopoietic counterpart cell membrane, red). Scale bar 100 μm. One representative experiment of three is presented. (D-G) Characterization of FACS-sorted h-MSCs after 2 weeks of AMO co-culture, compared to paired ex vivo h-MSCs. (D) Histograms showing expression of 3 mesenchymal lineage markers CD73, CD90 and CD105 assessed by flow cytometry compared to unstained cells (negative control, in grey). H-MSCs are gated on forward scatter. One representative experiment of three is presented. (E) Colony Forming Unit Fibroblast (CFU-F) assay of h-MSCs after crystal violet staining. The 2 different h-MSCs used are indicated with different shape: MSC#1 square, MSC#2 circle. A triplicate for each h-MSC has been performed. (F) Osteogenic differentiation of h-MSCs stained with red alizarin. Scale bar 200 μm. (G) Adipogenic differentiation of h-MSCs observed after oil red staining. Scale bar 50 μm. One representative experiment of three is presented.
Fig. 2
Fig. 2
Myeloid cell commitment from CD34 + HSPCs in AMO. (A) Morphological evaluation of one representative myeloid cell differentiation at 21 days observed after MGG staining of AMO cell cytospin. One representative experiment out of three is presented. Black arrow: immature myeloid cells. Red arrow: mature myeloid cells. Scale bar 60 μm (B-C) Analysis at day 7 (left) and 21 (right) of a representative whole mount organoid stained with Hoechst (nuclei, blue) and CD45-AF647 (hematopoietic counterpart cell membrane, red). (B) Picture of one representative experiment out of three is presented. Scale bar 100 μm. (C) Quantification of the CD45 intensity (N = 15808 and 11237 cells, at day 7 and day 21 respectively) from 3 different experiments; p-value of paired t test < 0.001. Data are represented as mean ± SD. (D) Spatial cells´ distance of CD45 + cells to the organoid border (black) or center (red) at day 7 for 4 independent AMO numerated from 1 to 4 (N = 1545, 11606, 14282, 2421 cells analyzed for independent organoid). Data are represented as mean ± SD.
Fig. 3
Fig. 3
Myeloid cell characterization within the AMO. (A) Gatting strategy for the myeloid differentiation analysis on dissociated AMO: myeloid progenitors (CD34+, CD71- CD235a-), PMNs (CD15+) and monocytes (CD33 + CD64+). Plots at three weeks of differentiation. (B) Tree representation of FLOWSOM clustering colored by pseudotime calculated using trajectory analysis with Wishbone algorithm of myeloid cell differentiation taking CD34 + CD38- HSC population as starting cell type. The size of nodes is proportional to the number of cells in the given cluster. Calculation and figure were made with the OMIQ software (https://www.omiq.ai). The differentiation stages have been manually added to the figure based on the expression of main lineage markers. The same FLOWSOM tree is represented from the left panel colored by CD34, CD45, CD33, CD15, CD64 intensity (C) Percentage of HSPCs (N = 3, Wilcoxon test p-value: 0.03, 0.02 and 0.005 for day 7, day 14 and day 21 respectively) PMNs (N = 3, Wilcoxon test p-value: 0.4, 0.07 and 0.007 for day 7, day 14 and day 21 respectively) and monocytes at the each time point in the AMO (green) and the 2D (blue) model (N = 3, Wilcoxon test p-value: 0.03, 0.0001 and 0.002 for day 7, day 14 and day 21 respectively). (D) Colony-forming unit assay of FACS-sorted CD34 + HSPC from AMO after 2 weeks of culture with the myeloid differentiation protocol. CFU-GM, granulocyte-macrophage colony-forming unit; CFU-GEMM, granulocyte, erythrocyte, monocyte, megakaryocyte colony-forming unit. Representative phase contrast microscopy of colonies morphology (right). Scale Bar 200 μm. N = 3. (E) Percentage of HSPCs, PMNs, and monocytes after 2 weeks of culture with the myeloid differentiation protocol, in a secondary AMO built with CD34 + HSPCs replated from a primary AMO. (F) Morphological evaluation of one representative myeloid cell differentiation at 14 days, observed after MGG staining of cell cytospin recovered from 2D cultures or AMO. One experiment out of three is presented. Orange arrow points to PMNs. Scale bar 60 μm. PMN and monocytes cells count for 3 independent experiments (right panel). (G) Histogram of intracellular MPO expression (left) and median fluorescent analysis (MFI, right) on PMN (orange) and monocytes (red) after 14 days of culture with the myeloid differentiation protocol within the AMO.
Fig. 4
Fig. 4
NK cell differentiation from HSPCs to mature effector cells. (A) Gating strategy allowing to distinguish the different stages of NK cell maturation: HSC (CD34 + CD38-), CLP (CD34 + CD38 + CD10 + CD45RA+), immature NK cells (stage 3: CD34- CD45RA + CD56- CD16-), and mature NK cells (stage 4: CD34- CD45RA + CD56bright CD16-, stage 5: CD34- CD45RA + CD56dim CD16 + and stage 6: CD34- CD45RA + CD56dim CD16 + CD57 + KIR2D+/-). Plots at two weeks of differentiation. (B) Tree representation of SPADE clustering colored by pseudotime calculated using trajectory analysis with Wishbone algorithm of NK cell differentiation taking CD34 + CD38- HSC population as starting cell type. The size of nodes is proportional to the number of cells in the given cluster. Calculation and figure were made with the OMIQ software (https://www.omiq.ai/). The differentiation stages have been manually added to the figure in base of the expression of main lineage markers. The same SPADE tree is represented in the lower panel colored based on CD34 and CD56 intensity. For other markers, see Supplemental Fig. 2B. (C) Evolution of NK cell differentiation stages in percentage at two and four weeks of AMO culture (N = 2 at 2 weeks and N = 3 at 4 weeks), calculated as percentage of total NK cells using the gating strategy above mentioned. (D) Phenotype of a representative AMO after two weeks; plot of live NK cells gated on stage 5 cell subset as defined in (A). The positivity of NK cell receptors is assessed by comparison to unstained cells gated on forward scatter. (E) Evaluation of NK cell polyfunctionality after 3 weeks of AMO culture (N = 4). After organoid dissociation, NK cells were cultured either in presence of the NK sensitive K562 cell line or with PMA-Ionomycin. NK cell degranulation of cytolytic granules (surface expression of CD107a) and IFN-γ and TNF-α intracellular richness were determined by flow cytometry. Proportion of NK cells with monofunction, bifunction and trifunction significantly increased after stimulation by K562 cell line or PMA and ionomycin (p-value of 0.02 and < 0.01 for K562 and PMA-Ionomycin versus control respectively, Fisher exact test).
Fig. 5
Fig. 5
Drug testing. (A) Confocal imaging of NK cell infiltration in a representative AMO after staining with Hoechst (nuclei, blue), CD271-AF488 (h-MSC, green), CellTrace Yellow (CTY; NK cell, yellow) and CD45-AF647 (NK cell, red). Scale bar 50 μm. (B) Lineage markers (CD56 and CD16) representation of spectral flow-cytometry analysis performed on NK cells from the same donor co-cultured for three days with h-MSC (N = 3) in AMO cultures. (C) Overtime assessment of cytotoxic function and cell proliferation on the NK cells after AMO co-culture. Cytotoxicity against K562 cell line (measure of calcein release by fluorescence and expressed in percentage of specific lysis based on spontaneous and maximum release, left panel) and Ki67 marker (right panel). Data are represented as mean ± SD. (D) Confocal imaging and quantification and imaging on the AMO model after treatment with doxorubicin (10µM for two hours) vs. control (DMSO). Hoechst in blue and Doxorubicin in yellow. Scale bar 20 μm. (N = 3, Wilcoxon test p-value < 0,0001). Data are represented as mean ± SD. (E) Quantification of the cytotoxic activity measured by calcein-release by K562 cell line in presence of NK cells co-cultured in AMO in presence of AZA or DAC for three days (N = 3, Mann Whitney test p-value < 0,05). Data are represented as mean ± SD.

References

    1. Lang, Y., Lyu, Y., Tan, Y. & Hu, Z. Progress in construction of mouse models to investigate the pathogenesis and immune therapy of human hematological malignancy. Front. Immunol.14, 1195194 (2023). - PMC - PubMed
    1. Sommerkamp, P., Mercier, F. E., Wilkinson, A. C., Bonnet, D. & Bourgine, P. E. Engineering human hematopoietic environments through ossicle and bioreactor technologies exploitation. Exp. Hematol.94, 20–25 (2021). - PMC - PubMed
    1. Pievani, A. et al. Harnessing mesenchymal stromal cells for the engineering of human hematopoietic niches. Front. Immunol.12 (2021). - PMC - PubMed
    1. Unnikrishnan, K., Thomas, L. V. & Ram Kumar, R. M. Advancement of Scaffold-Based 3D cellular models in Cancer tissue engineering: an update. Front. Oncol.11 (2021). - PMC - PubMed
    1. de Janon, A., Mantalaris, A. & Panoskaltsis, N. Three-Dimensional human bone marrow organoids for the study and application of normal and abnormal hematoimmunopoiesis. J. Immunol.210, 895–904 (2023). - PMC - PubMed

MeSH terms

LinkOut - more resources