

RNA-seq analysis identifies key genes and signaling pathways involved in androgen promotion of sebaceous gland proliferation in Hetian sheep
- PMID: 40604209
- PMCID: PMC12222945
- DOI: 10.1038/s41598-025-08837-y
RNA-seq analysis identifies key genes and signaling pathways involved in androgen promotion of sebaceous gland proliferation in Hetian sheep
Abstract
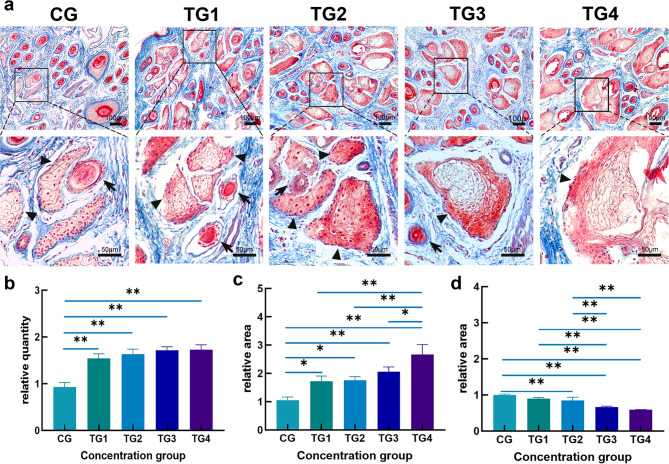
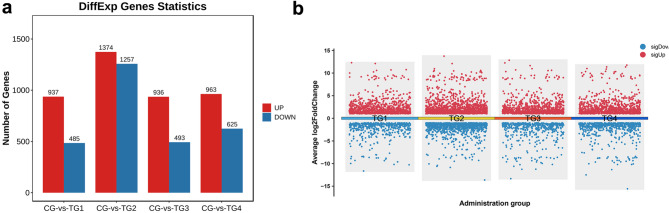
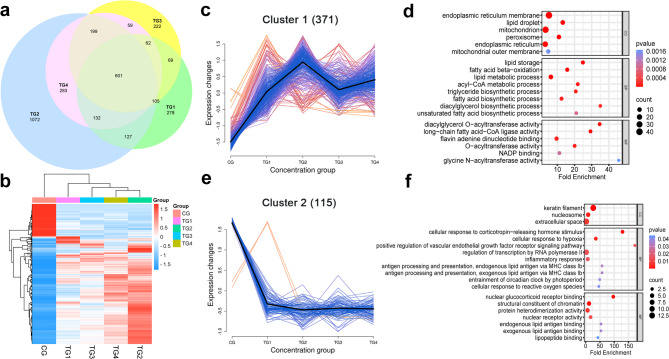
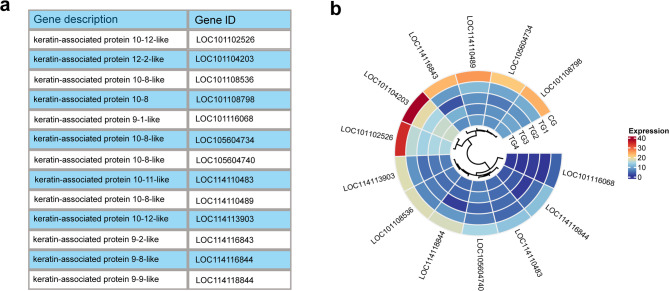
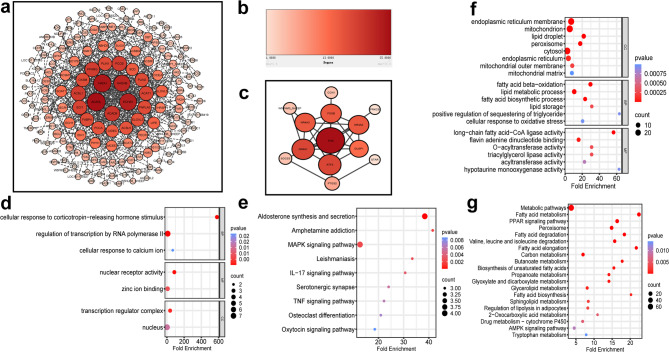
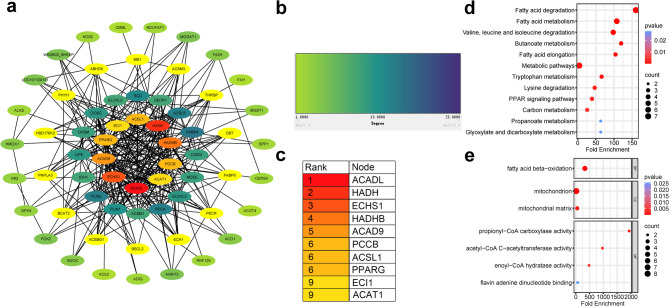
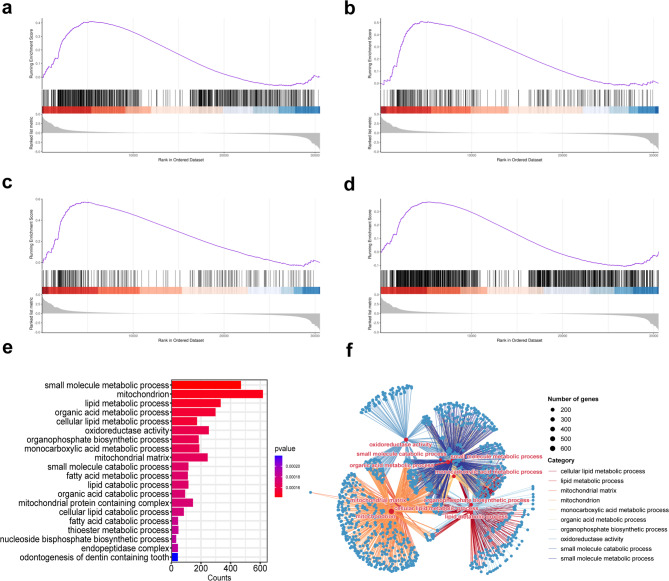
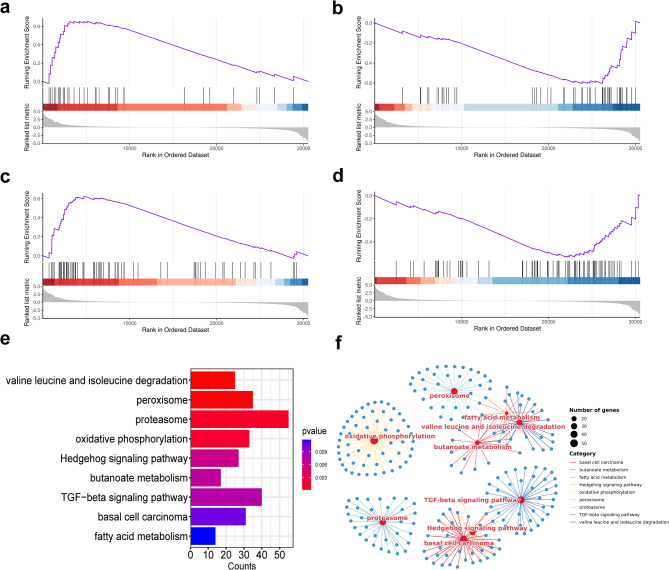
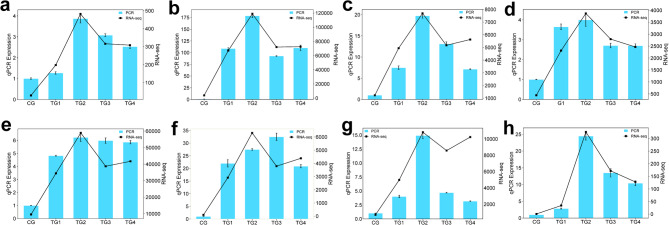
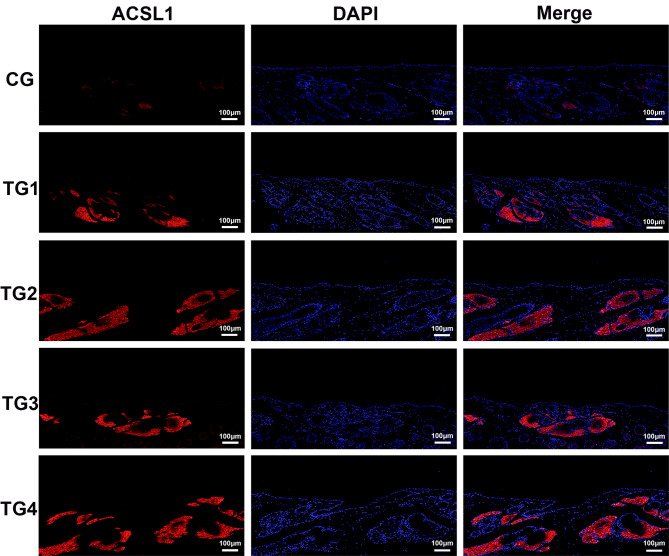
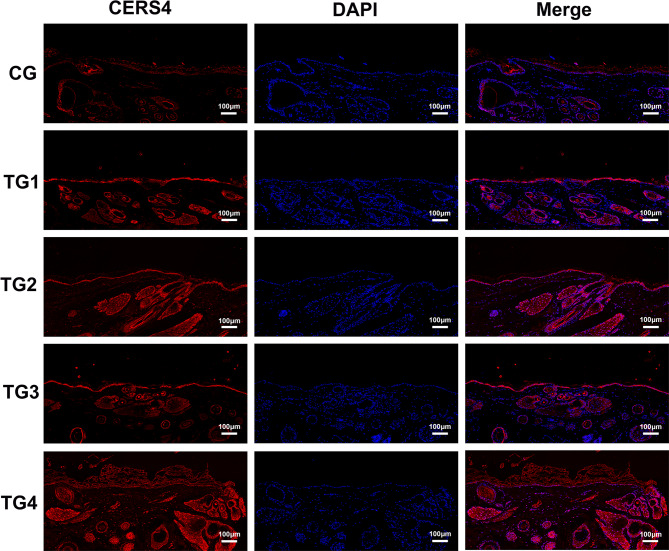
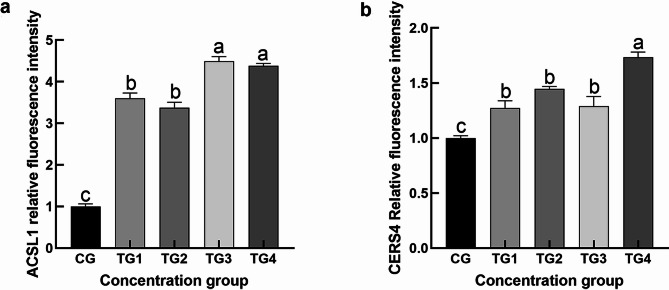
Sebaceous glands (SGs), essential elements of the skin barrier in sheep, are tightly regulated by the androgen signaling pathway. This study investigated how androgens influence SGs hyperplasia in sheep by combining morphological assessments with transcriptomic analysis. Histological examination revealed a significant increase (P < 0.05) in both the number and average size of SGs in the testosterone-treated groups across four concentration gradients compared to the control group. Transcriptome sequencing was performed on fifteen skin samples, revealing that, compared to the control group, 371 genes were upregulated and 115 were downregulated across the four treatment groups. The upregulated genes were predominantly enriched in lipid metabolism pathways, while the downregulated genes were mainly associated with keratin filament structures. Protein-protein interaction (PPI) network analysis identified ten hub genes involved in mitochondrial β-oxidation and lipid synthesis. These findings were further supported by gene set enrichment analysis (GSEA), which indicated significant activation of fatty acid metabolic pathways (P < 0.05). The results of this study suggest that androgens may be involved in SGs hyperplasia in sheep by regulating mitochondrial lipid metabolism-related pathways.
Keywords: GSEA; Hetian sheep; Masson staining; RNA-seq; Skin.
© 2025. Crown.
Conflict of interest statement
Declarations. Competing interests: The authors declare no competing interests. Ethical approval and consent to participate: All methods were carried out in accordance with relevant guidelines and regulations.
Figures
Similar articles
-
Effects of dietary protein levels on genes related to subcutaneous fat deposition and lipid metabolism in Tibetan sheep.BMC Genomics. 2025 Jul 16;26(1):669. doi: 10.1186/s12864-025-11874-6. BMC Genomics. 2025. PMID: 40670965 Free PMC article.
-
Integrated multi-omics and machine learning reveals immune-metabolic signatures in osteoarthritis: from bulk RNA-seq to single-cell resolution.Front Immunol. 2025 Jun 16;16:1599930. doi: 10.3389/fimmu.2025.1599930. eCollection 2025. Front Immunol. 2025. PMID: 40589764 Free PMC article.
-
Deciphering Shared Gene Signatures and Immune Infiltration Characteristics Between Gestational Diabetes Mellitus and Preeclampsia by Integrated Bioinformatics Analysis and Machine Learning.Reprod Sci. 2025 Jun;32(6):1886-1904. doi: 10.1007/s43032-025-01847-1. Epub 2025 May 15. Reprod Sci. 2025. PMID: 40374866
-
Signs and symptoms to determine if a patient presenting in primary care or hospital outpatient settings has COVID-19.Cochrane Database Syst Rev. 2022 May 20;5(5):CD013665. doi: 10.1002/14651858.CD013665.pub3. Cochrane Database Syst Rev. 2022. PMID: 35593186 Free PMC article.
-
Quality improvement strategies for diabetes care: Effects on outcomes for adults living with diabetes.Cochrane Database Syst Rev. 2023 May 31;5(5):CD014513. doi: 10.1002/14651858.CD014513. Cochrane Database Syst Rev. 2023. PMID: 37254718 Free PMC article.
References
-
- Wang, H., Li, S., Wu, T., Wu, Z. & Guo, J. The effect of androgen on wool follicles and keratin production in Hetian sheep. Braz J. Biol.81, 526–536. 10.1590/1519-6984.224056 (2021). - PubMed
-
- Geueke, A. & Niemann, C. Stem and progenitor cells in sebaceous gland development, homeostasis and pathologies. Exp. Dermatol.30, 588–597. 10.1111/exd.14303 (2021). - PubMed
MeSH terms
Substances
Grants and funding
- TDZKBS202309/Tarim University President's Fund
- TDZKBS202309/Tarim University President's Fund
- TDZKBS202309/Tarim University President's Fund
- TDZKBS202309/Tarim University President's Fund
- TDZKBS202309/Tarim University President's Fund
- TDZKBS202309/Tarim University President's Fund
- TDZKBS202309/Tarim University President's Fund
- 2023TSYCLJ0057/Tianshan Talents - Leading Talent Cultivation Project for Technological Innovation
- 2023TSYCLJ0057/Tianshan Talents - Leading Talent Cultivation Project for Technological Innovation
- 2023TSYCLJ0057/Tianshan Talents - Leading Talent Cultivation Project for Technological Innovation
- 2023TSYCLJ0057/Tianshan Talents - Leading Talent Cultivation Project for Technological Innovation
- 2023TSYCLJ0057/Tianshan Talents - Leading Talent Cultivation Project for Technological Innovation
- 2023TSYCLJ0057/Tianshan Talents - Leading Talent Cultivation Project for Technological Innovation
- 2023TSYCLJ0057/Tianshan Talents - Leading Talent Cultivation Project for Technological Innovation
LinkOut - more resources
Full Text Sources
