. 2025 Jul 2;15(1):23610.
doi: 10.1038/s41598-025-98344-x.

Analysis of an engineered organoid model of pancreatic cancer identifies hypoxia as a contributing factor in determining transcriptional subtypes

Affiliations

Analysis of an engineered organoid model of pancreatic cancer identifies hypoxia as a contributing factor in determining transcriptional subtypes

Natalie Landon-Brace et al. Sci Rep. .

Abstract

Pancreatic ductal adenocarcinoma (PDAC) is a high-mortality cancer characterized by its aggressive, treatment-resistant phenotype and a complex tumour microenvironment (TME) featuring significant hypoxia. Bulk transcriptomic analysis has identified the "classical" and "basal-like" transcriptional subtypes which have prognostic value; however, it is not well-established how microenvironmental heterogeneity contributes to these transcriptional signatures. Here, we exploited the TRACER platform to perform single cell transcriptome analysis of organoids at specific spatial locations to explore the effect of oxygen and other cell-generated microenvironmental gradients on organoid heterogeneity. We found that the microenvironmental gradients present in TRACER significantly impact the distribution of organoid transcriptional phenotypes and the enrichment of gene sets linked to cancer progression and treatment resistance. More significantly, we found that microenvironmental gradients, predominantly oxygen, drive changes in the expression of classical and basal-like transcriptional subtype gene signatures. This work suggests that hypoxia contributes to determining transcriptional subtypes in PDAC tumour cells independent of additional cells in the TME and broadly highlights the importance of considering microenvironmental gradients such as oxygen in organoid-based studies.


Conflict of interest statement

Declarations. Competing interests: The authors declare no competing interests.

Figures

Fig. 1
Fig. 1
Transcriptomic analysis of organoid cells isolated from TRACER reveals heterogeneity that is not exclusively dependent on layer of origin. (A) Schematic of the experimental workflow. (B) UMAP plot of organoid cells isolated from all layers of the TRACER construct. Seven organoid cell clusters were identified. (C) UMAP plot of organoid cells isolated from all layers of TRACER coloured by layer of origin reveals cluster identity was determined by gene expression patterns rather than exclusively layer of origin. (D) Heatmap of 10 most differentially expressed genes for each of the seven single-cell clusters. Cluster identity and layer of origin are shown in the coloured bars. Heatmap was made using the Scillus package v 0.5.0. (E) Gene set enrichment analysis by cluster using gene sets compiled from multiple databases indicating gene sets that were significantly enriched (adjusted p-value < 0.05) across databases. The maximum normalized enrichment score (NES) for the reoccurring gene sets is represented. Gray boxes indicate no significant enrichment. A summary of the gene sets and their source database is provided in Table S1. (F) Visualization of a representative gene for each cluster-defining gene set supports cluster annotation [DDIT3 – Unfolded Protein Response, Hypoxia (Hypoxia Response); ITGB1 – EMT, Integrin Signalling (EMT); MKI67 – Cell proliferation, E2F targets (Cell Cycle); PDK4 – Oxidative Phosphorylation (Aerobic Processes); SF3A2 – mRNA Processing (RNA Processing); TNFAIP3 – TNFα signalling (Hypoxia & TNF-α Signalling); IRF1 – Interferon signalling (Inflammatory Response)].
Fig. 2
Fig. 2
Microenvironmental gradients affect the distribution of organoid cell clusters in TRACER and reveal gene sets with graded expression patterns. (A) UMAP plots showing the distribution of the seven organoid cell subpopulation clusters identified in Fig. 1 for each of the layers of TRACER. (B) Quantification of the proportion of cells from each cluster present in each layer. Variations in the cluster proportions across the layers are consistent with expected responses to the hypoxic gradients that are known to exist across the TRACER layers (Chi-square Test for Trend in Proportions, **p < 0.01, ****p < 0.0001). (C) Log normalized expression of cluster-representative genes (from Fig. 1F) show gradients in expression for most cluster markers across the TRACER layers, excluding IRF1 (inflammatory response) (mean ± SEM; slope of the best line vs. 0, ****p < 0.0001). (D) Connor et al. PDAC hypoxia score calculated for the entire organoid cell population from each layer of TRACER. The hypoxia score increases across the layers consistent with the expected graded transcriptional response to the oxygen gradient in TRACER (slope of the best fit line vs. 0, ****p < 0.0001). (E) Heatmap of the top 10 genes that correlate most positively or negatively with layer number. Layer 1 (outer) to Layer 6 (inner) in TRACER shows robust trends with heterogeneity in individual layers. (F) Normalized enrichment score (NES) for selected gene sets significantly enriched (p < 0.05) for correlation with TRACER layer number, where a positive NES (red) indicates increasing enrichment from Layer 1 (outer) to Layer 6 (inner) and a negative NES (blue) indicates decreasing enrichment from Layer 1 to Layer 6. GSEA revealed expected enrichment of gene sets related to cell cycle progression, aerobic metabolism and hypoxia response. Gene sets related to autophagy, protein localization and transport, and several major signalling pathways were also enriched.
Fig. 3
Fig. 3
Microenvironmental gradients contribute to an increase in the proportion of Moffit basal-like organoid cells. (A) UMAP plot showing the distribution of organoid cells classified by their maximal Moffit signature scores in Layer 1 (outer) and Layer 6 (inner) of TRACER. (B) Quantification of organoid cell subtype classification proportions by layer showed a graded increase in the proportion of basal-like organoid cells towards the inner layers of TRACER. (C) Tiriac et al. PDO-derived gemcitabine sensitivity score for organoid cells in each layer of TRACER. Tumour cell intrinsic changes in predicted sensitivity were observed across TRACER layers, consistent with the observed increasing proportion of basal-like organoid cells in the inner layers of TRACER. (D) The Moffit basal-like signature score exhibited a significant graded increase across TRACER layers (slope of the best fit line vs. 0, ****p < 0.0001) (E) The Moffit classical signature score exhibited a significant graded decrease across TRACER layers (slope of the best fit line vs. 0, ****p < 0.0001). (F) Quantification of subtype proportion for each organoid cell cluster revealed an association between the hypoxia response-related clusters and more basal-like organoid cells, in addition to an expected association between the EMT cluster and more basal-like organoid cells. (G) Assessment of the correlation between the basal-like and classical gene signature scores and known hypoxia response pathway gene signature scores for all organoid cells retrieved from TRACER culture (HIF-1α Transcription Factor Network – Pathway Interaction Database, Unfolded Protein Response (UPR) - Reactome and mTOR_4Pathway – Pathway Interaction Database) implicated each hypoxia response pathways to different degrees in promoting a more basal-like organoid cell phenotype (P: Spearman correlation coefficient).
Fig. 4
Fig. 4
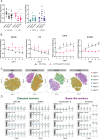
Hypoxia causes changes in the expression of transcriptional subtype markers in multiple PDAC organoid lines, which may be partially reversible. (A) Comparison of the gene expression of GATA6, LYZ (classical) and KRT5, S100A2 (basal-like) markers in Layer 1 (outer) and Layer 6 (inner) of TRACER and in 0.2% pO2 relative to organoid cells cultured in normoxia after 24 h showed decreases in classical gene expression and an increase in KRT5 expression in hypoxia, suggesting hypoxia plays an important role in promoting a more basal-like organoid cell phenotype (TRACER: 9 TRACERs from 3 independent experiments, 0.2% pO2: 14 single layers from 5 independent experiments; t-test vs. 1, *p < 0.05, **p < 0.01, ***p < 0.001, ****p < 0.0001; mean ± SEM). (B) Comparison of the expression of classical and basal-like marker genes between organoid cells cultured in rolled TRACERs for 24 h and organoid cells cultured in rolled TRACERs for 24 h followed by an additional 24 h of culture in an unrolled configuration (normoxia). Graded changes in GATA6 and S100A2 expression were abrogated after an additional 24 h of culture in normoxia, suggesting a specific role for hypoxia in transcriptional reprogramming towards a basal-like phenotype and potential reversibility when returned to normoxia (slope of the best fit line vs. 0, *p < 0.05, *** p < 0.001, ****p < 0.0001; 24 h rolled: 9 TRACERs from 3 independent experiments, 24 h rolled/24 h unrolled: 8 TRACERs from 3 independent experiments; gene expression normalized to Layer 1 (outer), mean ± SEM). (C) TSNE visualisation of high dimensional analysis performed using a panel of PDAC-specific proteins markers by CyTOF in different organoids models (PPTO.46, 120, 135, 179). Cells are colour-coded based on their TRACER layer of origin. (D) Analysis of the expression of GATA6, ARG2 (classical) classical and CK5, Vimentin (basal-like) in TRACERs seeded with different organoid models (organoid model number indicated in grey). Violin plots summarize the metal intensity of each cell and black dots indicate the mean expression per layer for each organoid model and protein marker. Values indicate the measured slopes, * indicate slopes for which gradients are statistically different from 0 (p < 0.05), # indicate a significant difference between Layer 1 and Layer 6 assessed by a t-test (p < 0.05).

Similar articles

References

    1. American Cancer Society. Cancer Facts & Figs. 2022. (2022). https://www.cancer.org/content/dam/cancer-org/research/cancer-facts-and-...
    1. O’Kane, G. M., Ladak, F. & Gallinger, S. Advances in the management of pancreatic ductal adenocarcinoma. CMAJ193, E844–E851 (2021). - PMC - PubMed
    1. Chan-Seng-Yue, M. et al. Transcription phenotypes of pancreatic cancer are driven by genomic events during tumor evolution. Nat. Genet.52, 231–240 (2020). - PubMed
    1. Bailey, P. et al. Genomic analyses identify molecular subtypes of pancreatic cancer. Nature531, 47–52 (2016). - PubMed
    1. Collisson, E. A. et al. Subtypes of pancreatic ductal adenocarcinoma and their differing responses to therapy. Nat. Med.17, 500–503 (2011). - PMC - PubMed

MeSH terms

LinkOut - more resources