. 2025 May 6;3(1):20.
doi: 10.1038/s44303-025-00084-0.

Spillover can limit accurate signal quantification in MPI

Affiliations

Spillover can limit accurate signal quantification in MPI

Ali Shakeri-Zadeh et al. Npj Imaging. .

Abstract

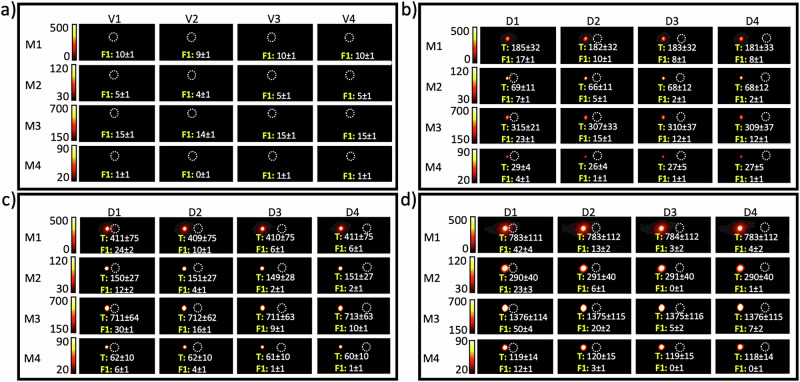
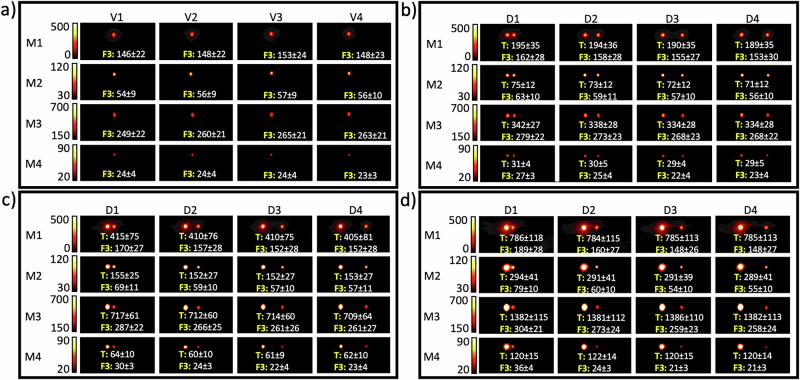
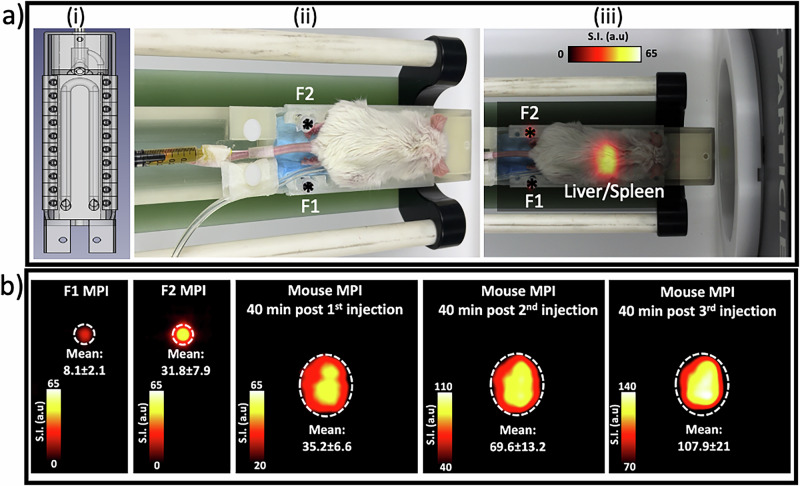
Accurate quantification of the magnetic particle imaging (MPI) signal in vivo remains a significant technical challenge. We assessed the "spillover effect", defined as leakage of signal from adjacent areas within a region of interest, within a field of view containing multiple hot spots, a scenario frequently encountered in vivo after systemic administration of a magnetic tracer. Using custom-designed phantom and in vivo mouse studies we determined the impact of fiducial positioning, iron content, and the iron concentration ratios within those hot spots, as well as the suitability of four different MPI scan modes for accurate signal quantification. Adjustment of the specific "target-to-fiducial distance (TFD)" and "target-to-fiducial Fe concentration ratios (TFCR)" significantly reduced the spillover effect. It's implementation to mitigate spillover effects will increase the accuracy of MPI for in vivo magnetic tracer quantification.


Conflict of interest statement

Competing interests: J.W.M.B. is a paid scientific advisory board member and shareholder of SuperBranche. This arrangement has been reviewed and approved by Johns Hopkins University in accordance with its conflict-of-interest policies. The others have nothing to disclose.

Figures

Fig. 1
Fig. 1. MPI signal quantification of Fiducial 1 (F1, 10 µg Fe/ml) for various target Fe concentrations, distances, and scan modes.
a MPI signals of four vials (V1–V4) for the F1 set obtained with the four different scan modes (M1–4). MPI signal of F1 for different distances (D1–D4) from the target (T), with target Fe concentrations of b 200, c 400, and d 800 µg Fe/ml. Numbers represent the measured signal intensity for each tube. The values of TFCR featured in bd are 20:1, 40:1, and 80:1, respectively. Numbers represent the mean signal value ± standard deviation of each hotspot/annotation. Empty dashed circles represent the location of the tubes without apparent MPI. M1 = standard; M2 = high resolution; M3 = high sensitivity; and M4 = high concentration mode. D1 = 10, D2 = 20, D3 = 30 and D4 = 40 mm.
Fig. 2
Fig. 2. MPI signal quantification of Fiducial 2 (F2, 40 µg/ml) for various target Fe concentrations, distances, and scan modes.
a MPI signals of four vials (V1–V4) for the F2 set obtained with the four different scan modes (M1–4). MPI signal of F2 for different distances (D1–D4) from the target (T), with target Fe concentrations of b 200 µg/ml, c 400 µg/ml, and d 800 µg/ml. Numbers represent the measured signal intensity for each tube. The values of TFCR featured in bd are 5:1, 10:1, and 20:1, respectively. Numbers represent the mean value ± standard deviation of each hotspot/annotation. Empty dashed circles represent the location of the tubes without apparent MPI. M1 = standard; M2 = high resolution; M3 = high sensitivity; and M4 = high concentration mode. D1 = 10, D2 = 20, D3 = 30 and D4 = 40 mm.
Fig. 3
Fig. 3. MPI signal quantification of Fiducial 3 (F3, 160 µg/ml) for various target Fe concentrations, distances, and scan modes.
a MPI signals of four vials (V1–V4) for the F3 set obtained with the four different scan modes (M1–4). MPI signal of F3 for different distances (D1–D4) from the target (T), with target Fe concentrations of b 200 µg/ml, c 400 µg/ml, and d 800 µg/ml. Numbers represent the measured signal intensity for each tube. The values of TFCR featured in bd are 1.25:1, 2.5:1, and 5:1, respectively. Numbers represent the mean value ± standard deviation of each hotspot/annotation. Empty dashed circles represent the location of the tubes without apparent MPI. M1 = standard; M2 = high resolution; M3 = high sensitivity; and M4 = high concentration mode. D1 = 10, D2 = 20, D3 = 30 and D4 = 40 mm.
Fig. 4
Fig. 4. Experimental design and MPI signal quantification for fiducials and liver/spleen in a representative mouse.
a (i) Design of a 3D-printed MPI bed for precision-aligned tracking of fiducials during repeated in vivo imaging. (ii) A mouse positioned on a customized MPI bed for repeated in vivo MPI sessions, with two distinct fiducials with precise alignment. The tail vein was catheterized for repeated injection and secured in place throughout the procedure. The syringe was filled with 400 µl of ferucarbotran at 200 µg Fe/ml. (iii) Representative MPI after the first injection. b MPI signal quantification of fiducials and the liver/spleen at 40-min intervals following sequential injections, free from any other hotspot interference. The first two injections contained 20 µg of iron, while the third dose doubled to 40 µg, totaling 80 µg of iron.
Fig. 5
Fig. 5. The spillover effect on fiducial signals during dynamic in vivo MPI.
Top panels present the experimental setup and MPI scans of fiducials F1 and F2 placed at positions P1-P7 near the liver/spleen (L/S), a with no mouse and bd post intravenous sequential injection of b the first 20 µg, c the second 20 µg, and finally d the additional 40 µg iron. Images were obtained 40 min after each injection. Bar graphs represent quantification of signal intensity for each fiducial, showing how the spillover effect impacts the accuracy of signal measurement as a function of the proximity of fiducials to a tissue of interest. Error bars represent the SD of the mean signal intensity, measured in pixels within the ROIs.

Similar articles

References

    1. Salimi, M., Kuddannaya, S. & Bulte, J. W. M. Pharmacokinetic profiling of unlabeled magnetic nanoparticles using magnetic particle imaging as a novel cold tracer assay. Nano Lett.24, 15557–15564 (2024). - PMC - PubMed
    1. Bulte, J. W. et al. Quantitative “hot-spot” imaging of transplanted stem cells using superparamagnetic tracers and magnetic particle imaging. Tomography1, 91–97 (2015). - PMC - PubMed
    1. Sehl, O. C., Gevaert, J. J., Melo, K. P., Knier, N. N. & Foster, P. J. A perspective on cell tracking with magnetic particle imaging. Tomography6, 315 (2020). - PMC - PubMed
    1. Rivera-Rodriguez, A. et al. Tracking adoptive T cell immunotherapy using magnetic particle imaging. Nanotheranostics5, 431–444 (2021). - PMC - PubMed
    1. Remmo, A. et al. Cell tracking by magnetic particle imaging: methodology for labeling THP-1 monocytes with magnetic nanoparticles for cellular imaging. Cells11, 2892 (2022). - PMC - PubMed

LinkOut - more resources