. 2025 Aug;644(8076):537-546.
doi: 10.1038/s41586-025-09203-8. Epub 2025 Jul 2.

PPP2R1A mutations portend improved survival after cancer immunotherapy

Affiliations

PPP2R1A mutations portend improved survival after cancer immunotherapy

Yibo Dai et al. Nature. 2025 Aug.

Erratum in

  • Author Correction: PPP2R1A mutations portend improved survival after cancer immunotherapy.
    Dai Y, Knisely A, Yano M, Dang M, Hinchcliff EM, Lee S, Welp A, Chelvanambi M, Lastrapes M, Liu H, Yuan Z, Wang C, Nie H, Jean S, Montaner LJ, Hou J, Patel A, Patel S, Fellman B, Yuan Y, Sun B, Pandurengan RK, Cuentas ERP, Celestino J, Liu Y, Liu J, Hillman RT, Westin SN, Sood AK, Soliman PT, Shafer A, Meyer LA, Gershenson DM, Vining D, Ganeshan D, Lu K, Wargo JA, Peng W, Zhang R, Wang L, Jazaeri AA. Dai Y, et al. Nature. 2025 Sep;645(8082):E10. doi: 10.1038/s41586-025-09586-8. Nature. 2025. PMID: 40913056 Free PMC article. No abstract available.

Abstract

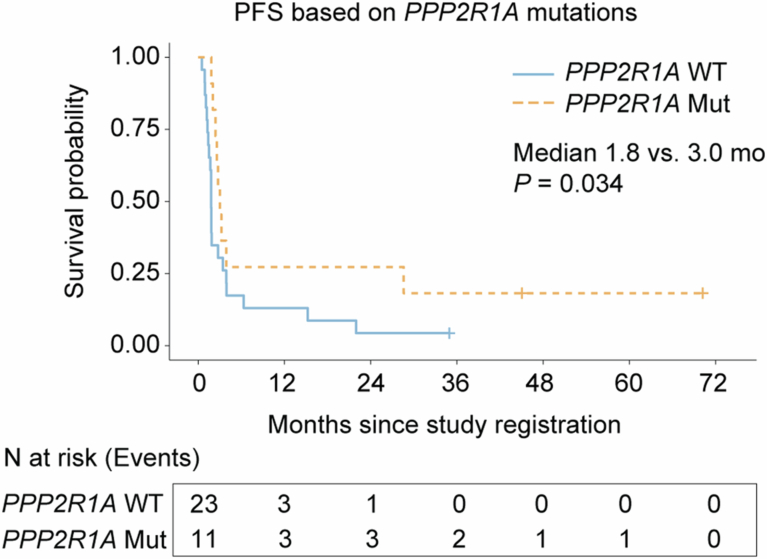
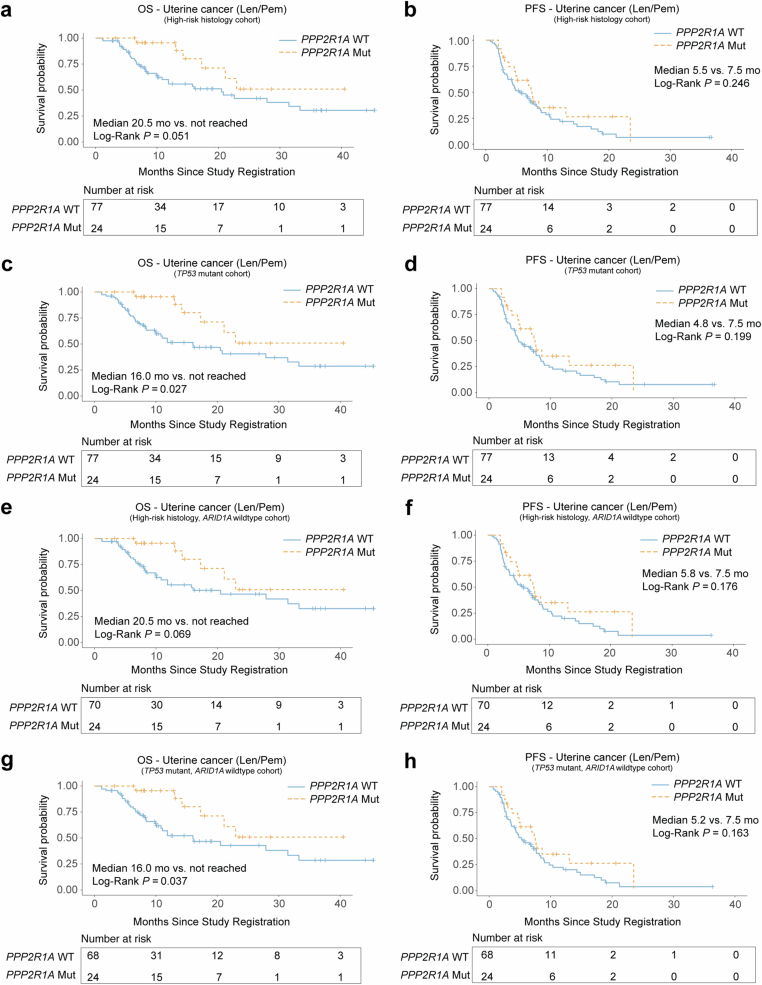
Immune checkpoint blockade (ICB) therapy is effective against many cancers, although resistance remains a major issue and new strategies are needed to improve clinical outcomes1-5. Here we studied ICB response in a cohort of patients with ovarian clear cell carcinoma-a cancer type that poses considerable clinical challenges and lacks effective therapies6-8. We observed significantly prolonged overall survival and progression-free survival in patients with tumours with PPP2R1A mutations. Importantly, our findings were validated in additional ICB-treated patient cohorts across multiple cancer types. Translational analyses from tumour biopsies demonstrated enhanced IFNγ signalling, and the presence of tertiary lymphoid structures at the baseline, as well as enhanced immune infiltration and expansion of CD45RO+CD8+ T cells in the tumour neighbourhood after ICB treatment in PPP2R1A-mutated tumours. Parallel preclinical investigations showed that targeting PPP2R1A (by pharmacological inhibition or genetic modifications) in in vitro and in vivo models was associated with improved survival in the setting of treatment with several forms of immunotherapy, including chimeric antigen receptor (CAR)-T cell therapy and ICB. The results from these studies suggest that therapeutic targeting of PPP2R1A may represent an effective strategy to improve patient outcomes after ICB or other forms of immunotherapy, although additional mechanistic and therapeutic insights are needed.


Conflict of interest statement

Competing interests: A.K.S. reports a consulting role at Merck, Onxeo, ImmunoGen, GSK, Astra Zeneca and Iylon. The other authors declare no competing interests.

Figures

Fig. 1
Fig. 1. PPP2R1A mutations are associated with longer survival after ICB in OCCC.
a, Schematic of the clinical trial design, sampling and subsequent analyses. Part of the figure was created using BioRender. b, The overall responses and outcomes of the enrolled patients. The starting points represent the time of the baseline clinical evaluation, and the end points represent the time of patient death or data cut-off. Response assessments shown are from only during the trial. CR, complete response (defined according to RECIST v.1.1, modified for immunotherapy); mut, mutated; PD, progressive disease; PR, partial response; SD, stable disease; WT, wild-type. c, Kaplan–Meier survival analysis of OS based on the PPP2R1A mutation status. d, Kaplan–Meier survival analysis of OS based on the ARID1A mutation status in the subgroup of patients with wild-type PPP2R1A. e, Kaplan–Meier survival analysis of OS based on the PPP2R1A mutation status in the subgroup of patients with ARID1A mutations. f, Representative patient computed tomography (CT) scan images (patient (Pt) 0) demonstrating the disease burden over time, with initial progression then response. CT scan images are shown at the baseline, and at 12, 24 and 36 weeks of therapy; the arrowheads mark representative tumour lesions. g, The changes in target lesion responses, as revealed by the sum of tumour diameters. The end points represent the time of last clinical evaluations while the patients were on trial. For patient 31 (asterisk), follow-up was continued until 70.4 months from the baseline. h, The best overall target lesion response when the patients were on trial, as revealed by the percentage changes from the baseline of tumour burdens. Data above 100 were truncated. For ce, P values were calculated using one-sided log-rank tests. Source Data
Fig. 2
Fig. 2. Enhanced immune responses in OCCC with PPP2R1A mutations at the baseline and after ICB treatment.
a,b, Gene set enrichment analysis (GSEA) of the pretreatment (a) and on-treatment (b) OCCC samples, showing upregulated immune signatures in the PPP2R1A-mutant group. FDR, false discovery rate; NES, normalized enrichment score. cf, Longitudinal changes in the relative abundance of CD8+ T cells (c), activated NK cells (d), resting NK cells (e) and total NK cells (f) in paired samples from the PPP2R1A-mutant and wild-type groups. g,h. Longitudinal changes in TCR (g) and BCR (h) richness in paired samples from the PPP2R1A-mutant and wild-type groups. For the box plots in ch, the centre line represents the median value; the lower and upper hinges correspond to the first and third quartiles, respectively; and the whiskers represent 1.5 × the interquartile range. For ch, P values were calculated using two-sided Wilcoxon signed-rank tests. Source Data
Fig. 3
Fig. 3. Spatially resolved immune cell landscape in OCCC with and without PPP2R1A mutations.
a, The antibody panel applied in CODEX assay. The diagram was created using BioRender. b,c, The cellular densities of proliferating B cells (CD20+Ki-67+; b) and germinal centre B cells (CD20+CD21+Ki-67+; c) in pretreatment samples. d, A representative CODEX image showing TLSs from the pretreatment sample of a patient with mutant PPP2R1A (patient 160). Scale bars, 100 μm (large image) and 200 μm (small images). e. Schematic of the multicellular neighbourhood analysis. The diagram was created using BioRender. f,g, The numbers of PD-1+CD8+ T cells (CD45+CD3e+CD8+CD4PD-1+CD39) and CD45RO+PD-1CD8+ T cells (CD45+CD3e+CD8+CD4CD45RO+GZMBPD-1CD39) in the neighbourhood of all (f) and MHC-I+ (g) tumour cells. In f, the numbers of cells in each group are as follows: 7,043 (mutant PPP2R1A, pretreatment), 12,758 (mutant PPP2R1A, on treatment), 17,346 (WT PPP2R1A, pretreatment) and 66,177 (WT PPP2R1A, on treatment). In g, the numbers of cells in each group are as follows: 523 (mutant PPP2R1A, pretreatment), 1,532 (mutant PPP2R1A, on treatment), 212 (WT PPP2R1A, pretreatment), 2,536 (WT PPP2R1A, on treatment). AvgFC, average fold change. h,i, Representative CODEX images showing PD-1+CD8+ T cells and CD45RO+PD-1CD8+ T cells in the neighbourhood of tumour cells in PPP2R1A-mutant (patient 157; h) and wild-type (patient 137; i) on-treatment samples. Scale bars, 50 μm (h,i). For the box plots (b,c,f and g), the centre line represents the median value; the lower and upper hinges correspond to the first and third quartiles, respectively; and the whiskers represent 1.5 × interquartile range. P values were calculated using two-sided Wilcoxon rank-sum tests. Source Data
Fig. 4
Fig. 4. PPP2R1A-mutant tumours exhibited improved sensitivity to T cell killing and ICB therapy.
a, The changes in PPP2R1A-specific gRNAs in the reported genome-wide CRISPR immune screens comparing the T-cell-treated group and the control group. b,c, Expression of activated caspase-3 in genetically modified (b) or LB100-treated (c) SKOV3 cell lines after exposure to B7H3 CAR-T cells. Representative results from three independent experiments are shown. shNC, non-targeting control shRNA; shPPP2R1A, PPP2R1A shRNA. d, Overexpression of the PPP2R1AP179R mutant increased SKOV3 sensitivity to CAR-T-cell-mediated killing. Representative results from four independent replications are shown. eg, Wild-type and CRISPR-edited HEC50B and OVCAR429 cell lines overexpressing hCD19 were co-cultured with hCD19 CAR-T cells at different effector:target (E:T) ratios, and colony formation (e) and the cancer cell survival (HEC50B (f) and OVCAR429 (g)) was measured at the end point. For each group, four independent replicates were performed. h, Schematic of the study design for PDX models. The diagram was created using BioRender. Hu-BLT, humanized-bone marrow, liver and thymus mice; Hu-EC, human endometrial cancer. i, Tumours from PPP2R1A-mutated PDXs at the end of treatment. j, The weights of tumours from PPP2R1A-mutated PDXs at the end of treatment. Each group included 14 independent repeats. k, Schematic of the study design for syngeneic mouse OCCC models. The diagram was created using BioRender. m-OCCC, mouse OCCC. l,m, The tumour size measured during treatment in the Arid1a−/−Pik3caH1047R (l) or Ppp2r1aR183QArid1a−/−Pik3caH1047R (m) syngeneic mouse models. n, The tumour weights measured at the end of treatment in the two syngeneic models. In ln, each group included five independent replicates. Data are mean ± s.e.m. P values were calculated using two-sided Student’s t-tests (j) and repeated-measures analysis of variance (ANOVA) with Tukey’s test for pairwise comparisons (bd and ln). Source Data
Extended Data Fig. 1
Extended Data Fig. 1. Information of the study cohort.
a. Flow chart showing overview of patients included in the study cohort and samples analysed by translational assays. b. Oncoplot showing genetic alterations reported in the study cohort. c. The gene structure of PPP2R1A and mutations reported in the study cohort.
Extended Data Fig. 2
Extended Data Fig. 2. Kaplan Meier survival analysis of PFS based on PPP2R1A mutation status.
P value was calculated using one-sided log-rank test.
Extended Data Fig. 3
Extended Data Fig. 3. Enhanced immune responses in tumours with PPP2R1A mutations in the baseline and upon ICB treatment.
a-b. GSEA of PPP2R1Amut AKTWT versus PPP2R1AWT AKTWT samples in pretreatment (a) and on-treatment (b) timepoints, showing the enrichment of immune-related signatures in the former group. c. GSEA based on longitudinal comparisons of on-treatment versus pretreatment samples in the PPP2R1A-mutant group, showing the upregulated immune signatures upon ICB treatment. d-g. Longitudinal changes of the relative abundance of CD8+ T cells (d), activated NK cells (e), resting NK cells (f), and total NK cells (g) in all samples from the PPP2R1A-mutant and WT groups. h-i. Longitudinal changes of TCR (h) and BCR (i) richness in all samples from the PPP2R1A-mutant and WT groups. In box plots, the centre line represents the median value; the lower and upper hinges correspond to the first and third quartiles, respectively; the whiskers represent 1.5 × interquartile ranges. For panels d-i, P values were calculated using two-sided Wilcoxon rank sum tests.
Extended Data Fig. 4
Extended Data Fig. 4. Longitudinal changes of the abundance of CD8+ T cells and NK cells in PPP2R1A mutant and wildtype samples.
a-d. Longitudinal changes of the absolute proportion of CD8+ T cells (a), activated NK cells (b), resting NK cells (c) and total NK cells (d) in all samples from PPP2R1A-mutant and WT cases. e-h. Longitudinal changes of the absolute proportion of CD8+ T cells (e), activated NK cells (f), resting NK cells (g) and total NK cells (h) in paired samples from PPP2R1A-mutant and WT cases. In box plots, the centre line represents the median value; the lower and upper hinges correspond to the first and third quartiles, respectively; the whiskers represent 1.5 × interquartile ranges. For panels a-d, P values were calculated using two-sided Wilcoxon rank sum tests. For panels e-h, P values were calculated using two-sided Wilcoxon signed rank tests.
Extended Data Fig. 5
Extended Data Fig. 5. Spatially resolved immune cell landscape of OCCC with and without PPP2R1A mutations.
a-c. The cellular densities of MHC-II+ (i.e., HLA-DR+) immune cells (a), CD20+ B cells (b), and CD20+ CD21+ B cells (c) in pretreatment samples grouped by PPP2R1A mutation status. d. Representative images from multiplex protein imaging, showing TLSs from the pretreatment samples of PPP2R1A-mutant patients (patient 162 and patient 124. f-g. The cellular densities of all immune cells (f), and CD45+ CD56+ NK cells (g) in on-treatment samples grouped by PPP2R1A mutation status. h. The amount of PD1+ CD8+ T cells and CD45RO+ PD1- CD8+ T cells in the neighbourhood of MHC I tumour cells. The numbers of cells in each group are: 6,520 (PPP2R1Amut, pre-treatment); 11,226 (PPP2R1Amut, on-treatment); 17,134 (PPP2R1AWT, pre-treatment); 63,641 (PPP2R1AWT, on-treatment). i. The amount of NK cells (CD45+ CD4 CD8 CD56+) in the neighbourhood of all, MHC I+, and MHC I tumour cells. See the legends of Fig. 3f,g and Extended Data Fig. 5h for cell counts of corresponding groups. j. A representative image from multiplex protein imaging, showing NK cells in the neighbourhood of tumour cells in a PPP2R1A-mutant on-treatment sample. In box plots, the centre line represents the median value; the lower and upper hinges correspond to the first and third quartiles, respectively; the whiskers represent 1.5 × interquartile ranges. For panels a-c and f-i, P values were calculated using two-sided Wilcoxon rank sum tests.
Extended Data Fig. 6
Extended Data Fig. 6. Different immune signatures in long-term versus short-term survivors from the PPP2R1A-mutant group.
a. Pathway analysis based on the transcriptomic-level comparison of samples from long-term versus short-term survivors in the pretreatment timepoint. b-c. Enriched pathways (b) and representative DEGs (c) based on the transcriptomic-level comparison of samples from long-term versus short-term survivors in the on-treatment timepoint.
Extended Data Fig. 7
Extended Data Fig. 7. PPP2R1A mutation leading to AKT activations.
a. Validation of PPP2R1A mutation status in the parental and CRISPR-edited HEC50B cell lines by Sanger-sequencing. b. Expression of AKT and pAKT-T308 in the parental and CRISPR-edited HEC50B cells by immunoblot. c. Validation of PPP2R1A mutation status in the parental and CRISPR-edited OVCAR429 cell lines by Sanger-sequencing. d. Expression of AKT and pAKT-T308 in the parental and CRISPR-edited OVCAR429 cells by immunoblot. e. Different immune signatures in pretreatment samples with and without AKT alterations. For b and d, three independent experiments were performed, and representative results were shown. For gel source data, see Supplementary Fig. 1.
Extended Data Fig. 8
Extended Data Fig. 8. Validation of the sensitivity of PPP2R1A-mutant tumours to immunotherapies in pre-clinical models.
a. Reduced PPP2R1A expression by gene-specific shRNAs. Three independent pairs of PPP2R1A-specific shRNAs (sh#1-3) were used to generate a set of SKOV3 cell lines with PPP2R1A-knockdown (KD). SKOV3 transduced with the non-targetable shRNA (shNC) was used as the negative control. Two independent experiments were performed, with the representative results shown. For gel source data, see Supplementary Fig. 1. b-c. Generation of SKOV3 cell lines with stable overexpression of PPP2R1A WT and P179R mutant. SKOV3 transduced with lentiviral vectors encoding PPP2R1A WT and P179R mutant were selected by sorting GFP positive cells. SKOV3 transduced with empty vector was used as the negative control. d. Flow sorting of parental and CRISPR-edited HEC50B and OVCAR429 cell lines. Enriched CD19+ cancer cells were subsequently used for cytotoxicity assays. e. Validation of PPP2R1A mutational status in PDX by Sanger-sequencing. f-g. Humanized-BLT mice bearing PPP2R1A-WT endometrial cancer PDXs were randomized into the indicated treatment groups. Images of tumours from the indicated groups are shown at the end of treatment (f). Tumour weights were measured as surrogate for tumour burden (g). Error bars represent mean ± s.e.m. For panel g, P values were calculated using two-sided Student’s t-test. h. Validation of Ppp2r1a mutation status in mouse OCCC cell lines applied in syngeneic models. i. Mouse body weights measured during treatment in the Arid1a−/− Pik3caH1047R and Ppp2r1aR183Q Arid1a−/− Pik3caH1047R syngeneic mouse OCCC models. Source Data
Extended Data Fig. 9
Extended Data Fig. 9. Validation of the survival impact of PPP2R1A mutations in clinical cohorts of other cancer types.
a-b. Kaplan-Meier survival analysis of the impact of PPP2R1A mutation status on the OS of patients receiving immunotherapy (a) or other therapies (b) from large pan-cancer cohorts (Samstein et al., 2019; Zehir et al., 2017). c. Kaplan-Meier survival analysis of the impact of PPP2R1A mutation status on the PFS of NSCLC patients treated with ICB therapies (Hellmann et al., 2019). d. Kaplan-Meier survival analysis of the impact of PPP2R1A mutation status on the OS of melanoma patients treated with ICB therapies. For panels a-d, P values were calculated using two-sided log-rank tests.
Extended Data Fig. 10
Extended Data Fig. 10. Validation of the survival impact of PPP2R1A mutations in a uterine cancer cohort receiving combined len-pem treatment.
a-b. Kaplan-Meier survival analysis of the impact of PPP2R1A mutation status on the OS (a) and PFS (b) of uterine cancer patients with high-risk histology who received combined len-pem therapies. c-d. Kaplan-Meier survival analysis of the impact of PPP2R1A mutation status on the OS (c) and PFS (d) of uterine cancer patients with TP53 mutations who received combined len-pem therapies. e-h. Same as a-d, but for uterine cancer patients in the same cohort with WT ARID1A. For panels a-h, P values were calculated using two-sided log-rank test. Source Data

References

    1. Disis, M. L. et al. Efficacy and safety of avelumab for patients with recurrent or refractory ovarian cancer: phase 1b results from the JAVELIN solid tumor trial. JAMA Oncol.5, 393 (2019). - PMC - PubMed
    1. Hamanishi, J. et al. Nivolumab versus gemcitabine or pegylated liposomal doxorubicin for patients with platinum-resistant ovarian cancer: open-label, randomized trial in japan (NINJA). J. Clin. Oncol.39, 3671–3681 (2021). - PMC - PubMed
    1. Matulonis, U. A. et al. Antitumor activity and safety of pembrolizumab in patients with advanced recurrent ovarian cancer: results from the phase II KEYNOTE-100 study. Ann. Oncol.30, 1080–1087 (2019). - PubMed
    1. Zamarin, D. et al. Randomized phase II trial of nivolumab versus nivolumab and ipilimumab for recurrent or persistent ovarian cancer: an NRG oncology study. J. Clin. Oncol.38, 1814–1823 (2020). - PMC - PubMed
    1. Liu Y. L. et al. BRCA mutations, homologous DNA repair deficiency, tumor mutational burden, and response to immune checkpoint inhibition in recurrent ovarian cancer. JCO Precis. Oncol.4, 665–679 (2020). - PMC - PubMed

MeSH terms