. 2025 Aug;644(8077):706-713.
doi: 10.1038/s41586-025-09216-3. Epub 2025 Jul 2.

Mapping the adaptive landscape of Batesian mimicry using 3D-printed stimuli

Affiliations

Mapping the adaptive landscape of Batesian mimicry using 3D-printed stimuli

Christopher H Taylor et al. Nature. 2025 Aug.

Abstract

In a classic example of adaptation, harmless Batesian mimics gain protection from predators through resemblance to one or more unpalatable models1,2. Mimics vary greatly in accuracy, and explaining the persistence of inaccurate mimics is an ongoing challenge for evolutionary biologists3,4. Empirical testing of existing hypotheses is constrained by the difficulty of assessing the fitness of phenotypes absent among extant species, leaving large parts of the adaptive landscape unexplored5-a problem affecting the study of the evolution of most complex traits. Here, to address this, we created mimetic phenotypes that occupy hypothetical areas of trait space by morphing between 3D images of real insects (flies and wasps), and tested the responses of real predators to high-resolution, full-colour 3D-printed reproductions of these phenotypes. We found that birds have an excellent ability to learn to discriminate among insects on the basis of subtle differences in appearance, but this ability is weaker for pattern and shape than for colour and size traits. We found that mimics gained no special protection from intermediate resemblance to multiple model phenotypes. However, discrimination ability was lower in some invertebrate predators (especially crab spiders and mantises), highlighting that the predator community is key to explaining the apparent inaccuracy of many mimics.


Conflict of interest statement

Competing interests: The authors declare no competing interests.

Figures

Fig. 1
Fig. 1. Overview of the methods used to generate artificial mimetic stimuli.
Illustrations are based on an axis of similarity from the fly M. meridiana (M100) to the wasp V. vulgaris (V100) through a 50% intermediate (M50/V50). a, Flowchart of the methodology. Real insect specimens were scanned by photogrammetry to produce coloured 3D meshes. These were split into multiple components, which were each varied smoothly to generate intermediate values. These intermediates were then recombined into a single 3D object, and finally printed using additive manufacturing. bg, How each component of the phenotype (shape (b), pattern (c), size (d) and colour (e) of the body, plus simplified representations of legs, wings and antennae (f)) is interpolated, and the resulting axis of mimetic accuracy (g).
Fig. 2
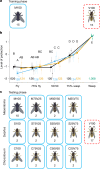
Fig. 2. Discrimination ability of great tits.
a, The design of the training phase. The solid blue border represents the rewarded stimulus, and the dashed red border represents no reward. The code above is a unique label for each stimulus type, with the letters indicating the species used as an end point and the numbers indicating the weighting. The numbers below indicate how many of that stimulus type appeared on a single feeding station, within an array of 30 dishes. b, The levels of protection received by different stimulus types resulting from great tit behaviour during the testing phase. Level of protection is the rank order of attack for that stimulus within a session, logit transformed. A higher level of protection indicates that a stimulus was attacked later in the sequence, or not at all. The bold points show the mean for all feeders; faint points show the means for individual feeders along with 95% confidence intervals based on the t-distribution. The black line shows the Mesembrina axis, the blue line shows the Syrphus axis and the orange line shows the Chrysotoxum axis. Capital letters indicate groupings that show no significant difference after a Tukey post hoc test (P > 0.05). Numbers give the sample size (number of dishes). c, Design of the testing phase. Models from three axes were presented together at each feeding station, starting from three different fly species and all ending at V. vulgaris. The total array size was 49 dishes. Note that M100 has a larger sample size than S100 and C100 so that the birds faced some rewarding stimuli familiar from the training phase. Source data
Fig. 3
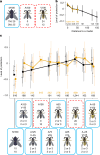
Fig. 3. Testing the multiple-models hypothesis.
a, The design of the training phase. The solid blue border represents rewarded stimulus, and the dashed red border represents no reward. The code above is a unique label for each stimulus type, with the letters indicating the species used as an end point and the numbers indicating the weighting (which is negative in some cases). The numbers below indicate how many of that stimulus type appeared on a single feeding station, for both one-model (1M, top) and two-model (2M, bottom) treatments. b, The levels of protection received by different stimulus types resulting from great tit behaviour during the testing phase. Stimuli are grouped according to phenotypic distance to the nearest model. Level of protection is the rank order of attack for that stimulus within a session, logit transformed. A higher level of protection indicates that a stimulus was attacked later in the sequence, or not at all. The 1M treatment is shown in black and 2M in orange. The points show the mean for all feeders along with the 95% confidence intervals based on the t-distribution. The numbers give the sample size (number of dishes). c, The same data as in b, but showing all stimuli separately. The bold points show the mean for all feeders and the faint points show the means for individual feeders along with the 95% confidence intervals based on the t-distribution. Source data
Fig. 4
Fig. 4. Chick behavioural response to multiple traits.
a, Design of the training phase. Each trial consisted of 16 binary choices between T. fera stimuli with shape (S), pattern (P), colour (C) and size (Z) all poor, and V. vulgaris stimuli with shape, pattern, colour and size all perfect, as indicated by the codes above each stimulus image. The solid blue border represents the rewarded stimulus, and the dashed red border represents no reward. b, The design of the testing phase. Each trial consisted of 16 single presentations, including four probe stimuli, with the order randomized. Here we show one possible example of a selection of four probe stimuli, drawn from the options detailed in Extended Data Table 4. c, The latency to attack the stimuli, grouped by colour and size. Each column includes multiple combinations of shape and pattern traits. A plot with each trait combination shown separately is provided in Extended Data Fig. 4. The time to attack in seconds was standardized across trials by linear scaling such that values for fly and wasp presentations match the median values across all trials, shown as horizontal reference lines (wasp, top; fly, bottom). The bold points show the mean values and the vertical lines show the 95% confidence intervals based on the t-distribution. The faint points show the results of individual trials. The capital letters indicate groupings that show no significant difference after a Tukey post hoc test (P > 0.05). The sample sizes (number of presentations) are given at the bottom of the plot. Source data
Fig. 5
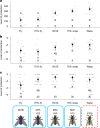
Fig. 5. Levels of protection received by different stimulus types resulting from invertebrate predators’ behaviour.
a, The mantis (Mantidae spp.) level of protection is the latency to attack in seconds. b,c, The jumping spider (b; P. audax) and crab spider (c; S. globosum) level of protection is a count of aggressive behaviours towards the stimulus, subtracted from 0 to match the direction of response axes in other figures, with higher values indicating greater protection. The bold points show the mean values and the vertical lines show the 95% confidence intervals based on the t-distribution for the log-transformed positive data. Faint points show results of individual trials. The capital letters indicate groupings that show no significant difference after a Tukey post hoc test (P > 0.05). The numbers at the bottom of each panel give the sample size (number of presentations). The solid blue border represents the neutral stimulus, and the dashed red border represents the negative stimulus. The code above is a unique label for each stimulus type, with the letters indicating the species used as an end point and the numbers indicating the weighting. Source data
Extended Data Fig. 1
Extended Data Fig. 1. Changes in preference over time in the Discrimination Ability experiment.
“Level of protection” is the rank order of attack for that stimulus within a session, logit transformed. Higher level of protection indicates that a stimulus was attacked later in the sequence, or not at all. Points show mean and vertical bars show 95% confidence intervals based on the t-distribution. a Training phase. Data show wasp stimuli only; fly data are an almost exact inversion of the data shown. Line shows a sigmoidal curve fitted to the data. N = 828. b Test phase, trends with time. Asymptotic curves fitted to each phenotype. N = 1295 dishes (fly), 558 (75% fly), 553 (50-50), 552 (75% wasp), 1565 (wasp). c Test phase, comparing initial (yellow, sessions 1-3) and asymptotic (black, session 10 onwards, after fitted response reaches within 10% of the asymptote) preferences. Mesembrina axis, N = 191 dishes (initial), 1004 (asymptotic). Chrysotoxum axis, N = 96 (initial), 502 (asymptotic). Syrphus axis, N = 95 (initial), 497 (asymptotic). For images of the stimuli, see Fig. 2 in main text.
Extended Data Fig. 2
Extended Data Fig. 2. Validation experiment testing phase.
Points show mean and vertical bars show 95% confidence intervals based on the t-distribution. Capital letters indicate groupings which show no significant difference in a Tukey post-hoc test (p > 0.05). Sample sizes (number of dishes) are shown at the base of the plot.
Extended Data Fig. 3
Extended Data Fig. 3. Changes in preference over time in the Multiple Models experiment.
Points show mean and vertical bars show 95% confidence intervals based on the t-distribution. a Training phase. Lines show an asymptotic curve fitted to the data from session 16 onwards; the curve for A100 did not converge but is shown for illustration. Session 16 was the first session after a period of one week when no birds opened dishes. Curves fitted to the full time period all failed to converge. A100 session 9 had a small sample size (3) and as a result has very wide confidence intervals (−5.3, 8.3) that are not shown in full for clarity of the rest of the plot. N = 3470 dishes (M100), 769 (A100) and 2227 (V100). b Test phase, trends with time. Asymptotic curves fitted to these data, using the same method as the training phase, failed to converge. Instead, trend lines are a moving average across five sessions (centred on the third session). Sample sizes shown above each plot. c Test phase, comparing initial (yellow, session 1-3) and asymptotic (black, session 10 onwards, chosen to match Discrimination Experiment) preferences. N = 437 dishes (initial, 1 M), 384 (initial, 2 M), 2902 (asymptotic, 1 M), 4334 (asymptotic, 2 M).
Extended Data Fig. 4
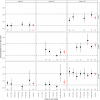
Extended Data Fig. 4. Chick latency to attack mimetic stimuli.
Levels of accuracy of mimetic traits are coded as 0 (fly-like/poor), 50 (intermediate/good) and 100 (wasp-like/perfect) for each of shape, pattern, colour and size. Each panel shows a certain combination of colour and size traits, and within a panel, black points show certain combinations of pattern (P) and shape (S), and red points show data pooled across all values for pattern and shape (as shown in Fig. 4, main text). Time to attack (seconds) has been standardized across trials by linear scaling such that values for fly and wasp presentations match the median values across all trials, shown as horizontal reference lines (wasp upper, fly lower). Points show mean and vertical bars show 95% confidence intervals based on the t-distribution. Sample sizes (number of presentations) are shown at the base of each plot.

Similar articles

  • Prescription of Controlled Substances: Benefits and Risks.
    Preuss CV, Kalava A, King KC. Preuss CV, et al. 2025 Jul 6. In: StatPearls [Internet]. Treasure Island (FL): StatPearls Publishing; 2025 Jan–. 2025 Jul 6. In: StatPearls [Internet]. Treasure Island (FL): StatPearls Publishing; 2025 Jan–. PMID: 30726003 Free Books & Documents.
  • Sexual Harassment and Prevention Training.
    Cedeno R, Bohlen J. Cedeno R, et al. 2024 Mar 29. In: StatPearls [Internet]. Treasure Island (FL): StatPearls Publishing; 2025 Jan–. 2024 Mar 29. In: StatPearls [Internet]. Treasure Island (FL): StatPearls Publishing; 2025 Jan–. PMID: 36508513 Free Books & Documents.
  • Is temporal synchrony necessary for effective Batesian mimicry?
    Robinson AE, Novick I, Herrmann J, DeFelice L, Engel A, Famin D, Fetherston C, Frintu B, Meyersiek J, Mishi M, Nguyễn TGH, Buston PM, Sherratt TN, Mullen SP. Robinson AE, et al. Proc Biol Sci. 2025 Jan;292(2039):20241737. doi: 10.1098/rspb.2024.1737. Epub 2025 Jan 22. Proc Biol Sci. 2025. PMID: 39837508
  • Tobacco packaging design for reducing tobacco use.
    McNeill A, Gravely S, Hitchman SC, Bauld L, Hammond D, Hartmann-Boyce J. McNeill A, et al. Cochrane Database Syst Rev. 2017 Apr 27;4(4):CD011244. doi: 10.1002/14651858.CD011244.pub2. Cochrane Database Syst Rev. 2017. PMID: 28447363 Free PMC article.
  • Sertindole for schizophrenia.
    Lewis R, Bagnall AM, Leitner M. Lewis R, et al. Cochrane Database Syst Rev. 2005 Jul 20;2005(3):CD001715. doi: 10.1002/14651858.CD001715.pub2. Cochrane Database Syst Rev. 2005. PMID: 16034864 Free PMC article.

References

    1. Bates, H. W. Contributions to an insect fauna of the Amazon Valley. Lepidoptera: Heliconidæ. Trans. Linn. Soc. Lond.23, 495–566 (1862).
    1. Ruxton, G. D., Sherratt, T. N. & Speed, M. P. Avoiding Attack: The Evolutionary Ecology of Crypsis, Warning Signals, and Mimicry (Oxford Univ. Press, 2004).
    1. Leavey, A., Taylor, C. H., Symonds, M. R. E., Gilbert, F. & Reader, T. Mapping the evolution of accurate Batesian mimicry of social wasps in hoverflies. Evolution75, 2802–2815 (2021). - PubMed
    1. Penney, H. D., Hassall, C., Skevington, J. H., Abbott, K. R. & Sherratt, T. N. A comparative analysis of the evolution of imperfect mimicry. Nature483, 461–464 (2012). - PubMed
    1. McLean, D. J., Cassis, G., Kikuchi, D. W., Giribet, G. & Herberstein, M. E. Insincere flattery? Understanding the evolution of imperfect deceptive mimicry. Q. Rev. Biol.94, 395–415 (2019).

LinkOut - more resources