. 2025 Aug;644(8076):557-566.
doi: 10.1038/s41586-025-09207-4. Epub 2025 Jul 2.

Mapping and engineering RNA-driven architecture of the multiphase nucleolus

Affiliations

Mapping and engineering RNA-driven architecture of the multiphase nucleolus

Sofia A Quinodoz et al. Nature. 2025 Aug.

Abstract

Biomolecular condensates are key features of intracellular compartmentalization1,2. As the most prominent nuclear condensate in eukaryotes, the nucleolus is a multiphase liquid-like structure in which ribosomal RNAs (rRNAs) are transcribed and processed, undergoing multiple maturation steps to form the small (SSU) and large (LSU) ribosomal subunits3-5. However, how rRNA processing is coupled to the layered organization of the nucleolus is poorly understood owing to a lack of tools to precisely monitor and perturb nucleolar rRNA processing dynamics. Here we developed two complementary approaches to spatiotemporally map rRNA processing and engineer de novo nucleoli. Using sequencing in parallel with imaging, we found that rRNA processing steps are spatially segregated, with sequential maturation of rRNA required for its outward movement through nucleolar phases. By generating synthetic nucleoli in cells using an engineered rDNA plasmid system, we show that defects in SSU processing can alter the ordering of nucleolar phases, resulting in inside-out nucleoli and preventing rRNA outflux, while LSU precursors are necessary to build the outermost layer of the nucleolus. These findings demonstrate how rRNA is both a scaffold and substrate for the nucleolus, with rRNA acting as a programmable blueprint for the multiphase architecture that facilitates assembly of an essential molecular machine.


Conflict of interest statement

Competing interests: C.P.B. is a scientific founder, scientific advisory board member, shareholder and consultant for Nereid Therapeutics. The other authors declare no competing interests.

Figures

Fig. 1
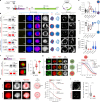
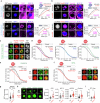
Fig. 1. Sequencing and imaging of nascent rRNA flux provides a spatiotemporal map of processing in the nucleolus.
FCs, DFCs and GCs in MCF10A cells were visualized through RNA Pol I subunit RPA194 (immunofluorescence (IF)), FBL (IF) and endogenously tagged mTagBFP2–NPM1, respectively. a, The three nucleolar phases: FC (green), DFC (red) and GC (blue). b, Cells were pulsed with 5eU (15 min) to label nascent RNA and chased to measure the rRNA flux (imaging) or cleavage and modification (sequencing). c, The radial outflux of 5eU-labelled pre-rRNA over time in nucleoli (dashed lines); the averaged signal around the FCs is shown. d, Min–max-normalized FC, DFC and GC intensities by distance from the FC centre from 4,274 nucleoli. The colour bar indicates FC, DFC and GC localization. e, Min–max-normalized 5eU intensities by distance from the FC centre across chase timepoints. n = 717, 459, 499, 603, 470, 451, 550 and 525 nucleoli. f, Pre-rRNA cleavage steps categorized as early (green), middle (red), late (blue) and mature (purple) based on i. g, Schematic of pre-rRNA cleavage, modification (m), and outflux during assembly into SSU (in the FC and DFC) and LSU (in the FC, DFC and GC) based on i. h, 18S and 28S pre-rRNA 2′-O-methylation (2′-O-Me) (ScoreC) detected using 5eU–seq over time. The colour bar relates the chase time to 5eU peak localization (Extended Data Fig. 2a). The dashed lines demarcate the phase boundaries. n = 2 per timepoint. i, The fraction of pre-rRNA cleaved at early, middle and late sites over time. n = 2 per timepoint. j, Schematic of the RNA-FISH probes (top). Bottom, the averaged intensity around FCs (example images are shown in Extended Data Fig. 2e). k, The min–max-normalized RNA-FISH intensity by distance from the FC centre. n = 72 (5′ ETS), 95 (3′ ETS), 24 (site 01), 111 (site 1), 230 (site 2), 38 (site 3′), 105 (site 4′), 318 (ITS2-28S), 72 (18S) and 310 (28S) nucleoli. For a, c and j, scale bars, 1 μm. Data are mean ± s.e.m. (d, e, h, i and k). Source data
Fig. 2
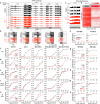
Fig. 2. Impaired rRNA processing impacts rRNA flux and alters the nucleolar morphology.
a, Pre-rRNA processing was perturbed in MCF10A cells and analysed using 5eU–seq (processing) or 5eU imaging (flux and morphology). b, The normalized cleavage efficiency (treatment versus control; Methods) for 5′ ETS (1) or 3′ ETS (02) sites measured by 5eU–seq after treatment with 2 μM FVP (general processing inhibitor, purple), KD of SSU-processing factors (U3 snoRNA or FBL, red) or LSU-processing factors (RPL5 or U8 snoRNA, blue). P values were calculated using two-tailed t-tests; ***P = 0.0004, ****P < 0.0001. n = 12 (FVP), 8 (U3), 15 (FBL), 8 (RPL5) and 6 (U8) measurements. ND, not determined; NS, not significant; estimation of cleavage efficiency and statistical testing was not possible for FVP due to complete cleavage inhibition (Extended Data Fig. 3f). c, Representative images of 5eU-labelled RNA (white) in nucleoli (mTagBFP2–NPM1) after a 60 min chase in control and treated cells (top). Bottom, 5eU–GC (NPM1) correlation from 0–120 min. n ≥ 50 cells per timepoint per condition. Example images are provided in Extended Data Figs. 4e and 6. d, The average 18S and 28S rRNA 2′-O-methylation levels (ScoreC) over 0–90 min from 5eU–seq for controls (solid lines) and treatments (dashed). n = 101–208 measurements per timepoint. e, Representative images and schematics of GC (NPM1, blue), DFC (FBL, red) and FC (RPA194, green) (IF) for all conditions except FBL KD, where mTagBFP2–NPM1, NOP56–mCherry and RPA16–GFP are visualized. RPA194 puncta outside the nucleoli are immunostaining background, and were not observed in the fluorescence-tagged lines (Extended Data Fig. 5d,e). f, FC and DFC nucleolar rim enrichment in controls and perturbations (normalized to control). The violin plots show the median (solid line) and quartiles (dashed lines). Statistical analysis was performed using two-tailed Mann–Whitney U-tests; ****P < 0.0001. n = 1,116 (controls), 97 (FBL), 228 (RPL5), 153 (U3) and 105 (U8) cells. All scale bars, 3 μm. For c and d, data are mean ± s.e.m. Source data
Fig. 3
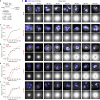
Fig. 3. Engineered synthetic nucleoli in cells recapitulate normal multiphase architecture with the expression of the LSU precursors required for GC recruitment.
a, Schematics of endogenous rDNA and a plasmid expressing an rDNA sequence containing three deletions (Δ1, Δ2 and Δ3) in the 5′ ETS region and unique insertions in 18S and 28S (18S* and 28S*). b, RNA-FISH detection of endogenous pre-rRNA (endo 5′ ETS probes; yellow) and plasmid-derived pre-rRNA (18S* probe, white) in HEK293T cells. The dashed lines show individual nucleoli; the solid lines indicate individual nuclei. c, Representative images of nucleoli classified as de novo (plasmid derived), endogenous and hybrid (fusion), labelled for DFC (FBL IF) and GC (NPM1 IF). The FISH probe control is shown in Extended Data Fig. 8c. d, RNA-FISH intensities of 18S* and endogenous 5′ ETS probes across nucleolar classes. a.u., arbitrary units. e, Heterochromatin (H3K9me2/3) and chromatin (DAPI) staining around endogenous and de novo nucleoli (GC: RRP1 IF, NPM1 IF). f, Schematics of SSU-only and LSU-only plasmids with truncated rDNA sequences (Extended Data Fig. 7a,b). Left, representative images of de novo nucleoli formed from rDNA, SSU-only and LSU-only plasmids, visualized by RNA-FISH (28S* for rDNA and LSU only, 18S* for SSU only) and nucleolar markers DFC (NOP56–mCherry), GC (mTagBFP2–NPM1). Right, the corresponding cytoplasmic FISH signals. g, Quantification of the mean nucleolar DFC (NOP56–mCherry) and GC (mTagBFP2–NPM1) intensity from f. *P = 0.0248, **P = 0.0012, ****P < 0.0001. n = 24 (wild type, WT), 14 (SSU only) and 17 (LSU only) nucleoli. h, Quantification of cytoplasmic RNA-FISH intensities for rDNA, SSU-only and LSU-only plasmids from f. **P = 0.0016, ****P < 0.0001. n = 32 (WT; 18S* rRNA), 47 (WT; 28S* rRNA), 90 (SSU-only) and 7 (LSU-only) cells. Scale bars, 3 μm (b and f (right; whole cells)) and 1 μm (others). The box plots show the median (centre lines), 25th–75th percentiles (box limits) and minimum–maximum values (whiskers). HEK293T cells were used for all of the experiments. Statistical analysis was performed using two-tailed Mann–Whitney U-tests. Source data
Fig. 4
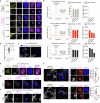
Fig. 4. U3-mediated SSU processing drives the layering of the multiphase nucleolus and rRNA outflux.
a, Plasmids co-expressing U3 snoRNA and rDNA with various mutations (red) (Extended Data Fig. 7c–g). b, Synthetic nucleoli from normal, 3′ and 3’5′ hinge mutants or base-pairing-rescued plasmids, visualized by GC (mTagBFP2–NPM1), DFC (NOP56–mCherry), identified by a lack of endogenous rRNA and the presence of 18S* rRNA. Right, cytoplasmic 18S* and 28S* rRNA signals. Scale bars, 1 µm (left), 3 μm (right). The solid lines indicate nuclei; the arrows indicate a lack of cytoplasmic 18S* signal. See Extended Data Fig. 9a,b for morphologies reproduced with IF and all phases visualized. c, Quantification of DFC rim enrichment. ****P < 0.0001, **P = 0.0024. n = 95, 12, 19, 9, 18 and 13 nucleoli. d, The Pearson correlation between 18S* rRNA and NPM1. *P = 0.0221, **P = 0.0012. n = 7, 9, 6, 15 and 8 nucleoli. e, Quantification of the cytoplasmic 18S* signal from b. ****P < 0.0001. n = 32, 38, 58, 79 and 102 cells. f, Morphology (left) and FC rim enrichment score (right) of de novo nucleoli (FC, RPA194 IF; DFC, NOP56–mCherry) from WT (n = 15) or 3′5′ hinge mutant (n = 29) SSU-only plasmids (Extended Data Fig. 7b). ****P < 0.0001. g, Localization of proteins of interest (POI, green: FBL (IF), EXOSC10 (IF) and RPS6–Halotag) relative to DFCs (NOP56–mCherry) of WT SSU-only nucleoli (left). Right, the radial distribution of 18S* RNA and POIs around the DFC boundary (dashed line, 0 μm). n = 74 (Nop56, 18S), 87 (FBL), 21 (RPS6) and 12 (EXOSC10) nucleoli. h, The 18S* RNA distribution around DFCs (NOP56) in WT (n = 74) versus mutant (n = 164) SSU-only nucleoli. i, The cytoplasmic 18S* rRNA levels from WT (n = 90) and mutant SSU (n = 34) plasmids. Scale bar, 3 μm. ****P < 0.0001. Statistical analysis was performed using two-tailed Mann–Whitney U-tests. For g and h, data are mean ± s.e.m. Scale bars, 1 μm (fh). The box plots in cf and i show the median (centre lines), 25th–75th percentiles (box limits) and minimum–maximum values (whiskers). HEK293T cells were used for all experiments. Source data
Fig. 5
Fig. 5. An RNA-dependent multiphase model of nucleolar architecture.
a, The proposed model of how rRNA transcription and processing shape the multiphase nucleolus. A 13.3 kb pre-rRNA is transcribed from rDNA, processed and cleaved to assemble the SSU and LSU. Here we show that the LSU precursors are necessary for assembling the nucleolar GC phase (blue) and SSU processing drives the ordering of the DFC (red) and GC (blue) phases. Different arrangements of multiphase structures (such as normal or inversion) can arise from changes in interfacial tensions across multiple interfaces: nucleoplasm (NP)–DFC (γNP,DFC), NP–GC (γNP,GC) and GC–DFC (γGC,DFC). Under normal U3-mediated cleavage of the 5′ ETS from SSU pre-rRNA, the DFC localizes inside the GC. After impaired U3-mediated SSU processing, SSU pre-rRNAs build up in the DFC phase and no longer flux into the GC phase. This results in a change in the interfacial tensions and the nucleolar morphology inverts, whereby the GC is now enveloped by the DFC. b, Different nucleolar morphologies are recapitulated in a phase-field model that considers the partitioning of different rRNA precursors (for example, SSU before and after 5′ ETS cleavage) into the different nucleolar phases (DFC and GC). For simplicity, the FC and DFC are modelled as one nucleolar phase. Changes in U3-mediated processing, RNA Pol I transcription or LSU production (SSU-only) alter the concentrations of rRNA precursors in each phase, resulting in different nucleolar morphologies. c, Modelling of impaired SSU processing (5′ ETS cleavage) over time leads to an accumulation of SSU precursors (before 5′ ETS cleavage) and inversion of the nucleolar phases. d, Modelling of RNA Pol I transcriptional inhibition over time; a decreased concentration (normalized to the concentration at t = 0) of all SSU and LSU rRNA precursors results in the nucleolar cap morphology.
Extended Data Fig. 1
Extended Data Fig. 1. 5eU-seq method description and validation.
a, Schematics of the 5eU-sequencing protocol with 3 rounds of sequential captures. b, The “fraction cleaved” metric is calculated by measuring the number of “cleaved” reads (ending at a cut site) divided by the total number of reads (uncleaved (spanning a cut site) + cleaved). Bottom, examples of 5eU-seq data demonstrating single nucleotide resolution mapping of rRNA cleavage at specific sites (1 and 02) over time in MCF10A cells. c, Optimization of wash temperature and buffer conditions to reduce background from mature rRNA. d, The fraction of reads cleaved at 02 and 1 sites comparing Protocols 1, 2, and 3 on 5eU pulse-labelled material (15 min pulse, 0 min chase) from HEK293T cells. Protocol 3 is the optimized protocol used for all datasets in this paper. Total RNA is a reference for mature rRNA. n = 1 (Protocol 2 and 3), 2 (Protocol 1, total RNA) replicates. e, Northern blot analysis of 5eU pulse-labelled material (30 min) and unlabelled material as a control (no pulse) from HEK293T cells. Two replicates were performed. f, Northern blot probes used in e. g, RiboMethScore of 2′-O-Methylation for 5eU 30 min pulse labelled material (+5eU, 60 or 90 min chase) and unlabelled material as a control (−5eU). Modification levels are not significantly (n.s.) different across n = 108 2-O-Me sites between conditions (two-tailed t-test). h, Schematic (adapted from) explaining the detection of 2′-O-methylation levels by mapping 5′ ends of reads. Drops in read end counts are observed at modified sites; see methods. i, Example 5′ end read coverage at fast (Gm4494, 28S) and slow (Um4498, Gm4499, 28S) 2′-O-methylation sites over 0-240 min chase timepoints. j, Quantification of 2′-O-methylation levels (ScoreC) over 0-240 min chase timepoints at 28S Gm4494, Um4498, Gm4499 2′-O-methylation sites shown in i. n = 2 per timepoint. Error bars are s.e.m. Source data
Extended Data Fig. 2
Extended Data Fig. 2. RNA FISH and 5eU-imaging of rRNA flux as well as characterization of endogenously tagged mTagBFP2-NPM1 cells.
a, Peak of 5eU signal (distance from the centre of FCs) over chase time quantified in Fig. 1e. b, Max normalized 5eU intensity over distance from the centre of FCs over time, quantified in Fig. 1e. c, Max normalized FISH intensity over distance from FC centre, quantified from images in e. d, Pearson correlation coefficient between all FISH probes and GC from images in e. Number of nucleoli (n) = 72 (5′ ETS), 95 (3′ ETS), 24 (Site 01), 111 (Site 1), 230 (Site 2), 38 (Site 3′), 105 (Site 4′), 318 (ITS2-28S), 72 (18S), 310 (28S). Violin plots are centred by median and quartiles are shown. e, Example images of RNA FISH probes in Fig. 1j, with FC (RPA194 IF), DFC (FBL IF), and GC (mTagBFP2-NPM1) shown. Scale bar = 3 μm. Bottom: averaged FISH images around individual FCs. Scale bar = 1 µm. f, Junction PCR of a 400 bp genomic region spanning the inserted mTagBFP2 in MCF10A -/- (parental) and +/- (one copy of NPM1 tagged) cells. For gel source data, see Supplementary Fig. 1b. g, Western blot for NPM1 in MCF10A -/- and +/- cells with β-actin as loading control. For gel source data, see Supplementary Fig. 1a. Source data
Extended Data Fig. 3
Extended Data Fig. 3. Example 5eU-seq data and altered pre-rRNA cleavage and modification measured by 5eU-seq upon all perturbations.
a, 5eU-seq reads over 47S pre-rRNA for 15 min pulse labelled material over 0-90 min chase timepoints in DMSO-treated (black) and FVP-treated (red) MCF10A cells. FVP-treated cells were pretreated with 2 µM FVP for 1 hr. prior to 5eU pulse-chase and throughout the time course. Arrows indicate where the sequencing reads are changing over time upon cleavage. b, Zoom-in examples of 5eU-seq reads at 01, 1, 2/NA, 3′/ITS2-28S and 02/3′ ETS regions in a. Dashed lines demarcate the cleavage sites and arrows indicate where the sequencing reads are changing over time upon cleavage. c, Zoom-in on 5′ end read counts in DMSO-control or FVP-treated conditions over 0-90 min chase timepoints in 28S rRNA at Gm1522 and Am1524 2′-O-methylation sites. FVP causes impaired 2′-O-methylation, observed by loss of characteristic drops at 2′-O-Me sites. d, Heatmap of 2′-O-Me levels (ScoreC) at all 18S and 28S rRNA sites in control (DMSO) and FVP-treated conditions over 0-90 min chase timepoints. e, Quantification of 2′-O-Me levels (ScoreC) over 0-90 min chase timepoints at the 28S Gm1522 and 28S Am1524 sites (plotted in c) upon DMSO and FVP treatment. n (replicates) = 2 per time point. f-n, Quantification of the fraction of RNA cleaved at each site displayed in b for MCF10A cells upon perturbations to rRNA processing (red): FVP-treatment or knockdown of U3 snoRNA (U3 ASO), Fibrillarin (FBL siRNA), RPL5 (RPL5 shRNA), and U8 snoRNA (U8 ASO) compared to their respective controls (black; DMSO for FVP, or scramble/negative control for ASO, siRNA, and shRNA treatments). n = 1 (U8, RPL5) or 2 (FVP, U3, Fib) per time point. g-o, Average 2′-O-Me levels (ScoreC) on 18S (left) and 28S (right) rRNA in perturbations (red) and control conditions (black) over 0-90 min chase timepoints. n = 1 (U8, RPL5) or 2 (FVP, U3, Fib) per time point. All error bars are s.e.m. All data collected from MCF10A cells. Source data
Extended Data Fig. 4
Extended Data Fig. 4. Altered localization of RNA species and nucleolar morphology upon FVP treatment.
a, Nucleolar morphology (IF for RPA194, FBL, and NPM1 for FC, DFC and GC) in DMSO (-FVP) and after 30-90 min of 2 μM FVP treatment. b, Nucleolar morphology–FC (RPA16-GFP), DFC (NOP56-mCherry), and GC (mTagBFP2-NPM1)–after 0-90 min of FVP washout. Dashed lines demarcate nuclei; arrows indicate examples of GC reattachment to FC/DFC. c, Pearson correlation between DFC and GC signals from a and b. Left: Schematics illustrate GC detachment. Detachment: n = 303, 383, 327, 87 cells (0-120 min); Reattachment: n = 464, 291, 490, 182, 230, 182 cells (0-90 min). d-e, Schematic of 5eU pulse-chase scheme and example images of 5eU labelled RNA upon FVP perturbations. d, Representative images of 5eU-labelled RNA (30 min pulse, 60 min chase) and GC (mTagBFP2-NPM1) upon DMSO or 2 µM FVP treatment. Arrows demarcate 5eU labelled rRNA at the periphery of GC. e, Example images of 5eU RNA (15 min pulse, 0-90 min chase) and GC (mTagBFP2-NPM1) for correlation analysis in Fig. 2c (FVP-treated samples). f, RNA FISH upon 2 μM FVP treatment for 0 (-FVP), 60 (+FVP), and 120 min (+FVP), or 60 min FVP washout; GC (mTagBFP2-NPM1). Right: Pearson correlation between GC and FISH probes (5′ ETS: n = 91, 209, 320, 366; Site 1: n = 183, 58, 247, 291; Site 2: n = 127, 69, 272, 263; Site 4′: n = 139, 156, 86, 265; 28S rRNA: n = 138, 285, 196, 851 cells). g, 5eU pulse-chase scheme (15 min pulse, 0-90 min chase) and flux upon continuous FVP treatment or FVP washout. Bottom: FC (RPA16-GFP), DFC (NOP56-mCherry), and GC (mTagBFP2-NPM1), and 5eU RNA. h, Pearson correlation between 5eU and GC from g (Continuous: n = 221, 344, 358, 230, 273, 392 cells (0-90 min); Washout: n = 464, 291, 490, 182, 230, 182 cells (0-90 min)). Error bars are s.e.m. All scale bars = 3 μm. Violin plots are centred by median and quartiles are shown. MCF10A cells used except for d (HEK293T). Source data
Extended Data Fig. 5
Extended Data Fig. 5. Validation of all knockdowns performed in this study and comparison of nucleolar morphology between U3 snoRNA KD and Pol I inhibition.
a, Quantification of U3 snoRNA FISH intensity in nucleoli from scramble (SCR, n = 479) and U3 ASO-treated (n = 329) cells. **** p-value < 0.0001. b, RT-qPCR analysis for U3 snoRNA levels 72 hrs. post-treatment with SCR or U3 ASO (n = 3 biological replicates per condition). *** p-value = 0.0006. c, 18S/28S rRNA ratio (RNA electrophoresis) in total RNA isolated 72 hrs. after SCR, U3, or U8 ASO treatment (n = 3 biological replicates per condition). * p-value = 0.0241, **** p-value < 0.0001. d, Nucleolar morphology in HCT116, HEK293T, and MCF7 cells following SCR or U3 ASO treatment. e, Nucleolar morphology following U3 ASO or CX-5461 (Pol I inhibition) treatment. Markers: GC (mTagBFP2-NPM1), DFC (NOP56-mCherry), and FC (RPA16-GFP) for d and e. f, Number of FCs per nucleolus in U3 ASO (n = 30), SCR ASO (n = 30), CX-5461 (n = 35), and control (n = 31) nucleoli. *** p-value = 0.0002, **** p-value < 0.0001. g, Number of GCs per cell in SCR (n = 384) and U3 ASO (n = 177) conditions. **** p-value < 0.0001. h, Time course of nucleolar reorganization following 8-48 h of U3 ASO treatment in MCF10A (immunofluorescence for FC: RPA194; DFC: FBL; GC: RRP1) and HEK293T (endogenously tagged UBTF-sfGFP (FC), FBL-Halotag (DFC), and NPM1-mtagRFP (GC)) cells. i, Quantification of U3 snoRNA FISH from h. **** p-value: <0.0001 (two-tailed t-test), HEK293T: n = 160, 110, 46, 284, 27 nucleoli; MCF10A: n = 204, 147, 177, 97, 135 nucleoli. j, DFC rim score following U3 ASO treatment from h. ** p-value = 0.0069 (HEK293T), 0.0088 (MCF10A), **** p-value = <0.0001, HEK293T: n = 160, 14, 27, 167, 17 cells; MCF10A: n = 1050, 94, 138, 83, 68 cells. k, Mean nucleolar FBL intensity by IF upon FBL (n = 278) or control siRNA (n = 541) treatment. l, Western blot of FBL protein levels; β-actin serves as a loading control; For gel source data, see Supplementary Fig. 1c. m, 2′-O-Me levels (ScoreC) at 28S Gm4499 (right), a site modified independently from FBL, and averaged across all other 18S and 28S sites (left) in control and FBL KD treatment conditions measured by 5eU-seq over 15 min pulse, 0-120 min chase timepoints. n = 1-2 per time point. n, Fold change in U8 snoRNA levels (RT-qPCR; n = 3 biological replicates per condition). o, Quantification of U8 snoRNA FISH intensity in nucleoli upon SCR (n = 174) or U8 (n = 40) ASO treatment. p, Fold change in RPL5 mRNA expression by RT-qPCR (n = 3 biological replicates per condition). **** p-value < 0.0001, ** p-value = 0.0011. All scale bars = 3 μm. Box plots show medians (lines), boxes (25th-75th percentiles), whiskers (min-max). Violin plots: centred by median and quartiles shown. All error bars are s.e.m. Statistical tests are two-tailed Mann Whitney tests unless otherwise noted. MCF10A cells used unless otherwise stated. Source data
Extended Data Fig. 6
Extended Data Fig. 6. 5eU-imaging examples for processing perturbations.
a, Schematic of experimental workflow: cells were treated with various pre-rRNA processing perturbations followed by a 15 min 5eU pulse and chase time course (0-120 min). b, Representative images of 5eU-labelled RNA (white) and nucleoli (GC: mTagBFP2-NPM1, blue) in MCF10A cells over indicated chase timepoints under control (SCR) and perturbation conditions. Bottom, averaged 5eU intensity relative to individual FCs for each condition over time. Scale bars = 3 μm (cells) and 1 µm (averaged images). c-f, Quantification of 5eU peak distance from the centre of FCs over time for all perturbation conditions shown in b compared to corresponding controls. Number of nucleoli >100 for each time point per condition (see source data for specific n numbers). All error bars are s.e.m. Source data
Extended Data Fig. 7
Extended Data Fig. 7. Engineered rDNA plasmid designs used in this study.
a, Schematics of endogenous (top) 47S rDNA and synthetic (bottom, pSK_M323) rDNA plasmid with minimized (mini) 5′ ETS. Sequences of 3′ and 5′ hinge regions of 5′ ETS-U3 snoRNA base pairing are shown. b, Schematics of wildtype (WT) synthetic SSU-only, 5′ ETS 3′ hinge mutant SSU-only, and wildtype LSU-only rDNA plasmids. c, Structure of SSU processome in state pre-A1 (PDB: 7mq8). d, Zoom-in on 5′ and 3′ hinge RNA duplexes between the U3 snoRNA and 5′ ETS in c. e-f, Sequences of 3′ (e) and 5′ (f) hinges of 5′ ETS-U3 snoRNA base pairing in wildtype (WT), mutant 5′ ETS with mutant U3, and mutant 5′ ETS with WT U3 conditions. Sequence substitutions for mutants are marked by double-sided arrows. g, Schematics of complete U3 snoRNA gene combined with rDNA plasmids with 5′ ETS and U3 snoRNA 5′ hinge and 3′ hinge mutations.
Extended Data Fig. 8
Extended Data Fig. 8. Characterizing the synthetic nucleoli and mature rRNA produced from the engineered rDNA system.
a, Size comparison of endogenous and synthetic nucleoli (IF for FBL and NPM1 for DFC and GC, respectively) from endogenous, full-length plasmid, and Δ1,2,3 plasmid rDNA. Scale bar = 1 µm. b, Quantification of nucleolar area from a. Nucleolar size is not significantly different between any two conditions (two-tailed t-test, endogenous (n = 829), full length rDNA (n = 13), and Δ1,2,3 rDNA (n = 16)). c, Strand-specific RNA FISH (sense and antisense probes) demonstrate that FISH signal is specific to RNA (not DNA) in cells transfected with Δ1,2,3 rDNA plasmid (GC, mTagBFP2-NPM1). Scale bar = 10 μm. d, Left, polysome profiling of cells transfected with SSU-only or rDNA plasmids, compared to untransfected controls. Right, RT-qPCR quantification of plasmid-derived rRNA (18S*) and total 18S rRNA in input, monosome, and polysome fractions. e, Representative image of a “Hybrid” nucleolus containing endogenous (endo.) 5′ ETS pre-rRNA (yellow) and plasmid-derived rRNAs: 18S* (white) and 28S* (magenta). Scale bar = 3 μm. f, Localization of two GC markers, RRP1 and SURF6 (both detected by IF, blue), in endogenous and SSU-only nucleoli (DFC, NOP56-mCherry). Right, quantification of RRP1 (endogenous: n = 37; SSU-only: n = 10) and SURF6 (endogenous: n = 38; SSU-only: n = 13) intensity. Scale bars = 3 μm (left), = 1 μm (right). Box plots show medians (lines), boxes (25th-75th percentiles), whiskers (min-max). *** P-value < 0.0001 (two-tailed Mann-Whitney test). g-h, g, Cells transfected with LSU-only plasmid (28S* FISH, magenta) form a “hybrid” with endogenous nucleoli (endo. 5′ ETS, yellow). Note the absence of cytoplasmic 28S* signal despite the colocalization between plasmid-expressed 28S rRNA in endogenous nucleoli. h, Co-transfection of SSU-only (18S* FISH, white) and LSU-only (28S* FISH, magenta) plasmids to test whether co-localization between plasmid-expressed 18S* and 28S* rRNA is sufficient to rescue cytoplasmic 28S* export. Dotted lines outline nucleoli; solid lines outline nuclei. Arrows indicate colocalization events. DFC: NOP56-mCherry; GC: mTagBFP2-NPM1. Scale bar = 3 µm. HEK293T cells used in all panels. Source data
Extended Data Fig. 9
Extended Data Fig. 9. Nucleolar morphology changes for engineered rDNA plasmids with impaired U3 snoRNA base pairing.
a, De novo nucleolar morphology in HEK293T cells transfected with mutations with rDNA plasmids containing mutations in the 3′ or 5′ hinge U3 snoRNA binding sites within the 5′ ETS, along with compensatory U3 snoRNA mutations. Nucleoli were labelled by IF for DFC (FBL, red), GC (NPM1, blue), and RNA FISH for plasmid-derived 18S* rRNA (white) and endogenous 5′ ETS (yellow). b, De novo nucleoli labelled with markers for three nucleolar layers (FC, RPA194 IF; DFC, NOP56-mCherry; GC, mTagBFP2-NPM1) in HEK293T cells transfected with the same plasmids as in a. c, Validation of inverted nucleolar morphology using immunofluorescence staining for additional markers of the DFC (KRR1, ESF1, NOPP140 and UTP23) and GC (NPM1, RRP1, SURF6) in HEK293T cells. d, Top, HEK293T cell transfected with 3′ hinge mutant rDNA plasmid. Endogenous and de novo nucleoli can be distinguished using RNA FISH for endogenous 28S rRNA (endo 28S, yellow) and plasmid-derived 18S* rRNA (white). Bottom, zoom in on the endogenous and de novo nucleoli labelled with DFC (NOP56-mCherry, red) and GC (mTagBFP2-NPM1, blue) markers. e, Quantification of cytoplasmic 28S* plasmid rRNA signal from cells transfected with the indicated plasmids (corresponding to Fig. 4b). n = 36, 74, 84, 103, 92 cells. ** p-value = 0.0026; **** p-value < 0.0001 (two-tailed Mann-Whitney test). Box plots show medians (lines), boxes (25th-75th percentiles), whiskers (min-max). Scale bars = 1 μm (a-c), 3 μm (d). Source data
Extended Data Fig. 10
Extended Data Fig. 10. Characterization of perinucleolar chromatin upon inversion and rRNA outflux defects in mutant SSU-only nucleoli.
a, Staining of heterochromatin (H3K9me2/3; GC marked by RRP1 IF) and chromatin (DAPI; GC marked by NPM1 IF) surrounding de novo nucleoli from wild-type (WT) or 3′ hinge mutant rDNA-transfected cells. Right, radial distribution of (hetero)chromatin signal around the GC boundary (dashed line = 0 µm) in endogenous nucleoli, WT de novo nucleoli, or 3′ hinge mutant de novo nucleoli. DAPI: n = 1779 (Endogenous), 15 (rDNA plasmid), 15 (3′ hinge Mutant); H3K9me2/3 n = 37 (Endogenous), 33 (rDNA plasmid), 30 (3′ hinge Mutant). b, Radial distribution of chromatin (Hoechst) or heterochromatin (H3K9me2/3) around endogenous nucleoli in scramble (SCR) or U3 ASO treated cells. Hoechst: n = 1958 (SCR), 901 (U3 ASO), H3K9me2/3: n = 2556 (SCR), 562 (U3 ASO). c-f, Visualization of SSU processing factors and ribosomal proteins (proteins of interest (POIs), green) in WT and mutant SSU-only nucleoli demarcated by NOP56-mCherry. c-d, Radial distribution of KRI1 (IF, n = 17), KRR1 (IF, n = 26) and RPS4X-Halotag (n = 15) around the DFC boundary of WT SSU-only nucleoli. See Fig. 4g for images of the other quantified POIs. e-f, Radial distribution of EXOSC10 and RPS6 in WT and mutant SSU-only nucleoli. EXOSC10: n = 12 (WT), 38 (Mutant), RPS6: n = 21 (WT), 47 (Mutant). g, Mean nucleolar 18S* rRNA intensity in WT (n = 87) and mutant (n = 57) SSU-only nucleoli. **** P-value < 0.0001. h, Mean nucleolar intensity of early SSU processing factors ESF1, NAT10, and FBL (IF) and NOP56-mCherry in WT and Mutant SSU-only nucleoli. WT: n = 38, 49, 74, 87; Mutant: n = 33, 24, 164, 57 for ESF1, Nat10, Nop56, and Fib. *** P-value = 0.0005; **** P-value < 0.0001. i, DFC area (NOP56-mCherry) in WT (n = 74) and mutant (n = 164) SSU-only nucleoli. **** P-value < 0.0001. All scale bars = 1 μm. Violin plots are centred by median. Box plots show medians (lines), boxes (25th-75th percentiles), whiskers (min-max). Statistical tests are two-tailed Mann-Whitney tests. All error bars are s.e.m. HEK293T cells are used except for b (MCF10A). Source data

Update of

References

    1. Shin, Y. & Brangwynne, C. P. Liquid phase condensation in cell physiology and disease. Science357, eaaf4382 (2017). - PubMed
    1. Banani, S. F., Lee, H. O., Hyman, A. A. & Rosen, M. K. Biomolecular condensates: organizers of cellular biochemistry. Nat. Rev. Mol. Cell Biol.18, 285–298 (2017). - PMC - PubMed
    1. Henras, A. K., Plisson-Chastang, C., O’Donohue, M.-F., Chakraborty, A. & Gleizes, P.-E. An overview of pre-ribosomal RNA processing in eukaryotes. Wiley Interdiscip. Rev. RNA6, 225–242 (2015). - PMC - PubMed
    1. Vanden Broeck, A. & Klinge, S. Eukaryotic ribosome assembly. Annu. Rev. Biochem.93, 189–210 (2024). - PubMed
    1. Klinge, S. & Woolford, J. L. Jr. Ribosome assembly coming into focus. Nat. Rev. Mol. Cell Biol.20, 116–131 (2019). - PMC - PubMed

MeSH terms

LinkOut - more resources