. 2025 Aug;644(8075):241-251.
doi: 10.1038/s41586-025-09212-7. Epub 2025 Jul 2.

Rewiring endogenous genes in CAR T cells for tumour-restricted payload delivery

Affiliations

Rewiring endogenous genes in CAR T cells for tumour-restricted payload delivery

Amanda X Y Chen et al. Nature. 2025 Aug.

Abstract

The efficacy of chimeric antigen receptor (CAR) T cell therapy in solid tumours is limited by immunosuppression and antigen heterogeneity1-3. To overcome these barriers, 'armoured' CAR T cells, which secrete proinflammatory cytokines, have been developed4. However, their clinical application has been limited because of toxicity related to peripheral expression of the armouring transgene5. Here, we have developed a CRISPR knock-in strategy that leverages the regulatory mechanisms of endogenous genes to drive transgene expression in a tumour-localized manner. By screening endogenous genes with tumour-restricted expression, we have identified the NR4A2 and RGS16 promoters as promising candidates to support the delivery of cytokines such as IL-12 and IL-2 directly to the tumour site, leading to enhanced antitumour efficacy and long-term survival of mice in both syngeneic and xenogeneic models. This effect was concomitant with improved CAR T cell polyfunctionality, activation of endogenous antitumour immunity and a favourable safety profile, and was applicable in CAR T cells from patients.


Conflict of interest statement

Competing interests: P.A.B. declares research funding from Bristol-Myers-Squibb. P.K.D. declares research funding from Myeloid Therapeutics, Prescient Therapeutics, Bristol-Myers-Squibb and Juno Therapeutics. I.A.P. declares research funding from AstraZeneca, Bristol-Myers-Squibb and Roche Genentech. The authors declare the following patents related to this work: PCT/AU2021/051219, ‘Composition and methods for immunotherapy’ (19 October 2021) (A.X.Y.C., I.G.H., P.K.D. and P.A.B.); and PCT/AU2024/050379, ‘Compositions & methods for immunotherapy – II’ (20 April 2023) (A.X.Y.C., K.M.Y., P.K.D. and P.A.B). M.H.P. serves on the Scientific Advisory Board of Allogene Therapeutics and Biogen. He is on the Board of Directors and has equity in Kamau Therapeutics and has equity in CRISPR Therapeutics. The remaining authors declare no competing interests.

Figures

Fig. 1
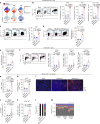
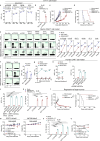
Fig. 1. Development of a CRISPR knock-in strategy to engineer armoured T cells with tumour-restricted transgene expression.
a, Schematic depicting the CRISPR knock-in approach. b, Design of the PD-1/GFP homologous repair template. c,d, Flow cytometry plots (c) and quantification of GFP expression (d) in mock or PD-1/GFP OT-I cells stimulated with anti-CD3/CD28 antibodies or the indicated tumour cell lines for 24 h or 72 h. Data are mean ± s.d. of technical duplicates to triplicates, representative of n = 3 experiments. Red asterisks in b,c denote the location of a stop codon. e,f, Mock or PD-1/GFP OT-I cells were adoptively transferred into mice bearing AT-3-ova tumours and analysed 8 days after transfer. Experimental workflow (e) and data (f) showing flow cytometry plots (left) and quantification (right) of GFP expression in OT-I cells, shown as mean ± s.e.m. from n = 7 mice per group. gk, OT-I cells engineered to express the indicated cytokines through the Pdcd1 locus were adoptively transferred into mice bearing AT-3-ova tumours. Data are tumour growth curves (gi); body weight of mice treated with the indicated doses (j); and serum IL-12 concentration (k) in mice treated with 5 × 106 OT-I cells at day 3 after treatment. Dashed line in j indicates 20% weight loss. Data in gk are mean ± s.e.m. from n = 18 mice per group pooled from n = 3 experiments (g) or n = 6 mice per group (IFNγ, IFNα9 and IFNβ), or n = 4 (non-treated, PD-1/IL-2) and 5 (mock) mice per group (IL-2), representative of n = 2 (IFNα9 and IFNβ) or 3 (IFNγ and IL-2) experiments (h); n = 5 mice per group (ik). d,g, Two-way analysis of variance (ANOVA); f, two-sided paired t-test; h, two-way ANOVA (IFNγ, IFNα9 and IFNβ) and two-sided unpaired t-test (IL-2); k, one-way ANOVA. *P < 0.05, **P < 0.01, ****P < 0.0001. Illustrations in a and e created using BioRender: a, Chen, A., https://BioRender.com/y6lxgqk (2025); e, Chen, A., https://BioRender.com/dzawe25 (2025). Source Data
Fig. 2
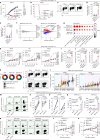
Fig. 2. Identification of optimal target genes for CRISPR-engineered armoured T cells.
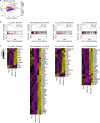
a,b, Bulk RNA sequencing of CD8+ murine anti-hHer2 or human anti-LeY CAR T cells from tumours and spleens of E0771-hHer2 or OVCAR-3 tumour-bearing mice at day 8 or 9 after treatment, respectively. Correlation plot of murine and human CAR T cell data (a) and log fold change (logFC) in expression of top 27 genes with high differential expression between intratumoral and splenic human CAR T cells (b); red, higher logFC than PDCD1; blue, lower logFC than PDCD1. Data are representative of n = 2 biological replicates. c, Heatmaps showing logFC in expression (tumour versus spleen) for the 27 genes shown in b (left), and the impact of their CRISPR/Cas9-mediated knockout (KO) on the proliferation of human anti-LeY CAR T cells and their cytokine-producing and killing capacities following OVCAR-3 tumour cell co-culture (right). Knockout data represent logFC normalized to mock CAR T cells pooled from n = 3 donors. Coloured text highlights genes that were selected for further analysis via CRISPR-mediated GFP knock-in. d,e, Human anti-LeY CAR T cells engineered to express GFP were co-cultured with OVCAR-3 tumour cells for 72 h. Flow cytometry plots (d) and quantification (e) of GFP expression in CD8+ CAR T cells, represented as mean ± s.d. of technical triplicates from n = 3 (CLU, DUSP4, RGS1, RGS2 and TNFAIP3), 4 (PD-1) or 8 (NR4A2 and RGS16) donors. FSC-A, forward scatter area. fi, Human anti-LeY CAR T cells adoptively transferred into mice bearing OVCAR-3 tumours were assessed 14 days after transfer. MFI, mean fluorescence intensity. Data are experimental workflow (f); flow cytometry plots (g); quantification of GFP percentage (h) and ΔMFI (i) in intratumoral and splenic CD8+ CAR T cells, showing mean ± s.e.m. from n = 8 mice per group pooled from n = 2 donors (CLU, PD-1, RGS1 and RGS2) and n = 16 mice per group pooled from n = 4 donors (NR4A2 and RGS16). j, Flow chart summarizing the identification of NR4A2 and RGS16 (green text). c,i, One-way ANOVA; e, two-sided paired t-test; h, two-way ANOVA. *P < 0.05, **P < 0.01, ***P < 0.001, ****P < 0.0001. Illustrations in f created using BioRender: Chen, A., https://BioRender.com/dzawe25 (2025). Source Data
Fig. 3
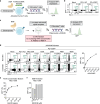
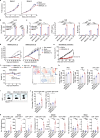
Fig. 3. NR4A2/IL-12 engineered T cells are well tolerated and elicit potent antitumour immunity.
a,b, OT-I cells engineered to express GFP were assessed after 24-hour stimulation with anti-CD3/CD28 antibodies or ova-expressing tumour cells (a) and in mice bearing AT-3-ova tumours 8 days after transfer (b). Flow cytometry plots (left) and quantification (right) of GFP expression in OT-I cells. ce, We adoptively transferred 12.5 × 106 mock, NR4A2 knockout or NR4A2/IL-12 OT-I cells into mice with AT-3-ova tumours. Data are tumour growth (c), survival (d) and body weight (e). f, Schematic depicting differences between endogenous and synthetic promoters. gi, Murine anti-Her2 CAR T cells expressing GFP through synthetic NFAT or endogenous Nr4a2 promoters were assessed after 24-hour stimulation with anti-CD3/CD28, anti-CAR antibodies or hHer2-expressing tumour cells (g) and in E0771-hHer2 tumour-bearing mice 9 days after transfer (h,i). Flow cytometry plots (h) and quantification (g and i) of GFP expression in CD8+ CAR T cells. j,k, 5 × 106 mock, NR4A2 knockout or NR4A2/IL-12 murine anti-hHer2 CAR T cells were adoptively transferred into E0771-hHer2 (j) or MC38-hHer2 (k) tumour-bearing mice. Data are tumour growth (left) and survival (right). a,g, Data are mean ± s.d. of technical triplicates, representative of n = 3 (a) and n = 2 (g) experiments. be,hk, Data are mean ± s.e.m. from n = 6 (NR4A2/GFP) or 7 (PD-1/GFP) mice per group, representative of n = 3 experiments (b); n = 5 mice per group (ce); n = 3 (tumour) and 4 (non-tumour tissues) mice per group (h,i); n = 4 (NR4A2/IL-12), n = 5 (mock) and n = 6 (non-treated, NR4A2 knockout) mice per group (left), or n = 5 (mock), n = 6 (non-treated, NR4A2 knockout) and n = 7 (NR4A2/IL-12) mice per group (right), representative of n = 2 experiments (j); n = 6 mice per group (k). ac,g,jk (Left), two-way ANOVA; d,j(right), log-rank Mantel–Cox test; i, one-way ANOVA. NS, not significant; *P < 0.05, **P < 0.01, ***P < 0.001, ****P < 0.0001. Illustrations in f created using BioRender: Chen, A., https://BioRender.com/03b4c93 (2025). Source Data
Fig. 4
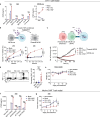
Fig. 4. NR4A2/IL-12 engineered T cells exhibit an enhanced proinflammatory phenotype and effectively promote host antitumour immunity.
af, Mock, NR4A2 knockout or NR4A2/IL-12 OT-I cells (CD45.2+) were adoptively transferred into CD45.1+ mice bearing AT-3-ova tumours, and ex vivo analyses were performed 8 days later. Data are t-SNE plots comparing protein expression in intratumoral OT-I cells (a); flow cytometry plots (left) and quantification (right) of IFNγ, TNF, Ki67, PD-1 and Tim3 expression in intratumoral (b,c) or splenic (d) OT-I cells; quantification of H-2Kb SIINFEKL tetramer+ host splenic CD8+ T cells (e); and flow cytometry plots (left) and quantification (right) of IFNγ and TNF expression in host intratumoral CD8+ T cells (f). gm, 5 × 106 mock, NR4A2 knockout or NR4A2/IL-12 murine anti-hHer2 CAR T cells were adoptively transferred into MC38-hHer2 tumour-bearing mice and ex vivo analyses were performed 9 days later. Data are quantification of intratumoral CD8+ T cells (g) and their Ki67 expression (h); immunofluorescence imaging of tumours showing CD4, CD8 and DAPI, representative of n = 3 mice per group (i); quantification of H-2Kb p15E tetramer+ splenic CD8+ T cells (j) and IFNγ+ TNF+ intratumoral CD8+ T cells (k); green data points indicate mice with tumour dLNs analysed by TCR sequencing (lm), showing cumulative frequencies of the top five TCR clonotypes (indicated by five colours; black indicates all other TCR clonotypes) in tumour dLNs. ac,f,k, Tumours were ex vivo stimulated with SIINFEKL (ac,f) or MC38 neoantigen peptides (k) for 3 h. ad,f, Plots concatenated from n = 5 mice per group. bh,jk, Data are mean ± s.e.m. from n = 8 (NR4A2/IL-12), n = 9 (mock) and n = 10 (NR4A2 knockout) mice per group (bc,f) or n = 10 mice per group (d,e) pooled from n = 2 experiments; n = 6 (mock, NR4A2 knockout) and n = 3 (g,k) or n = 5 (h) or n = 12 (j) (NR4A2/IL-12) mice per group. One-way ANOVA. *P < 0.05, **P < 0.01, ***P < 0.001, ****P < 0.0001. Scale bar in i, 50 μm. Source Data
Fig. 5
Fig. 5. Therapeutic efficacy and clinical applicability of CRISPR-engineered human CAR T cells.
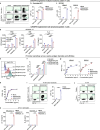
ak, Human anti-LeY CAR T cells engineered to express IL-12 (a–g) or IL-2 (h–k) were transferred into OVCAR-3 tumour-bearing mice, with CD8+ (cg,i,k) or bulk (j) CAR T cells analysed ex vivo 11–14 days later. Data are tumour growth (a,h); survival (b); intratumoral IFNγ and TNF expression (c); peripheral blood GzmB (d) and Ki67 expression (e); transcriptomic comparison of indicated intratumoral CAR T cells (f); GSEA of indicated pathways (false discovery rate (FDR) < 0.05) (g); intratumoral Ki67 expression (i); frequencies of intratumoral and splenic CAR T cells (j); and proportion of cytokine-expressing intratumoral CAR T cells (k). Tumours were PMA/ionomycin-restimulated for 3 h (c,i,k). NES, normalized enrichment score. l, Frequencies of patient T cells expressing NR4A2 or RGS16 were reanalysed from ref. (TCGA abbreviations). Boxes represent the interquartile range (IQR), with whiskers extended to the maximum and minimum values within 1.5 IQR. Lines within boxes denote the median value. mp, DLBCL patient-derived anti-LeY CAR T cells were CRISPR-engineered and stimulated in vitro. Data show GFP expression in CD8+ CAR T cells after 72 h (mo) and IL-12/IL-2 concentrations after 24 h (p). qs, Anti-LeY CAR T cells generated by retroviral transduction or TRAC-targeted knock-in, with simultaneous GFP/IL-12/IL-2 knock-in to NR4A2/RGS16, were assessed in vitro (q) and in OVCAR-3 tumour-bearing mice (r,s). Data are GFP expression in CD8+ CAR T cells after 24 h (q) and tumour growth (r,s). ae,hk,r,s, Data are mean ± s.e.m. from n = 5 (NR4A2/IL-12) and n = 6 (non-treated, mock and NR4A2 knockout) mice per group (a,b); n = 4 mice per group (c,ik,r,s); n = 11 (NR4A2/IL-12) and n = 12 (mock and NR4A2 knockout) mice per group pooled from n = 2 experiments (d,e); n = 3 (NR4A2 knockout), n = 5 (PD-1 knockout and RGS16/IL-2) and n = 6 (non-treated, mock, NR4A2/IL-2, PD-1/IL-2 and RGS16 knockout) mice per group (h). f,g, Data from n = 2 biological replicates of n = 8 mice per group. mq, Data represent mean ± s.d. of technical triplicates, from n = 6 donors (mo). a,h,p,r,s, Two-way ANOVA; b, log-rank Mantel–Cox test; d,e,ij, one-way ANOVA; n,o, two-sided paired t-test. *P < 0.05, **P < 0.01, ***P < 0.001, ****P < 0.0001. Source Data
Extended Data Fig. 1
Extended Data Fig. 1. Optimization of a CRISPR-HDR protocol for engineering primary murine T cells.
a. Schematic of CRISPR-HDR protocol using a PD-1/GFP dsDNA repair template. Cas9 and PD-1-targeting sgRNA RNPs were electroporated into activated murine T cells with a purified PD-1/GFP dsDNA repair template and stimulated 72 h later with plate-bound anti-CD3 and CD28 antibodies for 24 h before analysis of GFP by flow cytometry. b. Flow cytometry plots showing GFP expression in stimulated Mock, PD-1 KO or PD-1/GFP murine T cells, representative of n = 3 experiments. c. Schematic of CRISPR-HDR protocol using a PD-1/GFP AAV6 repair template. Cas9 and PD-1-targeting sgRNA RNPs were electroporated into activated murine T cells then incubated with a PD-1/GFP AAV6 repair template for 4 h prior to GFP analyses 72 h later as per (a). d. Flow cytometry plots (left) and quantification (right) of GFP expression in Mock, PD-1 KO or PD-1/GFP murine T cells edited with AAV6 at the indicated MOIs. Data represent mean ± SD of technical duplicates, representative of n = 2 experiments. e. Quantification of GFP expression in stimulated PD-1/GFP murine T cells edited with AAV6 at an MOI of 100 K, incubated at decreasing volumes to increase the effective AAV6 concentration, represented as mean ± SD of technical duplicates. f. Quantification of GFP expression in stimulated PD-1/GFP murine T cells edited with AAV6 at an MOI of 100 K and M3814 at the indicated concentrations, representative of n = 2 experiments. Illustrations in a and c created using BioRender: a, Chen, A., https://BioRender.com/ye4jk15 (2025); c, Chen, A., https://BioRender.com/ye4jk15 (2025). Source Data
Extended Data Fig. 2
Extended Data Fig. 2. Validation of CRISPR KI strategy with PD-1/TNF OT-I and murine anti-hHer2 CAR T cells.
a-e. Assessment of PD-1/TNF OT-I cells in vitro (a-c) and in vivo (d-e). a. TNF concentration in supernatants of Mock, PD-1 KO or PD-1/TNF OT-I cells stimulated with anti-CD3/28 antibodies or the indicated tumor cell lines for 24 or 72 h. b. TNF-conditioned supernatants from a 24 and 72 h coculture with MC38-ova tumor cells and indicated OT-I cells were added to 51Cr-labelled parental MC38 tumor cells and incubated for 16 h before quantifying 51Cr release. c. OT-I cells were cocultured with a 1:1 mix of mCherry+ parental MC38 and GFP+ MC38-ova tumor cells and imaged using the Incucyte Live-Cell Analysis System. Tumor cells were quantified based on mCherry or GFP expression. (a-c) Data represent mean ± SD of technical triplicates, representative of n = 3 experiments. d-e. Mock, PD-1 KO or PD-1/TNF OT-I cells were adoptively transferred into mice bearing orthotopic AT-3-ova tumors. d. 8 days post transfer, tumors were harvested, processed and cocultured with fresh AT-3-ova tumor cells for 16 h prior to analysis of TNF expression in OT-I cells. Flow cytometry plots from concatenated samples of n = 6 mice/group (left) and quantification of TNF expression represented as mean ± SEM from n = 18 (Mock) and 19 (PD-1 KO, PD-1/TNF) mice/group pooled from n = 3 experiments (right). e. Body weight of mice, represented as mean ± SEM from n = 6 mice/group. f-g. Assessment of PD-1/TNF murine anti-hHer2 CAR T cells. f. TNF concentration in supernatants of Mock, PD-1/GFP or PD-1/TNF murine anti-hHer2 CAR T cells cocultured with the indicated hHer2-expressing tumor cell lines for 24 h. Data represent mean ± SD of technical triplicates, representative of n = 3 experiments. g. Mock, PD-1 KO or PD-1/TNF murine anti-hHer2 CAR T cells were adoptively transferred into mice bearing subcutaneous MC38-hHer2 tumors. Tumor growth curve represented as mean ± SEM from n = 5 (Non-treated, Mock, PD-1/TNF) and 6 (PD-1 KO) mice/group. (a-c, f-g) Two-way ANOVA. (d) One-way ANOVA. *p < 0.05, **p < 0.01, ****p < 0.0001. Illustrations in b and c created using BioRender: b, Chen, A., https://BioRender.com/q0g8j7b (2025); c, Chen, A., https://BioRender.com/q0g8j7b (2025). Source Data
Extended Data Fig. 3
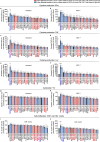
Extended Data Fig. 3. RNA sequencing of murine and human CAR T cells isolated from tumors and spleens of tumor-bearing mice.
3′ bulk RNA sequencing of CD8+ murine anti-hHer2 (a-b) or CD4+ (d-e, g, i) or CD8+ (c, f, h) human anti-LeY CAR T cells isolated from tumors and spleens of E0771-hHer2 or OVCAR-3 tumor-bearing mice at day 8 or 9 post treatment, respectively. a. MA plot depicting differentially expressed genes in CD8+ murine CAR T cells isolated from the tumor relative to the spleen. b. Log fold change (logFC) in expression in CD8+ murine CAR T cells of the top 27 genes identified to exhibit high differential expression in the tumor relative to the spleen in CD8+ human CAR T cells from Fig. 2b. Red and blue bars represent genes with higher and lower logFC than PDCD1, respectively. c-d. MA plots depicting differentially expressed genes in CD8+ (c) or CD4+ (d) human CAR T cells isolated from the tumor relative to the spleen. e. LogFC in expression in CD4+ human CAR T cells of the top 27 genes identified to exhibit high differential expression in the tumor relative to the spleen in CD8+ human CAR T cells. f-i. Counts per million (CPM) values of the 27 genes in CD8+ (f) or CD4+ (g) human CAR T cells isolated from the spleen and CD8+ (h) or CD4+ (i) human CAR T cells isolated from the tumor. (a-i) Data were obtained from n = 2 biological replicates, each pooled from n = 3 mice. Source Data
Extended Data Fig. 4
Extended Data Fig. 4. Impact of CRISPR-mediated knockout of target genes on functions of human anti-LeY CAR T cells.
Each of the 27 target genes of interest was knocked out in human anti-LeY CAR T cells via CRISPR/Cas9 gene editing. a-f. Human CAR T cells with the indicated gene KO were cocultured with OVCAR-3 (a, c, e) or MCF-7 (b, d, f) tumor cells for 24 h before the concentrations of IFNγ (a-b), TNF (c-d) and IL-2 (e-f) in supernatants were assessed. g-h. Human CAR T cells with the indicated gene KO were cocultured with 51Cr-labelled OVCAR-3 (g) or MCF-7 (h) tumor cells for 16 h before quantifying 51Cr release. i-j. Human CAR T cells with the indicated gene KO were maintained in culture with IL-2 for over 28 days and the numbers of CD8+ (i) and CD4+ (j) T cells were determined. (a-j) Data represent logFC values normalized to Mock CAR T cells pooled from n = 3 donors. One-way ANOVA. *p < 0.05, **p < 0.01, ***p < 0.001, ****p < 0.0001. Source Data
Extended Data Fig. 5
Extended Data Fig. 5. Transgene expression profiles of shortlisted target genes in human anti-LeY CAR T cells.
a-f. Human anti-LeY CAR T cells were engineered to express Gfp from the indicated gene loci and cocultured with OVCAR-3 (a-b) or MCF-7 (c-f) tumor cells for 72 h before GFP expression in CD4+ (a-b, e-f) or CD8+ (c-d) CAR T cells was assessed. a, c, e. Quantification of GFP percentage and b, d, f. fold change in GFP MFI of human CAR T cells following coculture. (a, c, e) Data represent mean ± SD of technical triplicates from n = 3 (CLU, DUSP4, RGS1, RGS2, TNFAIP3), 4 (PD-1) and 8 (NR4A2, RGS16) donors. (b, d, f) Data represent mean ± SEM pooled from n = 3 (CLU, DUSP4, RGS1, RGS2, TNFAIP3), 4 (PD-1) and 8 (NR4A2, RGS16) donors. g-h. Human anti-LeY CAR T cells engineered as per (a-f) were adoptively transferred into mice bearing subcutaneous OVCAR-3 tumors. 14 days later, tumors, spleens and livers were harvested and GFP expression by CD8+ human CAR T cells was assessed. g. Flow cytometry plots from concatenated samples of n = 4 mice/group, representative of n = 2 donors. h. Quantification of GFP percentage of CD8+ human CAR T cells in the tumor, spleen and liver. Data represent mean ± SEM from n = 8 mice/group pooled from n = 2 donors. i. Human anti-LeY CAR T cells engineered as per (a-f) were cocultured with OVCAR-3 tumor cells for 72 h. Concatenated flow cytometry plots showing CAR and GFP expression in CD8+ T cells from technical triplicates, representative of n = 8 donors. (a, c, e) Paired student’s t-test. (b, d, f) One-way ANOVA. (h) Two-way ANOVA. n.s. not significant, *p < 0.05, **p < 0.01, ****p < 0.0001. Source Data
Extended Data Fig. 6
Extended Data Fig. 6. Assessment of transgene expression driven by the Nr4a2 and NFAT promoters.
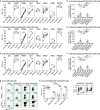
a. NR4A2/GFP OT-I cells were stimulated with anti-CD3/28 antibodies or the indicated ova-expressing tumor lines for 24 or 72 h before GFP expression was quantified. Data represent mean ± SD of technical triplicates, representative of n = 3 experiments. b-d. NR4A2/IL-12 OT-I cells were generated and assessed in vitro (b) and in vivo (c-d). b. IL-12 concentration in supernatants of Mock or NR4A2/IL-12 OT-I cells stimulated with anti-CD3/28 antibodies for 24 h, represented as mean ± SD of n = 6 technical replicates. c-d. 1 × 10⁶ Mock, NR4A2 KO or NR4A2/IL-12 OT-I cells were adoptively transferred into mice bearing orthotopic AT-3-ova tumors. c. Tumor growth curve represented as mean ± SEM from n = 5 mice/group, representative of n = 3 experiments. d. Survival curve from n = 5 (NR4A2 KO), 9 (NR4A2/IL-12) and 10 (Non-treated, Mock) mice/group, pooled from n = 2 experiments. e-f. Murine anti-hHer2 CAR T cells were engineered to express Gfp via the Pdcd1 or Nr4a2 locus and assessed upon in vitro stimulation with anti-CD3/28, anti-CAR antibodies or the indicated tumor cell lines (e) and in mice bearing orthotopic E0771-hHer2 tumors (f). e. Concatenated flow cytometry plots (left) and quantification (right) of GFP expression in CAR T cells following a 24 h stimulation. Data represent mean ± SD of technical triplicates, representative of n = 3 experiments. f. Concatenated flow cytometry plots (left) and quantification (right) of GFP percentage in CAR T cells in the tumor and spleen harvested 7 days post transfer. Data represent mean ± SEM from n = 3 mice/group, representative of n = 2 experiments. g. Murine T cells were retrovirally transduced with an anti-hHer2 CAR and either with an NFAT-GFP construct or CRISPR-engineered to express Gfp from the Nr4a2 locus, and assessed for GFP expression in mice bearing orthotopic E0771-hHer2 tumors. Quantification of GFP percentage in CAR T cells pre-infusion and in the spleen of mice 3, 6 and 9 days post transfer, represented as mean ± SEM from n = 3 (Mock) and 4 (NR4A2/GFP, NFAT-GFP) mice/group. h-i. Human T cells were retrovirally transduced with an anti-LeY CAR and either with an NFAT-GFP construct or CRISPR-engineered to express Gfp from the NR4A2 locus, and assessed for GFP expression in mice bearing subcutaneous OVCAR-3 tumors (h-i) or non-tumor bearing mice (i). Quantification of GFP percentage in CD8+ human CAR T cells in h. the blood of tumor-bearing mice 4 and 7 days post transfer and i. the spleen of tumor- and non-tumor bearing mice 7 days post transfer, represented as mean ± SEM from n = 4 mice/group. j. Murine T cells engineered as per (g) were assessed for GFP expression in mice bearing orthotopic E0771-hHer2 tumors, E0771 parental tumors or non-tumor bearing mice. Quantification of GFP percentage in CAR T cells in the spleen of mice 3 days post transfer, represented as mean ± SEM from n = 3 (Mock) and 4 (NR4A2/GFP, NFAT-GFP) mice/group (E0771-hHer2); n = 4 mice/group (E0771 parental); n = 3 mice/group (no tumor). k. IL-12 concentration in supernatants of Mock, NR4A2 KO or NR4A2/IL-12 murine anti-hHer2 CAR T cells stimulated with anti-CD3/28 or anti-CAR antibodies, or E0771-hHer2 tumor cells for 24 h. Data represent mean ± SD of technical triplicates, representative of n = 3 experiments. l. 5 × 106 mock or NR4A2/IL-12 murine anti-hHer2 CAR T cells were adoptively transferred into mice bearing orthotopic E0771-hHer2 tumors > 30 mm2. Tumor growth curves (left) represented as mean ± SEM from n = 6 mice/group. Survival curves (right) from n = 6 mice/group. m. 5 × 106 mock, NR4A2 KO or NR4A2/IL-12 murine anti-hHer2 CAR T cells were adoptively transferred into mice bearing orthotopic E0771-hHer2 tumors (left) or subcutaneous MC38-hHer2 tumors (right). Body weights represented as mean ± SEM from n = 4 (NR4A2/IL-12) and 6 (Non-treated, Mock, NR4A2 KO) mice/group (E0771-hHer2); n = 6 mice/group (MC38-hHer2). n-o. Murine T cells were retrovirally transduced with an anti-hHer2 CAR and either with an NFAT-IL-12 construct or CRISPR-engineered to express IL-12 from the Nr4a2 locus. n. Concentration of IL-12 in supernatants upon in vitro stimulation with anti-CD3/28, anti-CAR antibodies or hHer2-expressing tumor cells. Data represent mean ± SD of technical triplicates, representative of n = 2 experiments. o. 5 × 106 mock, NR4A2/IL-12 or NFAT-IL-12 murine anti-hHer2 CAR T cells were adoptively transferred into mice bearing orthotopic E0771-hHer2 tumors. Body weights represented as mean ± SEM from n = 5 (NFAT-IL-12) and 6 (Non-treated, Mock, NR4A2/IL-12) mice/group. (a-c, e, f-h, j-k, l (left), n) Two-way ANOVA. (d, l (right)) Logrank Mantel-Cox test. (i) One-way ANOVA. n.s. not significant, **p < 0.01, ***p < 0.001, ****p < 0.0001. Source Data
Extended Data Fig. 7
Extended Data Fig. 7. Mechanistic studies of NR4A2/IL-12 OT-I T cells and murine anti-hHer2 CAR T cells.
a-e. NR4A2/IL-12 OT-I T cells (CD45.2+) were adoptively transferred into congenic CD45.1+ mice bearing orthotopic AT-3-ova tumors and ex vivo analyses were performed 8 days post transfer. Transferred OT-I T cells were identified as live CD45.2+ Thy1.2+ CD8+ cells. Endogenous CD8+ T cells were identified as live CD45.1+ Thy1.2+ CD8+ cells. a. Quantification of OT-I T cells in the tumor (left) and spleen (right). b. Proportion of splenic OT-I T cells with effector memory (TEM), central memory (TCM) or stem cell memory (TSCM) phenotype, based on CD62L and CD44 expression. Data represent mean proportions from n = 5 mice/group. c. Quantification of PD-1 and Tim3 expression in OT-I T cells in the spleen. d. Concatenated flow cytometry plots (left) and quantification (right) of TNF and IFNγ expression in host CD8+ T cells in the dLN. e. Concatenated flow cytometry plots (left) and quantification (right) of Ki67 expression in host CD8+ T cells in the tumor. (d-e) Samples were ex vivo stimulated with SIINFEKL peptide for 3 h. (a, c-e) Data represent mean ± SEM from n = 8 (NR4A2/IL-12), 9 (Mock) and 10 (NR4A2 KO) mice/group (tumor), or n = 10 mice/group (spleen) (a), n = 10 mice/group (c), n = 7 (NR4A2 KO), 9 (Mock) and 10 (NR4A2/IL-12) mice/group (d), or n = 8 (NR4A2/IL-12), 9 (Mock) and 10 (NR4A2 KO) mice/group (e) pooled from n = 2 experiments. (d-e) Flow cytometry plots from concatenated samples of n = 5 mice/group. f-g. Mice with previously cured E0771-hHer2 (f) or MC38-hHer2 (g) tumors following treatment with NR4A2/IL-12 murine anti-hHer2 CAR T cells were rechallenged with parental E0771 or MC38 tumors in the opposite mammary fat pad or flank, respectively. Tumor growth curves represented as mean ± SEM from n = 6 mice/group (E0771) or n = 5 (NR4A2/IL-12) and 11 (Naïve) mice/group (MC38). (a, c-e) One-way ANOVA. (f-g) Two-way ANOVA. n.s. not significant, *p < 0.05, **p < 0.01, ****p < 0.0001. Source Data
Extended Data Fig. 8
Extended Data Fig. 8. Scalability, therapeutic efficacy and safety of NR4A2/IL-12 human anti-LeY CAR T cells.
a. Human anti-LeY CAR T cells engineered to express IL-12 from the NR4A2 locus were maintained in culture with IL-2 for over 11 days and the fold expansion following transduction was determined from n = 2 donors. b-c. Human anti-LeY CAR T cells engineered to express IL-12 from either the NR4A2 or PDCD1 locus were co-cultured with OVCAR-3 or MCF-7 tumor cells for 24 h before the concentrations of IL-12 (b) as well as IFNγ, TNF and IL-2 (c) in supernatants were assessed. Data represent mean ± SD of technical triplicates. d-k. Human anti-LeY CAR T cells engineered as per (b-c) were adoptively transferred into mice bearing subcutaneous OVCAR-3 tumors. d. Tumor growth curves from n = 2 donors, represented as mean ± SEM from n = 5 (NR4A2/IL-12) and 6 (Non-treated, Mock, NR4A2 KO) mice/group (Donor 1), or n = 3 (NR4A2/IL-12), 4 (Mock, NR4A2 KO) and 6 (Non-treated) mice/group (Donor 2). e. Mice with previously cured OVCAR-3 tumors following treatment with NR4A2/IL-12 human anti-LeY CAR T cells were rechallenged with OVCAR-3 tumors in the opposite flank. Tumor growth curves represented as mean ± SEM from n = 5 (NR4A2/IL-12) and 9 (Naïve) mice/group. f. Body weight of mice post treatment, represented as mean ± SEM from n = 6 mice/group. g-k. Ex vivo analysis of human CAR T cells isolated from tumors (g-h, j-k), spleens (j-k) or blood (i, k) 11-14 days post transfer. g. t-SNE plots comparing expression of indicated proteins in intratumoral Mock and NR4A2/IL-12 CD8+ human CAR T cells, concatenated from n = 4 mice/group. h. Quantification of IFNγ and TNF expression in intratumoral CD8+ human CAR T cells. Data represent mean ± SEM from n = 4 mice/group. (g-h) Tumor samples were ex vivo stimulated with PMA/Ionomycin for 3 h. i. Flow cytometry plots showing Ki67 expression in CD8+ human CAR T cells isolated from the blood, concatenated from n = 5 (NR4A2/IL-12) and 6 (Mock, NR4A2 KO) mice/group. j. Quantification of CAR expression in the tumor and spleen, represented as mean ± SEM from n = 4 mice/group. k. Quantification of bulk, CD8+ and CD4+ human CAR T cells isolated from tumors (left), spleens (middle) and blood (right). Left and middle: Data represent mean ± SEM from n = 4 mice/group. Right: Data represent mean ± SEM from n = 8 mice/group, representative of n = 2 donors. (b-c, d-e) Two-way ANOVA. (h, j-k) One-way ANOVA. n.s. not significant, *p < 0.05, **p < 0.01, ***p < 0.001, ****p < 0.0001. Source Data
Extended Data Fig. 9
Extended Data Fig. 9. Transcriptomic analysis of NR4A2/IL-12 human anti-LeY CAR T cells.
Human anti-LeY CAR T cells were engineered to express IL-12 from the NR4A2 locus and adoptively transferred into mice bearing subcutaneous OVCAR-3 tumors. 3′ bulk RNA sequencing analysis was performed on CD8+ CAR T cells isolated from tumors at day 14 post treatment. a. MA plot comparing gene expression in NR4A2/IL-12 and Mock-edited CAR T cells. Annotated genes are those associated with the C2 IL-12 signaling pathway (Gene Set: IL12_STAT4_PATHWAY). b-c. Gene set enrichment analysis (GSEA) plots (b) and heatmaps (c) for C2 (IL12_STAT4_PATHWAY) or Hallmark (TNFA_SIGNALING_VIA_NFKB, IL6_JAK_STAT3_SIGNALING and IL2_STAT5_SIGNALING) pathways determined to exhibit differential expression between NR4A2/IL-12 and NR4A2 KO or Mock-edited CAR T cells. (a-c) Data were obtained from n = 2 biological replicates per group, each pooled from n = 8 mice.
Extended Data Fig. 10
Extended Data Fig. 10. Characterization of RGS16/IL-2 human anti-LeY and murine anti-hHer2 CAR T cells.
a-b. Human anti-LeY CAR T cells were engineered to express IL-2 from either the NR4A2, PDCD1 or RGS16 locus and co-cultured with OVCAR-3 or MCF-7 tumor cells for 24 and 72 h before the concentration of IL-2 in supernatants was assessed. a. Concentration of IL-2 post 24 h of stimulation with OVCAR-3 or MCF-7 tumor cells. b. Concentration of IL-2 post 24 and 72 h of stimulation with OVCAR-3 tumor cells. (a-b) Data represent mean ± SD of technical triplicates. c-e. Human anti-LeY CAR T cells engineered as per (a-b) were adoptively transferred into mice bearing subcutaneous OVCAR-3 tumors. c. Body weight of mice post treatment, represented as mean ± SEM from n = 6 mice/group. d. Flow cytometry plots of Ki67 expression in intratumoral CD8+ human CAR T cells following ex vivo stimulation with PMA/Ionomycin for 3 h, concatenated from n = 4 mice/group. e. Quantification of CD8+ and CD4+ human CAR T cells in tumors (left), spleens (middle) and blood (right) 14-15 days post transfer. Left and middle: Data represent mean ± SEM from n = 4 mice/group. Right: Data represent mean ± SEM from n = 6 mice/group, representative of n = 2 donors. f-g. 5 × 10mock, RGS16 KO or RGS16/IL-2 murine anti-hHer2 CAR T cells were adoptively transferred into mice bearing orthotopic E0771-hHer2 tumors. f. Tumor growth curves represented as mean ± SEM from n = 4 (RGS16 KO), 5 (Mock) and 6 (Non-treated, RGS16/IL-2) mice/group. g. Quantification of intratumoral Tregs (CD4+ CD25+ FoxP3+) 9 days post transfer. Data represent mean ± SEM from n = 4 mice/group. (a-b, f) Two-way ANOVA. (e, g) One-way ANOVA. n.s. not significant, *p < 0.05, **p < 0.01, ***p < 0.001, ****p < 0.0001. Source Data
Extended Data Fig. 11
Extended Data Fig. 11. Clinical applicability of CRISPR-engineered armored CAR T cells.
a-c. Anti-LeY CAR T cells derived from patients with multiple myeloma were engineered to express Gfp from either the NR4A2 or RGS16 locus and cocultured with OVCAR-3 tumor cells for 72 h before GFP expression was assessed. a. Flow cytometry plots from concatenated technical triplicates. b. Quantification of GFP percentage and c. MFI in CD8+ human CAR T cells, represented as mean ± SD of technical triplicates. d. Anti-LeY CAR T cells derived from patients with diffuse large B cell lymphoma were engineered to express IL-12 from the NR4A2 locus and cocultured with OVCAR-3 or MCF-7 tumor cells for 24 h before cytokine concentration in supernatants was assessed. Concentrations of IFNγ, TNF or IL-2 produced by NR4A2/IL-12 CAR T cells, represented as mean ± SD of technical triplicates. e-f. Murine anti-hHer2 CAR T cells engineered to express Gfp from either the Nr4a2 or Rgs16 locus were cocultured with MC38 tumor cells with varying Her2 expression for 24 h before GFP expression was assessed. e. Histogram overlay showing Her2 expression in MC38 tumor cells. f. Quantification of GFP MFI in CD8+ murine CAR T cells, represented as mean ± SD of technical triplicates. g-h. Human anti-LeY CAR T cells engineered to express Gfp from either the NR4A2 or RGS16 locus were stimulated with varying concentrations of anti-LeY idiotype antibody for 24 h before GFP and CD69 expression were assessed. g. Quantification of GFP MFI and h. CD69 percentage in CD8+ human CAR T cells, represented as mean ± SD of technical triplicates. i-j. Human anti-Her2 CAR T cells were engineered to express Gfp from the NR4A2 locus and assessed in vitro upon stimulation with MDA-MB-231 tumor cells (i) and in mice bearing orthotopic MDA-MB-231 tumors (j). i. Flow cytometry plots from concatenated technical triplicates (left) and quantification of GFP expression represented as mean ± SD of technical triplicates (right) in CD8+ human CAR T cells post 24 h of stimulation. j. Flow cytometry plots representative of n = 4 mice/group in CD8+ human CAR T cells 14 days post transfer. k. OT-3 T cells were engineered to express IL-12 or IL-2 from the Nr4a2 or Rgs16 locus, respectively, and cocultured with AT-3-ova tumor cells for 24 h before cytokine concentration in supernatants was assessed. Concentration of IL-12 (left) or IL-2 (right) produced by NR4A2/IL-12 or RGS16/IL-2 OT-3 T cells, respectively, represented as mean ± SD of technical triplicates. (b-d, f-g, i, k) Two-way ANOVA. n.s. not significant, ****p < 0.0001. Source Data
Extended Data Fig. 12
Extended Data Fig. 12. One-step manufacturing approach for CRISPR-engineered armored CAR T cells.
a-b. Anti-LeY CAR T cells manufactured via retroviral transduction or CRISPR-mediated knock-in to the TRAC locus were engineered to express Gfp from either the NR4A2 or RGS16 locus. a. Flow cytometry plots from concatenated technical triplicates (left) and quantification of CAR expression represented as mean ± SD of technical triplicates (right) in CD8+ human CAR T cells. b. Quantification of GFP expression in CD8+ human CAR T cells upon in vitro stimulation with anti-LeY idiotype antibody, MCF-7 or OVCAR-3 tumor cells for 24 h, represented as mean ± SD of technical triplicates. c-d. Anti-LeY CAR T cells manufactured via CRISPR-mediated knock-in to the TRAC locus were engineered to express IL-12 or IL-2 from the NR4A2 or RGS16 locus, respectively, and assessed upon in vitro stimulation as per (b). c. Concentration of IL-12 or d. IL-2 produced by NR4A2/IL-12 or RGS16/IL-2 CAR T cells, respectively, represented as mean ± SD of technical triplicates. (c-d) Two-way ANOVA. **p < 0.01, ***p < 0.001, ****p < 0.0001. Source Data

References

    1. Albelda, S. M. CAR T cell therapy for patients with solid tumours: key lessons to learn and unlearn. Nat. Rev. Clin. Oncol.10.1038/s41571-023-00832-4 (2023). - PubMed
    1. Majzner, R. G. & Mackall, C. L. Clinical lessons learned from the first leg of the CAR T cell journey. Nat. Med.25, 1341–1355 (2019). - PubMed
    1. Mardiana, S., Solomon, B. J., Darcy, P. K. & Beavis, P. A. Supercharging adoptive T cell therapy to overcome solid tumor–induced immunosuppression. Sci. Transl. Med.11, eaaw2293 (2019). - PubMed
    1. Chmielewski, M. & Abken, H. TRUCKS, the fourth‐generation CAR T cells: current developments and clinical translation. Adv. Cell Gene Ther.10.1002/acg2.84 (2020).
    1. Zhang, L. et al. Tumor-infiltrating lymphocytes genetically engineered with an inducible gene encoding interleukin-12 for the immunotherapy of metastatic melanoma. Clin. Cancer Res.21, 2278–2288 (2015). - PMC - PubMed

MeSH terms

LinkOut - more resources