. 2025 Aug;644(8077):714-721.
doi: 10.1038/s41586-025-09195-5. Epub 2025 Jul 2.

Whole-genome ancestry of an Old Kingdom Egyptian

Affiliations

Whole-genome ancestry of an Old Kingdom Egyptian

Adeline Morez Jacobs et al. Nature. 2025 Aug.

Abstract

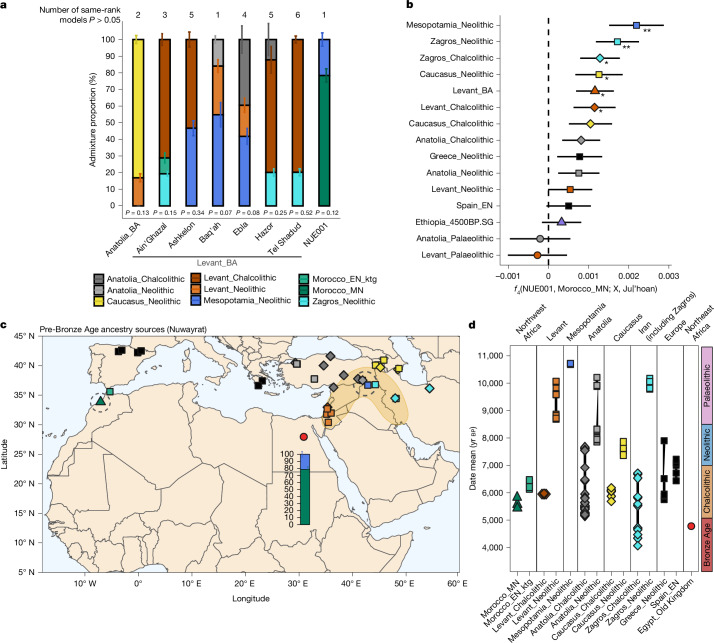
Ancient Egyptian society flourished for millennia, reaching its peak during the Dynastic Period (approximately 3150-30 BCE). However, owing to poor DNA preservation, questions about regional interconnectivity over time have not been addressed because whole-genome sequencing has not yet been possible. Here we sequenced a 2× coverage whole genome from an adult male Egyptian excavated at Nuwayrat (Nuerat, نويرات). Radiocarbon dated to 2855-2570 cal. BCE, he lived a few centuries after Egyptian unification, bridging the Early Dynastic and Old Kingdom periods. The body was interred in a ceramic pot within a rock-cut tomb1, potentially contributing to the DNA preservation. Most of his genome is best represented by North African Neolithic ancestry, among available sources at present. Yet approximately 20% of his genetic ancestry can be traced to genomes representing the eastern Fertile Crescent, including Mesopotamia and surrounding regions. This genetic affinity is similar to the ancestry appearing in Anatolia and the Levant during the Neolithic and Bronze Age2-5. Although more genomes are needed to fully understand the genomic diversity of early Egyptians, our results indicate that contacts between Egypt and the eastern Fertile Crescent were not limited to objects and imagery (such as domesticated animals and plants, as well as writing systems)6-9 but also encompassed human migration.


Conflict of interest statement

Competing interests: The authors declare no competing interests.

Figures

Fig. 1
Fig. 1. Geographic location and date of the Nuwayrat individual in context.
a, Geographic location of the Nuwayrat cemetery (red dot) and the previously sequenced Third Intermediate Period individuals from Abusir el-Meleq (purple diamond). b, Pottery vessel in which the Nuwayrat individual was discovered. c, Cervical vertebrae belonging to the Nuwayrat individual with evidence of extreme osteoarthritis (arrows). d, Summary of genomic and radiocarbon data. See the detailed breakdown of the quality indicators and calibration results for the three replicates and the combined date in Supplementary Table 2. e, Egyptian civilization timeline and radiocarbon date of the Nuwayrat and Third Intermediate Period individuals. mtDNA, mitochondrial DNA. Photo in b reproduced courtesy of the Garstang Museum of Archaeology, University of Liverpool.
Fig. 2
Fig. 2. Genetic ancestry of the Nuwayrat genome.
a, PCA of present-day worldwide populations, with projection of the Old Kingdom Egyptian genome from Nuwayrat (NUE001). b, PCA of present-day populations from North Africa and West Asia, with projection of ancient North African and West Asian genomes. c, ADMIXTURE clustering analysis of the Old Kingdom Egyptian genome in the context of ancient African, West Asian and present-day Egyptian genomes at K = 14 ancestral populations. Only a subset of genomes corresponding to those used in the qpAdm analysis (Fig. 3) are displayed. The full output of the ADMIXTURE analysis is shown in Extended Data Figs. 4 and 5.
Fig. 3
Fig. 3. Ancestry models of the Nuwayrat genome.
a, Ancestry proportion of Nuwayrat and comparative Bronze Age Levantine and Anatolian genomes for the best-fit full model (qpAdm). Alternative same-rank models passing P > 0.05 with a lower P value are shown in Supplementary Table 6. Values represent best-fitting model estimates ± 1 standard error. This analysis was conducted over n = 537,543 SNPs for NUE001, n = 518,994 SNPs for Anatolia_BA, n = 554,622 SNPs for Ain’ Ghazal, n = 493,274 SNPs for Ashkelon, n = 578,969 SNPs for Baq’ah, n = 574,452 SNPs for Ebla, n = 552,505 SNPs for Hazor and n = 513,561 SNPs for Tel Shaddud. b, Estimation of the best source responsible for deviation of the Nuwayrat genome from the Middle Neolithic Morocco group as f4(NUE001, Morocco_MN; Mesopotamia_N, Juǀʼhoan). Symbols represent f4 value ± 1 standard error. *Z score > 2; **Z score > 3. The analysis was conducted over 280,544 SNPs. c,d, Map (c) and timeline (d) of rotating sources used to infer the proximal ancestry of the Nuwayrat and Bronze Age Levantine and Anatolian genomes (shown in a), with the dark-yellow area corresponding to the Fertile Crescent. The timeline in d is based on Egyptian cultural transition dates.
Fig. 4
Fig. 4. Ancestry models of later Egyptians.
a, Ancestry proportions of the Third Intermediate Period genomes for the best-fit model (qpAdm). Alternative two-source and three-source models passing P > 0.05 are reported in Supplementary Table 7. This analysis was conducted over 290,262 SNPs. b, Ancestry proportions of the present-day Egyptian genomes for the best-fit model (qpAdm). For b, alternative two-source and three-source models passing P > 0.05 are reported in Supplementary Table 8. This analysis was conducted over 767,305 SNPs. Values represent best-fitting model estimates ± 1 standard error (a,b). c,d, Map (c) and timeline (d) of rotating sources used to infer the ancestry of the two Third Intermediate Period and/or the present-day Egyptian genomes. The timeline in d is based on Egyptian cultural transition dates. BA, Bronze Age; Chl., Chalcolithic; Hist., historical period; IA, Iron Age; Neo., Neolithic.
Extended Data Fig. 1
Extended Data Fig. 1. Archaeological context at the Nuwayrat site.
a, Rock-cut tombs at Nuwayrat enclosing the pottery vessel containing the pottery coffin burial. b, An impression of the rock-cut tomb based on the archaeologist John Garstang’s description, with the pottery coffin burial in the south burial chamber. c, Pottery coffin and archaeological remains of the Nuwayrat individual, as discovered in 1902. Photos in a and c reproduced courtesy of the Garstang Museum of Archaeology, University of Liverpool.
Extended Data Fig. 2
Extended Data Fig. 2. Facial reconstruction and depiction created from the Nuwayrat individual skull.
a, Final facial depiction of the Nuwayrat individual. b, Virtual fit of the skull and facial reconstruction. c, The Nuwayrat individual’s partially complete skeleton.
Extended Data Fig. 3
Extended Data Fig. 3. Damage patterns at the 5′ end of the reads in each sequencing run from the Nuwayrat individual.
All sequencing runs but one show a significant increase of C-to-T transitions at the 5′ end of DNA fragments, indicative of authentic ancient DNA.
Extended Data Fig. 4
Extended Data Fig. 4. ADMIXTURE clustering analysis of the Old Kingdom Egyptian genome in the context of ancient genomes (K = 3 to 20).
ADMIXTURE was generated on 4,574 present-day and ancient genomes from the ‘HO’ dataset (Supplementary Data Table 3), over 71,202 transversion SNPs. ADMIXTURE output on the present-day genomes are displayed in Extended Data Fig. 5.
Extended Data Fig. 5
Extended Data Fig. 5. ADMIXTURE clustering analysis of the Old Kingdom Egyptian genome in the context of present-day genomes (K = 3 to 20).
ADMIXTURE was generated on 4,574 present-day and ancient genomes from the ‘HO’ dataset (Supplementary Data Table 3), over 71,202 transversion SNPs. ADMIXTURE output on the ancient genomes are displayed in Extended Data Fig. 4.
Extended Data Fig. 6
Extended Data Fig. 6. Distal ancestries in the Nuwayrat genome and contemporary groups.
The model included Epipaleolithic/Neolithic groups from North Africa and West Asia as rotating sources in qpAdm (Morocco_Epipaleolithic, Anatolia_Neolithic, Levant_Neolithic, Zagros_Neolithic, Caucasus_Neolithic). Details of all models passing p > 0.05 are displayed in Supplementary Data Table 5. Values represent best-fitting model estimates ± 1 SE (error bars). This analysis was conducted over n = 515,802 SNPs for NUE001, n = 558,549 SNPs for Morocco_MN, n = 558,847 SNPs for Levant_BA, and n = 558,848 SNPs for Anatolia_BA.
Extended Data Fig. 7
Extended Data Fig. 7. Ancestry modelling of ancient East African genomes with qpAdm.
Best-fit models are represented. Details of all models passing p > 0.05 are described in Supplementary Data Table 12. N, Neolithic; IA, Iron Age; EIA, Early iron Age; LIA, Late Iron Age; LSA, Late Stone Age. Values represent best-fitting model estimates ± 1 SE (error bars). This analysis was conducted over 141,323-350,110 SNPs (see Supplementary Data Table 12).

References

    1. Garstang, J. in The Burial Customs of Ancient Egypt (ed. Garstang, J.) 26–30 (Archibald Constable, 1907).
    1. Lazaridis, I. et al. Ancient DNA from Mesopotamia suggests distinct pre-pottery and pottery Neolithic migrations into Anatolia. Science377, 982–987 (2022). - PMC - PubMed
    1. Skourtanioti, E. et al. Genomic history of Neolithic to Bronze Age Anatolia, Northern Levant, and Southern Caucasus. Cell181, 1158–1175.e28 (2020). - PubMed
    1. Haber, M. et al. Continuity and admixture in the last five millennia of Levantine history from ancient Canaanite and present-day Lebanese genome sequences. Am. J. Hum. Genet.101, 274–282 (2017). - PMC - PubMed
    1. Agranat-Tamir, L. et al. The genomic history of the Bronze Age Southern Levant. Cell181, 1146–1157.e11 (2020). - PMC - PubMed

Publication types

LinkOut - more resources