. 2024 Dec 30;2(1):40.
doi: 10.1038/s44324-024-00043-0.

The effect of high-sugar feeding on rodent metabolic phenotype: a systematic review and meta-analysis

Affiliations

The effect of high-sugar feeding on rodent metabolic phenotype: a systematic review and meta-analysis

Sophie Lucic Fisher et al. NPJ Metab Health Dis. .

Abstract

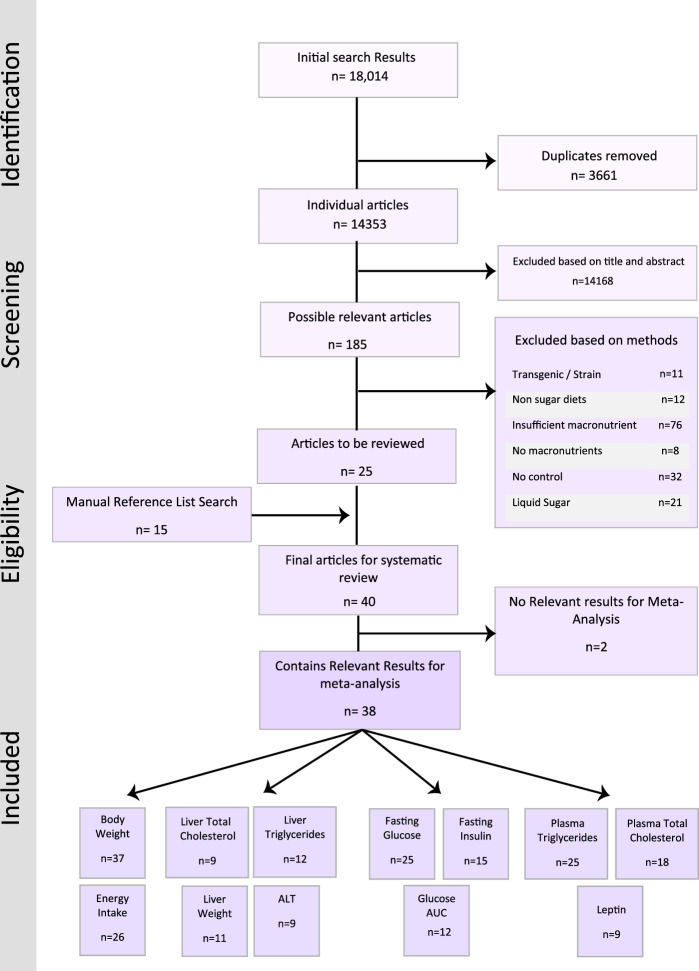
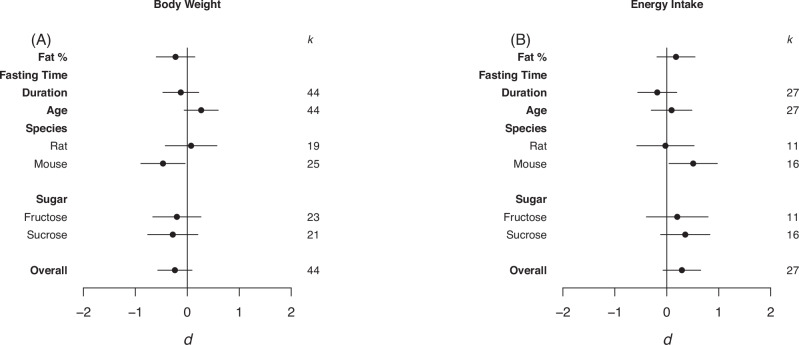
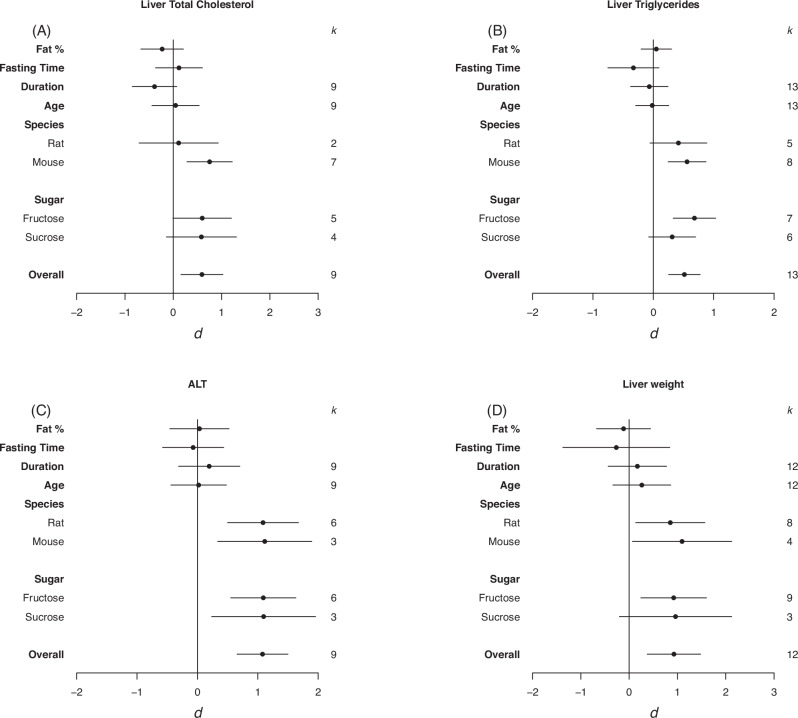
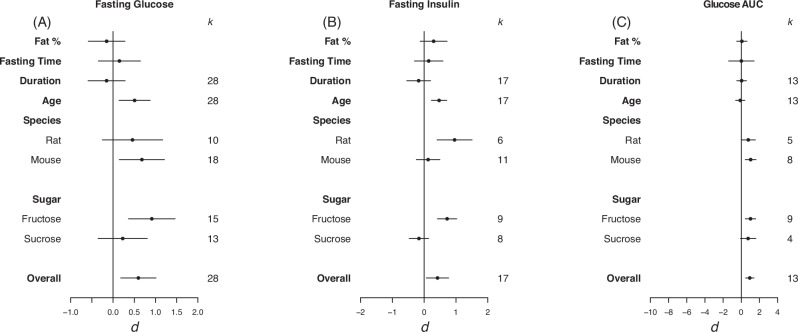
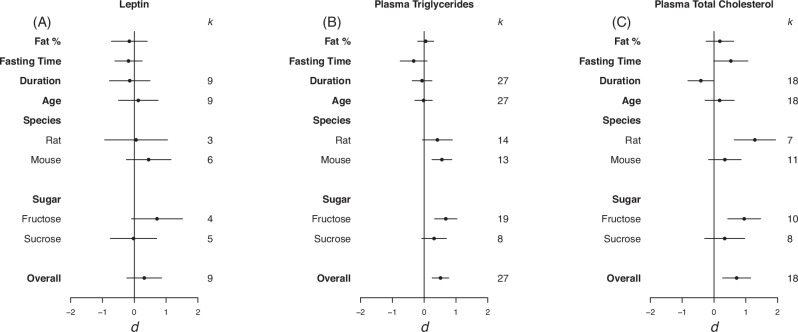
Dietary sugar consumption has been linked to increased cardiometabolic disease risk, although it is unclear if this is independent of increases in body weight and adiposity. Additionally, many preclinical animal studies provide liquid sugar which more readily leads to excess consumption and weight gain, confounding any outcomes driven by high-sugar intake alone. To gain clarity on this, we conducted a systematic review and meta-analysis exclusively investigating the effect of isocaloric high-sugar, low-fat solid diet formulations containing fructose or sucrose, on cardiometabolic health in rodents. Overall, we found strong evidence that fructose and sucrose have effects on metabolic health, independent of body weight gain. High-sugar feeding, with fructose in particular, altered liver phenotype; ALT (d = 1.08; 0.66, 1.5), triglyceride content (d = 0.52; 0.25, 0.78), cholesterol (d = 0.59; 0.16, 1.03) and liver mass (d = 0.93; 0.37, 1.48), and glucose tolerance; fasting glucose (d = 0.60; 0.18, 1.01) and fasting insulin (d = 0.42; 0.07, 0.77) but not body weight or energy intake. Our review also highlights the lack of data reported on adiposity and in female rodents. This is the first meta-analysis to synthesise all current rodent solid diet high-sugar studies, while adjusting them for confounders (fat content, time spent on diet and age started on diet) and suggests that high-sugar dietary intake and composition alters metabolic health of mice regardless of weight gain.


Conflict of interest statement

Competing interests: The authors declare no competing interests.

Figures

Fig. 1
Fig. 1. Flow chart of the study selection process.
A flow chart detailing the number of articles included and excluded throughout the systematic review process. Adapted from Ainge et al. 2011.
Fig. 2
Fig. 2. The effect of high-sugar feeding on body weight and Energy intake.
Forrest plots depicting the effects of high-sugar feeding on (A) Body weight, (B) Energy intake. The effect is quantified as d, the difference between the mean of the treatment and control groups. Positive values indicate a higher mean in the sugar-fed groups compared to the control group (and vice versa). Overall estimates were determined by random‐effects meta‐analysis and species- and sugar-specific effects were determined by random-effects meta-regressions. Estimates for fat as a percentage of diet, fasting time, duration, and age diet was started, correspond to slopes from random‐effects meta‐regression. k is the number of effect sizes on which each estimate is based, and bars correspond to 95% confidence intervals.
Fig. 3
Fig. 3. Effect of high-sugar feeding on total liver cholesterol, liver triglycerides, ALT and Liver weight.
Forrest plots depicting the effects of high-sugar feeding on (A) Liver total cholesterol, (B) Liver triglycerides, (C) ALT, (D) Liver weight. The effect is quantified as d, which are the differences between the means of the treatment and control groups. Positive values indicate a higher mean in the sugar-fed groups compared to the control group (and vice versa). Overall estimates were estimated by random‐effects meta‐analysis and species- and sugar-specific effect were determined by random-effects meta-regressions. Estimates for fat as a percentage of diet, fasting time, duration, and age diet started, correspond to slopes from random‐effects meta‐regression. k is the number of effect sizes on which each estimate is based, and bars correspond to 95% confidence intervals.
Fig. 4
Fig. 4. Effect of high-sugar feeding on fasting glucose, fasting insulin and glucose AUC.
Forrest plots depicting the effects of high-sugar feeding on (A) Fasting glucose, (B) Fasting insulin and (C) Glucose AUC. The effect is quantified as d, which are the difference between the means of the treatment and control groups. Positive values indicate a higher mean in the sugar-fed groups compared to the control group (and vice versa). Overall estimates were estimated by random‐effects meta‐analysis and species- and sugar-specific effect were determined by random-effects meta-regressions. Estimates for fat as a percentage of diet, fasting time, duration, and age that diet was started on correspond to slopes from random‐effects meta‐regression. k is the number of effect sizes on which each estimate is based, and bars correspond to 95% confidence intervals.
Fig. 5
Fig. 5. Effect of high-sugar feeding on Leptin, plasma triglycerides and plasma total cholesterol.
Forrest plots depicting the effects of high-sugar feeding on (A) Leptin, (B) plasma triglycerides and (C) plasma total cholesterol. The effect is quantified as d, which are the difference between the means of the treatment and control groups. Positive values indicate a higher mean in the sugar-fed groups compared to the control group (and vice versa). Overall estimates were estimated by random‐effects meta‐analysis and species- and sugar-specific effect were determined by random-effects meta-regressions. Estimates for fat as a percentage of diet, fasting time, duration, and age diet started, correspond to slopes from random‐effects meta‐regression. k is the number of effect sizes on which each estimate is based, and bars correspond to 95% confidence intervals.

Similar articles

References

    1. Bhurosy, T. & Jeewon, R. Overweight and obesity epidemic in developing countries: a problem with diet, physical activity, or socioeconomic status? ScientificWorldJournal2014, 964236 (2014). - PMC - PubMed
    1. Morris, M. J., Beilharz, J. E., Maniam, J., Reichelt, A. C. & Westbrook, R. F. Why is obesity such a problem in the 21st century? The intersection of palatable food, cues and reward pathways, stress, and cognition. Neurosci. Biobehav. Rev.58, 36–45 (2015). - PubMed
    1. Hariri, N. & Thibault, L. High-fat diet-induced obesity in animal models. Nutr. Res. Rev.23, 270–299 (2010). - PubMed
    1. Speakman, J. R. Use of high-fat diets to study rodent obesity as a model of human obesity. Int. J. Obes.43, 1491–1492 (2019). - PubMed
    1. Wali, J. A. et al. Determining the metabolic effects of dietary fat, sugars and fat-sugar interaction using nutritional geometry in a dietary challenge study with male mice. Nat. Commun.14, 4409 (2023). - PMC - PubMed

LinkOut - more resources