. 2025 Jul;21(7):e70417.
doi: 10.1002/alz.70417.

Gut microbiome compositional and functional features associate with Alzheimer's disease pathology

Affiliations

Gut microbiome compositional and functional features associate with Alzheimer's disease pathology

Jea Woo Kang et al. Alzheimers Dement. 2025 Jul.

Abstract

Background: The gut microbiome is a potentially modifiable risk factor for Alzheimer's disease (AD); however, understanding of its composition and function regarding AD pathology is limited.

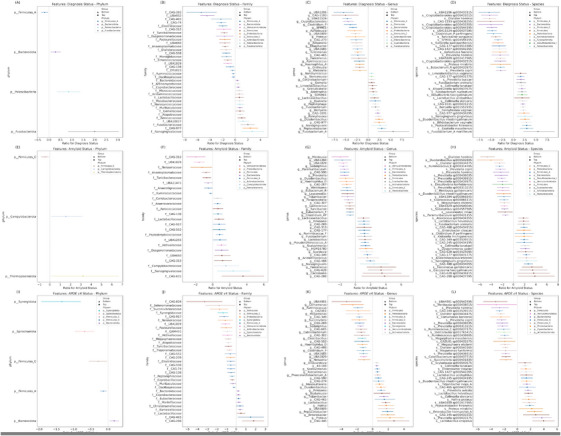
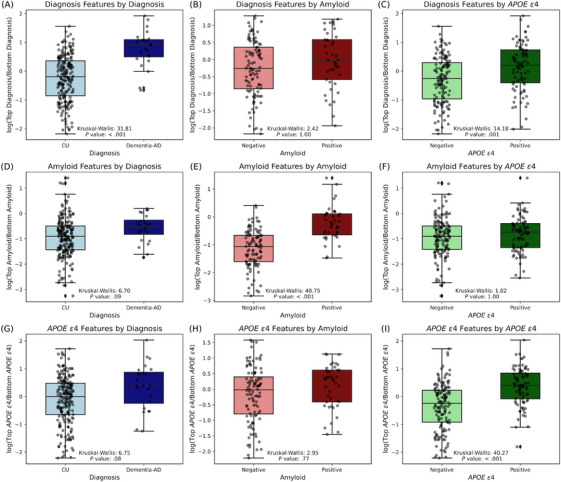
Methods: Shallow-shotgun metagenomics was used to analyze the fecal microbiome of participants in the Wisconsin Microbiome in Alzheimer's Risk Study, leveraging clinical data and cerebrospinal fluid (CSF) biomarkers. Differential abundance and ordinary least squares regression analyses were performed to find differentially abundant gut microbiome features and their associations with CSF biomarkers of AD and related pathologies.

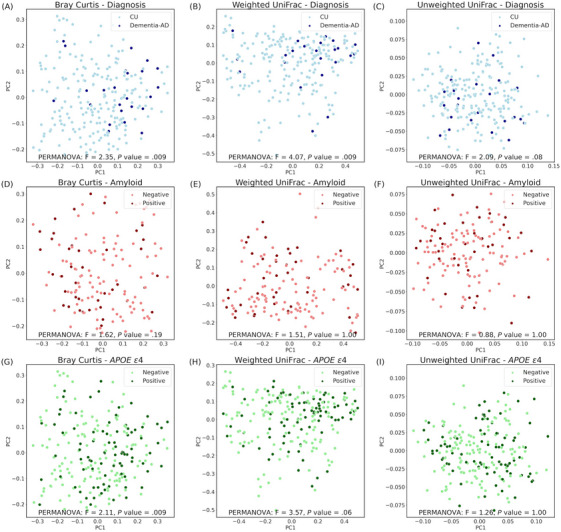
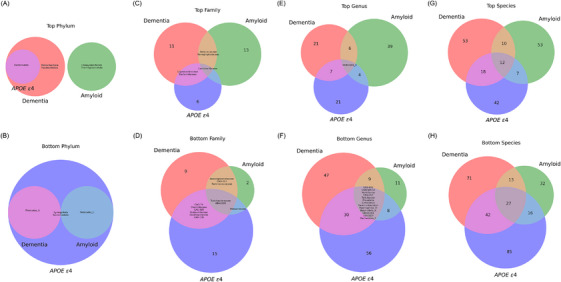
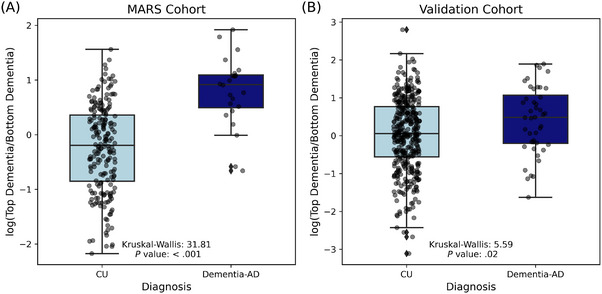
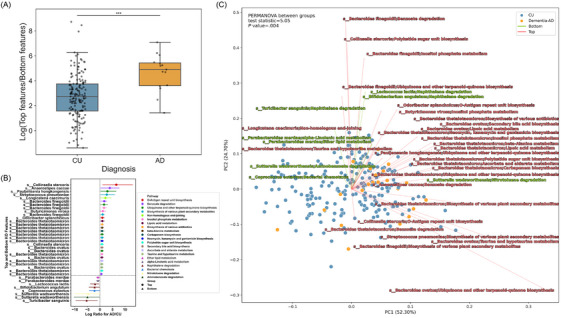
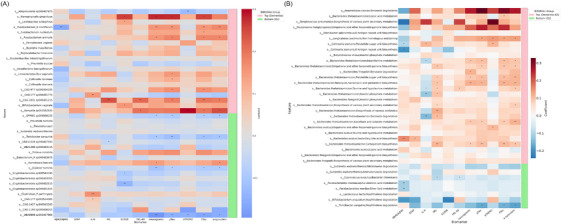
Results: Gut microbiome composition and function differed between individuals with and without AD dementia. The compositional difference was replicated in an independent cohort. Differentially abundant gut microbiome features were associated with CSF biomarkers of AD and related pathologies.

Discussion: These findings enhance our understanding of alterations in gut microbial composition and function in AD, and suggest that gut microbes and their pathways are linked to AD pathology.

Highlights: Gut microbiome composition and function differ between people with Alzheimer's disease (AD) dementia and cognitively unimpaired (CU) individuals. Co-occurring gut microbes show differential abundance across AD-related groups (AD vs CU, amyloid status+ vs amyloid status-, and apolipoprotein E (APOE) ε4 status+ vs APOE ε4 status-). Gut microbiome composition also differs between people with AD dementia and CU individuals in a larger validation cohort. Differentially abundant gut microbiome composition and function between AD and CU groups are correlated with cerebrospinal fluid biomarkers for AD and related pathologies.

Keywords: Alzheimer's disease; biomarkers; cerebrospinal fluid; composition; differential abundance; function; gut microbiome; pathology.


Conflict of interest statement

Dr. Kaddurah‐Daouk is an inventor of a series of patents on use of metabolomics for the diagnosis and treatment of central nervous system (CNS) diseases and holds equity in Metabolon Inc., Chymia LLC, and PsyProtix. Dr. Rob Knight is a scientific advisory board member and consultant for BiomeSense, Inc., and has equity and receives income. He is a scientific advisory board member and has equity in GenCirq. He is a consultant for DayTwo, and receives income. He has equity in and acts as a consultant for Cybele. He is a co‐founder of Biota, Inc., and has equity. He is a cofounder of Micronoma, and has equity and is a scientific advisory board member. The terms of these arrangements have been reviewed and approved by the University of California San Diego in accordance with its conflict of interest policies. Dr. Zetterberg has served on scientific advisory boards and/or as a consultant for Abbvie, Acumen, Alector, Alzinova, ALZPath, Amylyx, Annexon, Apellis, Artery Therapeutics, AZTherapies, Cognito Therapeutics, CogRx, Denali, Eisai, LabCorp, Merry Life, Nervgen, Novo Nordisk, Optoceutics, Passage Bio, Pinteon Therapeutics, Prothena, Red Abbey Labs, reMYND, Roche, Samumed, Siemens Healthineers, Triplet Therapeutics, and Wave; has given lectures in symposia sponsored by Alzecure, Biogen, Cellectricon, Fujirebio, Lilly, Novo Nordisk, and Roche; and is a co‐founder of Brain Biomarker Solutions in Gothenburg AB (BBS), which is a part of the GU Ventures Incubator Program (outside submitted work). Daniel McDonald is a consultant for, and has equity in, BiomeSence, Inc. The terms of this arrangement has been reviewed and approved by the University of California San Diego in accordance with its conflict of interest policies. All other authors have no conflicts of interest to disclose beyond those listed. Author disclosures are available in the Supporting Information.

Figures

FIGURE 1
FIGURE 1
Beta diversity metrics across AD‐related groups. (A–C) Differences in beta diversity metrics (Bray–Curtis, Weighted UniFrac, and Unweighted UniFrac, respectively) for individuals categorized by clinical diagnosis (CU vs AD dementia). (D–F) Metrics for amyloid status (negative vs positive). (G–I) Metrics across APOE ε4 status (negative vs positive). PC1 and PC2 axes represent the most variance in data. Each plot is color‐coded by the respective group, highlighting the spatial distribution and clustering based on the dissimilarity indices. PERMANOVA was used to determine statistical significance. All p‐values are Bonferroni test corrected. AD, Alzheimer's disease; CU, cognitively unimpaired; APOE, apolipoprotein E; PCs, principal coordinate; PERMANOVA, permutational multivariate analysis of variance.
FIGURE 2
FIGURE 2
DA across AD‐related groups. Forest plots illustrate the DA of microbial features associated with AD‐related groups. (A–D) Contrasts in the abundance of various bacterial taxa at the (A) phylum, (B) family, (C) genus, and (D) species levels between AD dementia and CU. (E–H) The differences in abundance at these taxonomic levels between A+ and A− individuals. (I–L) The microbial features differentially abundant between the APOE ε4+ and APOE ε4− groups. The x‐axes quantify the log ratio of presence between groups, with values above 1 indicating a higher abundance in the first‐mentioned group. Circles denote “Top” features, indicating a positive association with AD‐related groups (dementia diagnosis, amyloid positivity, and APOE ε4 positivity), whereas triangles denote “Bottom” features, indicating a negative association. The lines are color‐coded by unique phylum as labeled in the legend. DA analysis was conducted using BIRDMAn. A, amyloid status; AD, Alzheimer's disease; APOE, apolipoprotein E; BIRDMAn, Bayesian Inferential Regression for Differential Microbiome Analysis; DA, differential abundance; CU, cognitively unimpaired.
FIGURE 3
FIGURE 3
Comparative analysis of Top and Bottom features across AD‐related groups. Box plots comparing the distribution of log‐transformed ratios of differentially abundant microbial species in relation to diagnosis, amyloid status, and APOE ε4 status. (A–C) The log‐transformed ratios of microbes for diagnosis groups (AD vs CU). (D–F) The log‐transformed ratios of amyloid‐related microbes (A+ vs A−). (G–I) The log‐transformed ratios of APOE ε4‐related microbes (APOE ε4+ vs APOE ε4−). Each column compares the CU and AD groups (A, D, and G), A+ and A− groups (B, E, and H), and APOE ε4+ and APOE ε4− groups (C, F, and I). Each panel includes a Kruskal–Wallis test statistic and associated p‐value with correction using the Bonferroni method, indicating the statistical significance of the differences observed. A, amyloid status; AD, Alzheimer's disease; APOE, apolipoprotein E; CU, cognitively unimpaired.
FIGURE 4
FIGURE 4
Venn diagram of co‐occurrence of microbial features across AD‐related groups. The diagrams on the first row (A, C, E, and G) depict the Top (positively‐associated) differentially abundant features, whereas those on the second row (B, D, F, and H) show the Bottom (negatively‐associated) differentially abundant features. (A and B) Top and Bottom microbial phyla, respectively. These diagrams identify unique and shared phyla associated with each of the three AD‐related groups (AD diagnosis, amyloid presence, and APOE ε4 presence). (C and D) Top and Bottom microbial families, respectively. These diagrams highlight the family‐level microbial differences that correlate with AD‐related groups. (E and F) Top and Bottom microbial genera, respectively. These diagrams provide insight into the genus‐level microbial composition influenced by the specified AD‐related groups. (G and H) Top and Bottom microbial species, respectively. These diagrams detail the number of species that are unique and shared across the three AD‐related groups. Each diagram contains colored regions representing intersections between the groups: Red for dementia, green for amyloid, and blue for APOE ε4. The numbers within each segment of the diagrams indicate the count of microbial features unique to or shared between the conditions. Specific microbial features are listed in Table S2. AD, Alzheimer's disease; APOE, apolipoprotein E.
FIGURE 5
FIGURE 5
Comparison of log‐transformed ratios of differentially abundant microbial features in CU and AD dementia across two cohorts. (A) Results from the MARS cohort. Box plots show the distribution of log‐transformed ratios of Top (features enriched in AD dementia relative to CU)  to Bottom (features depleted in AD dementia relative to CU) microbial features in the MARS cohort for CU individuals (light blue) and AD dementia (dark blue) (Kruskal–Wallis = 31.81, p < 0.001). (B) The results from a larger validation cohort (n = 448). Box plots present the distribution of log‐transformed ratios of Top to Bottom microbial features found in the AGMP cohort for CU individuals (light blue) and people with AD dementia (dark blue) (Kruskal–Wallis = 5.59, p = 0.02). Each point represents an individual sample, with the boxes indicating the IQR and the whiskers extending to 1.5 times the IQR. The horizontal line within each box denotes the median value. AD, Alzheimer's disease; AGMP, Alzheimer Gut Microbiome Project; CU, cognitively unimpaired; IQR, interquartile range; MARS, Microbiome in Alzheimer's Risk Study.
FIGURE 6
FIGURE 6
Differentially abundant microbial pathways between AD and CU. (A) The distribution of the log ratios of Top/Bottom pathway features between AD (orange) and CU (blue) was shown in a box plot. Mann–Whitney U test was performed to determine statistical significance. Asterisks indicate a significant difference between AD (4.90) and CU (2.74) groups in the median of the log ratios of Top/Bottom pathway features (p < 0.001). (B) A total of 36 differentially abundant features of microbial species and their corresponding pathways between AD and CU were displayed in a forest plot. Circles denote “Top” features, indicating a positive association with AD, whereas triangles denote “Bottom” features, indicating a negative association. The lines are color‐coded by unique species and their corresponding pathways. DA analysis was conducted using BIRDMAn. (C) RPCA on the clinical diagnosis group and a biplot of microbiome pathway features and their corresponding species. Each point represents an individual sample color‐coded by the respective group, with CU colored in blue and AD colored in orange. Vectors represent the direction (arrows) and magnitude (length) of the contribution of feature variables to the PCs. Vectors in red indicate Top features and vectors in green indicate Bottom features. PC1 and PC2 axes represent the most variance in data. Statistical analysis on RPCA was performed with PERMANOVA between AD and CU groups and the p value from the analysis was adjusted for multiple comparisons. AD, Alzheimer's disease; CU, cognitively unimpaired; DA, differential abundance; BIRDMAn, Bayesian Inferential Regression for Differential Microbiome Analysis; PCs, principal components; PERMANOVA, permutational multivariate analysis of variance; RPCA, robust aitchison principal component analysis.
FIGURE 7
FIGURE 7
Heatmap illustrates the associations between gut microbiome compositional and functional features and CSF biomarkers in AD and related pathologies. (A) This heatmap represents the coefficients of regression analysis between the Top and Bottom 20 gut microbial species linked to dementia and CSF biomarkers in two groups: Top (more abundant in AD, denoted by the pink bar) and Bottom (less abundant in AD, denoted by the green bar). The color scale indicates the strength and direction of the associations, with red representing positive associations and blue representing negative associations. The intensity of the color corresponds to the magnitude of the coefficient. Listed on the left are the gut microbiome species that were identified as more or less abundant in AD through BIRDMAn. (B) The heatmap depicts the coefficients of regression analysis between the gut microbial pathways and CSF biomarkers. Coefficients are scaled by colors indicating the strength and direction of the associations, with red representing positive associations and blue representing negative associations. The intensity of the color corresponds to the magnitude (strength) of the coefficient. Microbial species and their associated pathway features are listed on the left of the plot and two groups (Top: more abundant in AD, denoted by the light pink bar; and Bottom: less abundant in AD or more abundant in CU, denoted by the light green bar) from DA analysis using BIRDMAn are displayed on the right of the plot. For both plots, the biomarkers listed along the bottom include amyloid pathology (Aβ42/Aβ40), tau pathophysiology (p‐tau181 and t‐tau), neurodegeneration (NfL), synaptic dysfunction and injury (neurogranin and α‐synuclein), inflammation (IL‐6), and glial activation (S100B, GFAP, YKL‐40, and sTREM2). It should be noted that a lower Aβ42/Aβ40 ratio is associated with a higher risk of having AD pathology, whereas higher levels of the rest of the CSF biomarkers are associated with a higher risk of having AD pathology. Asterisks indicate the level of statistical significance of the associations: ***p < 0.001, **p < 0.01, and *p < 0.05 (​​uncorrected). Aβ, amyloid beta; AD, Alzheimer's disease; BIRDMAn, Bayesian Inferential Regression for Differential Microbiome Analysis; CSF, cerebrospinal fluid; CU, cognitively unimpaired; DA, differential abundance; GFAP, glial fibrillary acidic protein; IL, interleukin; NfL, neurofilament light protein; p‐tau, phosphorylated‐tau; S100B, S100 calcium binding protein B; sTREM2, soluble triggering receptor expressed on myeloid cells 2; t‐tau, total‐tau; YKL‐40, chitinase‐3‐like protein 1.

Update of

Similar articles

Cited by

  • Fecal Short-Chain Fatty Acids Vary by Sex and Amyloid Status.
    Kuehn JF, Zhang Q, Heston MB, Kang JW, Harding SJ, Davenport-Sis NJ, Peter DC, Kerby RL, Vemuganti V, Schiffmann EC, Tallon MM, Harpt J, Hajra A, Wheeler JL, Shankar S, Mickol A, Zemberi J, Chow H, Zhang E, Clements E, Noughani H, Forst A, Everitt G, Kollmorgen G, Quijano-Rubio C, Christian BT, Carlsson CM, Johnson SC, Asthana S, Zetterberg H, Blennow K, Ulland TK, Rey FE, Bendlin BB. Kuehn JF, et al. medRxiv [Preprint]. 2025 Aug 1:2025.07.31.25332523. doi: 10.1101/2025.07.31.25332523. medRxiv. 2025. PMID: 40766136 Free PMC article. Preprint.

References

    1. Sonnenburg JL, Bäckhed F. Diet–microbiota interactions as moderators of human metabolism. Nature. 2016;535(7610):56‐64. doi: 10.1038/nature18846 - DOI - PMC - PubMed
    1. Desai MS, Seekatz AM, Koropatkin NM, et al. A dietary fiber‐deprived gut microbiota degrades the colonic mucus barrier and enhances pathogen susceptibility. Cell. 2016;167(5):1339‐1353. doi: 10.1016/j.cell.2016.10.043 - DOI - PMC - PubMed
    1. Lee WJ, Hase K. Gut microbiota–generated metabolites in animal health and disease. Nat Chem Biol. 2014;10(6):416‐424. doi: 10.1038/nchembio.1535 - DOI - PubMed
    1. Vogt NM, Kerby RL, Dill‐McFarland KA, et al. Gut microbiome alterations in Alzheimer's disease. Sci Rep. 2017;7:13537. doi: 10.1038/s41598-017-13601-y - DOI - PMC - PubMed
    1. Zhuang ZQ, Shen LL, Li WW, et al. Gut microbiota is altered in patients with Alzheimer's disease. J Alzheimers Dis. 2018;63(4):1337‐1346. doi: 10.3233/JAD-180176 - DOI - PubMed

Grants and funding