

Effects of different doses of microcystin-LR exposure on gut development and the microbiota of Xenopus laevis tadpoles
- PMID: 40604410
- PMCID: PMC12220178
- DOI: 10.1186/s12866-025-04085-2
Effects of different doses of microcystin-LR exposure on gut development and the microbiota of Xenopus laevis tadpoles
Abstract
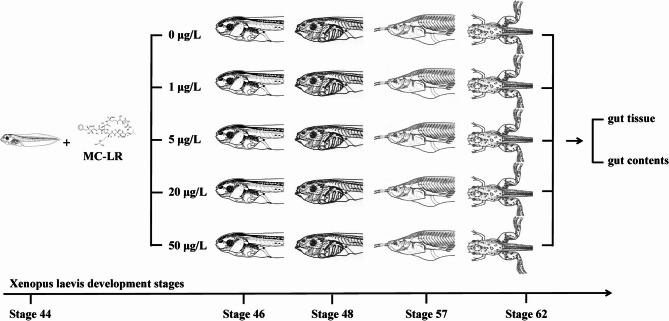
Background: Although the acute toxicity of microcystin-LR has been widely confirmed, its effects on aquatic organisms at environmental concentrations have not been systematically studied. To reveal the effects of microcystin-LR on gut development and the microbiota of tadpoles, Xenopus laevis tadpoles were exposed to 0, 1, 5, 20, and 50 µg/L of microcystin-LR for 1, 7, 49, and 70 days (d) and the results were analyzed using histopathology, reverse transcription-quantitative polymerase chain reaction, and 16 S rRNA amplicon sequencing.
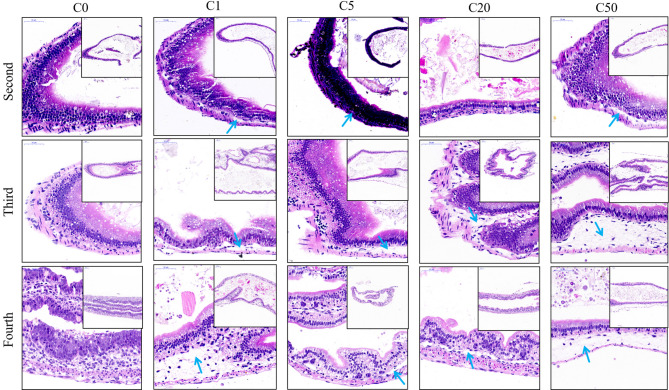
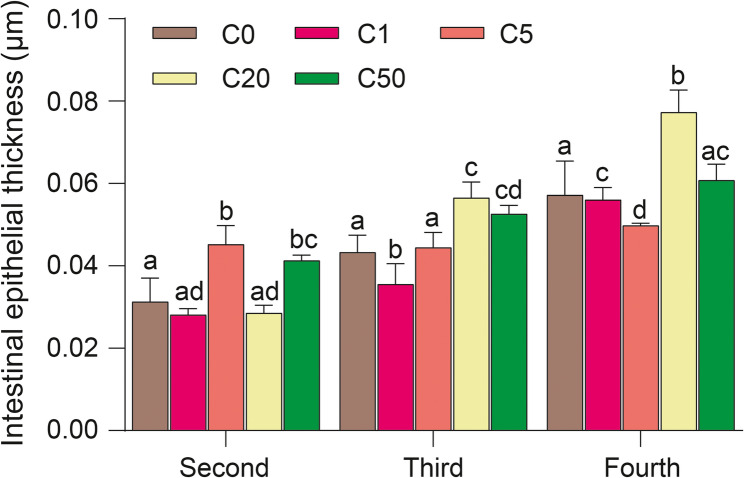
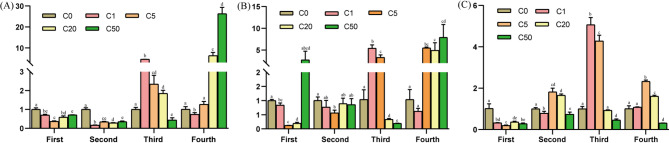
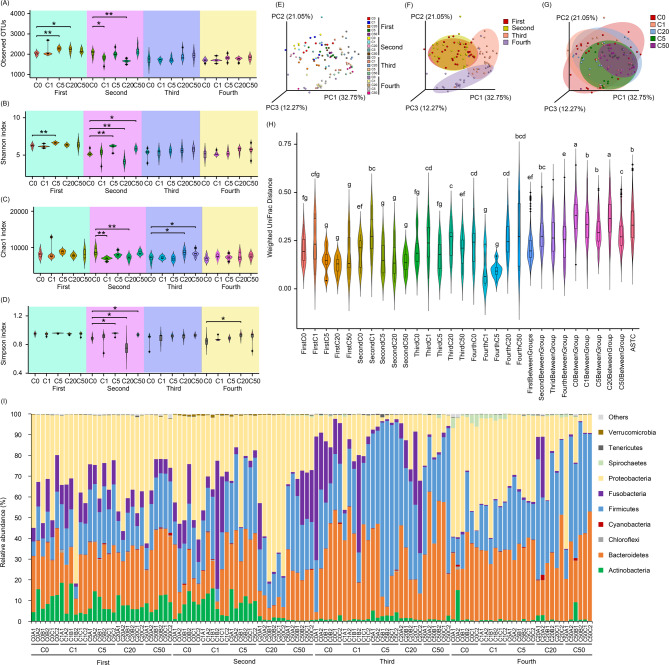
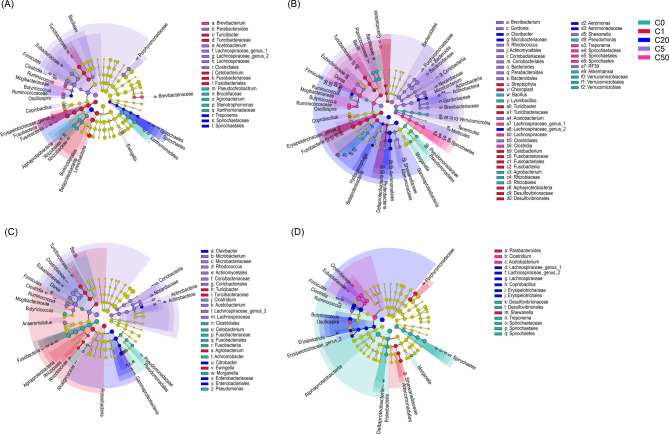
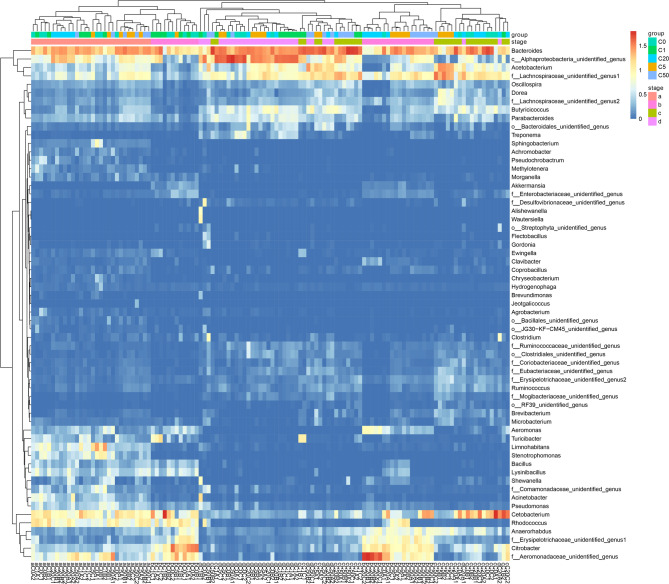
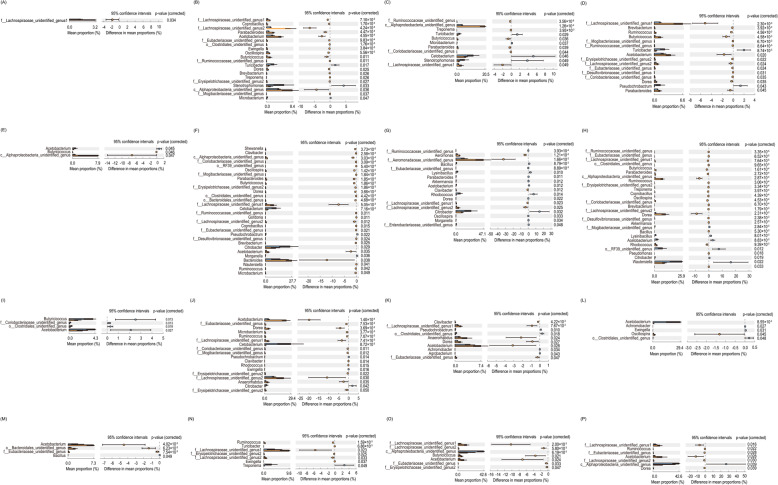
Results: Exposure to 5 µg/L microcystin-LR caused damage to the intestinal integrity and development of tadpoles, with the severity of damage increasing with higher concentrations. High concentrations of microcystin-LR (≥ 20 µg/L) significantly increased intestinal epithelial thickness over 49 d. Additionally, exposure to different concentrations of microcystin-LR had varying effects on the expression of TNF-α, IL-8, and TGF-β in the intestine, and microcystin-LR exposure at 50 µg/L continuously inhibited the expression of TGF-β. The relative abundances of Actinobacteria and Spirochaetes changed with sampling stages. In the samples taken at 49 d, Firmicutes and Tenericutes were significantly more abundant than in other samples, whereas Proteobacteria were significantly less abundant (p < 0.05). Microcystin-degrading Microbacterium, Bacillus, Pseudomonas, and Acinetobacter were the dominant bacteria in the gut microbiota.
Conclusion: These results suggested that exposure to different concentrations of microcystin-LR caused changes in the gut microbiota, potentially affecting the metabolism of microcystin-LR, and ultimately impacting the toxicity of microcystin-LR in X. laevis development.
Keywords: Xenopus laevis; Gut microbiota; Intestinal development; Metamorphosis; Microcystin.
Conflict of interest statement
Declarations. Ethics approval and consent to participate: The study was reviewed and approved by the Biological and Medical Ethics Committee of Qilu Normal University. Consent for publication: Not applicable. Competing interests: Lei Huang, and Hanping Pan are employees of Guangdong Meilikang Bio-Science Ltd., China. The rest of the authors declare to have no competing interest.
Figures
Similar articles
-
Impact of Microcystin-LR exposure on biochemical responses, transcriptomic profiles, gut microbiota, and growth performance in grass carp (Ctenopharyngodon idella).J Environ Sci (China). 2025 Nov;157:850-865. doi: 10.1016/j.jes.2024.11.027. Epub 2024 Dec 3. J Environ Sci (China). 2025. PMID: 40602929
-
Subchronic Toxicity of Microcystin-LR on Young Frogs (Xenopus laevis) and Their Gut Microbiota.Front Microbiol. 2022 May 12;13:895383. doi: 10.3389/fmicb.2022.895383. eCollection 2022. Front Microbiol. 2022. PMID: 35633706 Free PMC article.
-
Evaluating potential developmental toxicity of perfluoroalkyl and polyfluoroalkyl substances in Xenopus laevis embryos and larvae.J Appl Toxicol. 2024 Jul;44(7):1040-1049. doi: 10.1002/jat.4599. Epub 2024 Mar 26. J Appl Toxicol. 2024. PMID: 38531109 Free PMC article.
-
Research progress of microcystin-LR toxicity to the intestine, liver, and kidney and its mechanism.Environ Int. 2025 Jul;201:109547. doi: 10.1016/j.envint.2025.109547. Epub 2025 May 29. Environ Int. 2025. PMID: 40460709 Review.
-
Thyroid hormone receptor subtype-specific function in controlling organ-specific developmental timing and rate during Xenopus development.Front Endocrinol (Lausanne). 2025 Jun 9;16:1614439. doi: 10.3389/fendo.2025.1614439. eCollection 2025. Front Endocrinol (Lausanne). 2025. PMID: 40551888 Free PMC article. Review.
References
-
- Ho JC, Michalak AM, Pahlevan N. Widespread global increase in intense lake phytoplankton blooms since the 1980s. Nature. 2019;574(7780):667–70. 10.1038/s41586-019-1648-7. - PubMed
-
- Qin B, Paerl HW, Brookes JD, Liu J, Jeppesen E, Zhu G, Zhang Y, Xu H, Shi K, Deng J. Why lake Taihu continues to be plagued with cyanobacterial blooms through 10 years (2007–2017) efforts. Sci Bull. 2019;64(6):354–6. 10.1016/j.scib.2019.02.008. - PubMed
-
- Huang C, Wang X, Yang H, Li Y, Wang Y, Chen X, Xu L. Satellite data regarding the eutrophication response to human activities in the plateau lake dianchi in China from 1974 to 2009. Sci Total Environ. 2014;485–6. 10.1016/j.scitotenv.2014.03.031. - PubMed
-
- Michalak AM, Anderson EJ, Beletsky D, Boland S, Bosch NS, Bridgeman TB, Chaffin JD, Cho K, Confesor R, Daloğlu I, DePinto JV, Evans MA, Fahnenstiel GL, He L, Ho JC, Jenkins L, Johengen TH, Kuo KC, LaPorte E, Liu X, McWilliams MR, Moore MR, Posselt DJ, Richards RP, Scavia D, Steiner AL, Verhamme E, Wright DM, Zagorski MA. Record-setting algal bloom in Lake Erie caused by agricultural and meteorological trends consistent with expected future conditions. Proceeding of the National Academy of Sciences of the United States of America, 2013, 110(16): 6448–6452. 10.1073/pnas.1216006110 - PMC - PubMed
-
- Chen L, Giesy JP, Adamovsky O, Svirčev Z, Meriluoto J, Codd GA, Mijovic B, Shi T, Tuo X, Li S-C, Pan B-Z, Chen J, Xie P. Challenges of using blooms of Microcystis spp. In animal feeds: A comprehensive review of nutritional, toxicological and microbial health evaluation. Sci Total Environ. 2021;764:142319. 10.1016/j.scitotenv.2020.142319. - PubMed
Grants and funding
LinkOut - more resources
Full Text Sources
