. 2025 Jul 2;25(1):804.
doi: 10.1186/s12870-025-06784-4.

Jasmonic acid-mediated cell wall biosynthesis pathway involved in pepper (Capsicum annuum) defense response to Ralstonia solanacearum

Affiliations

Jasmonic acid-mediated cell wall biosynthesis pathway involved in pepper (Capsicum annuum) defense response to Ralstonia solanacearum

Xinwei Jiang et al. BMC Plant Biol. .

Abstract

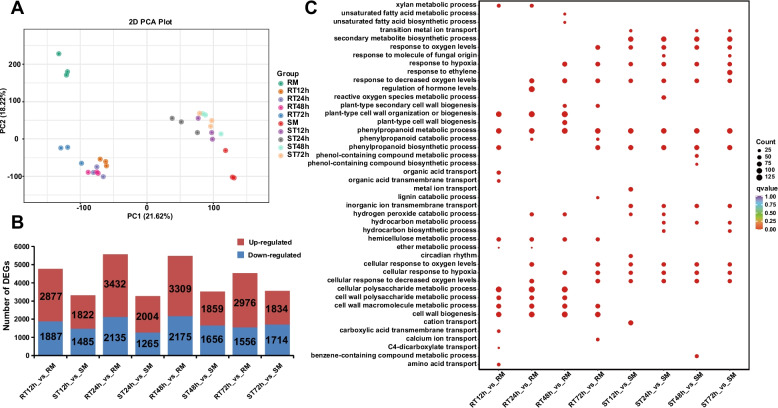
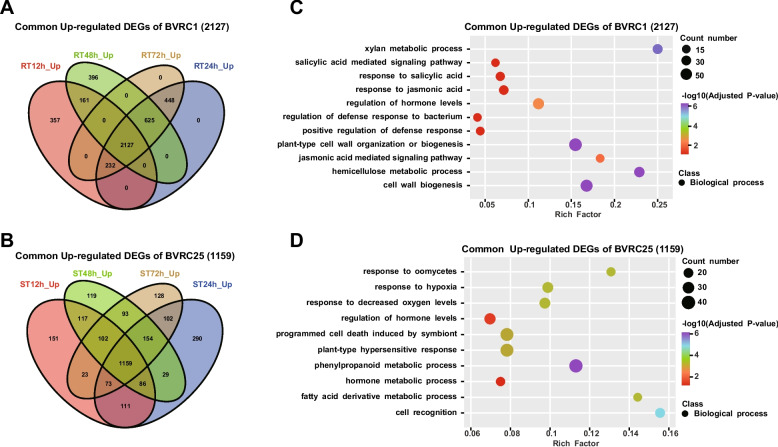
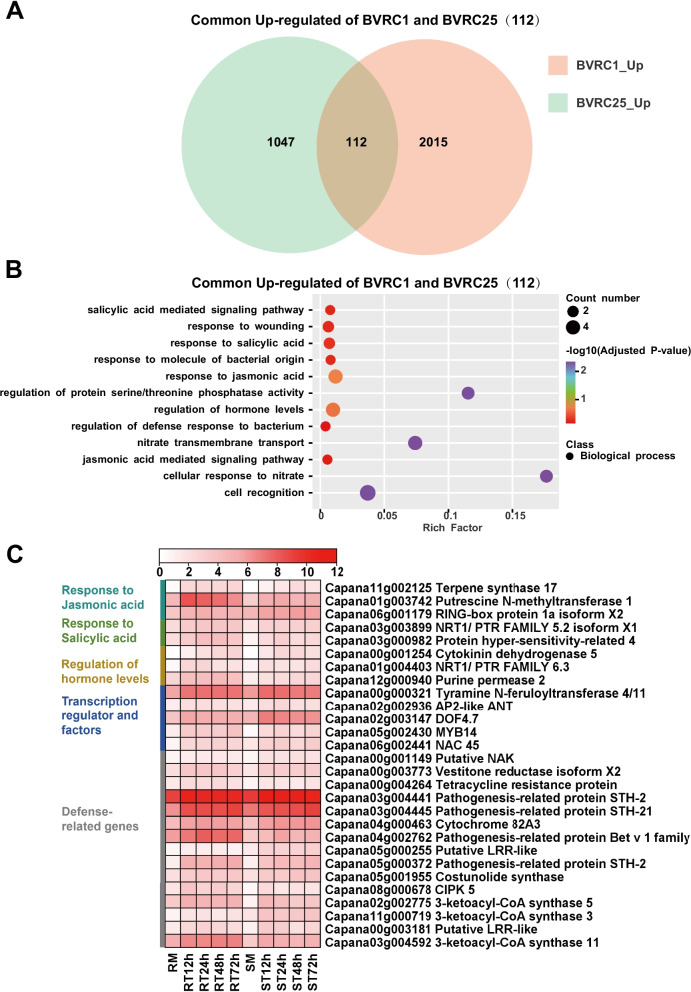
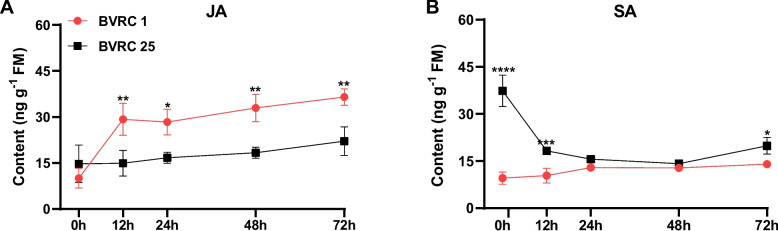
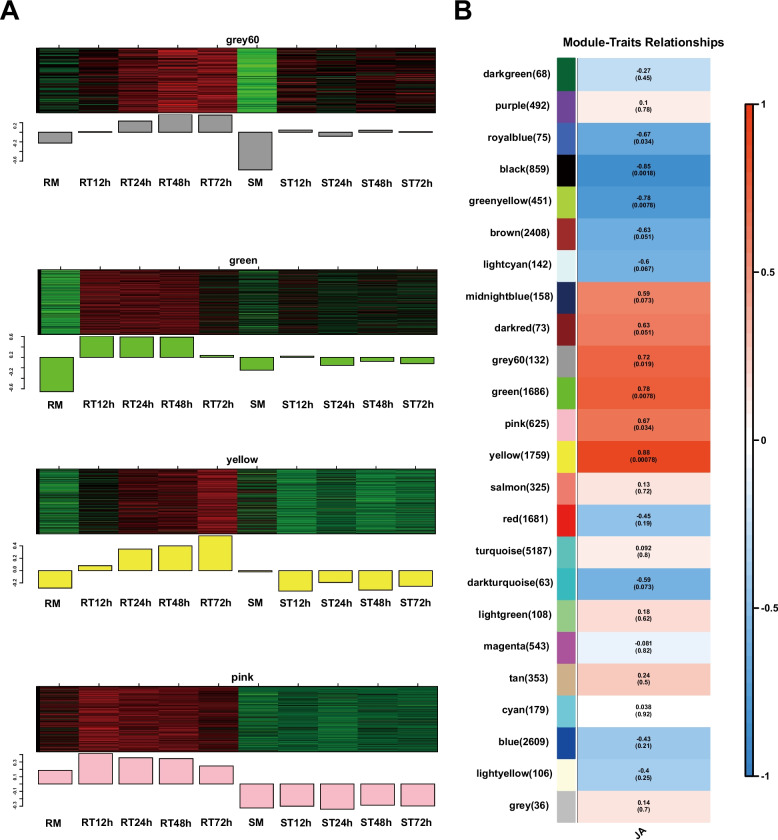
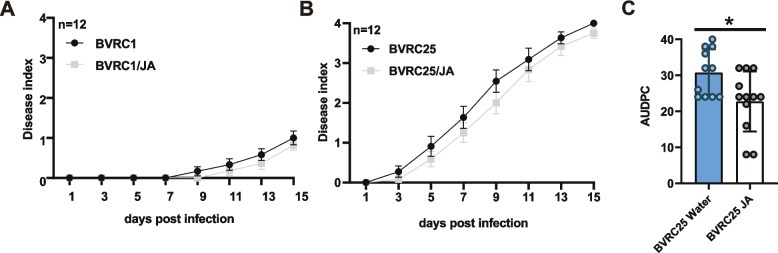
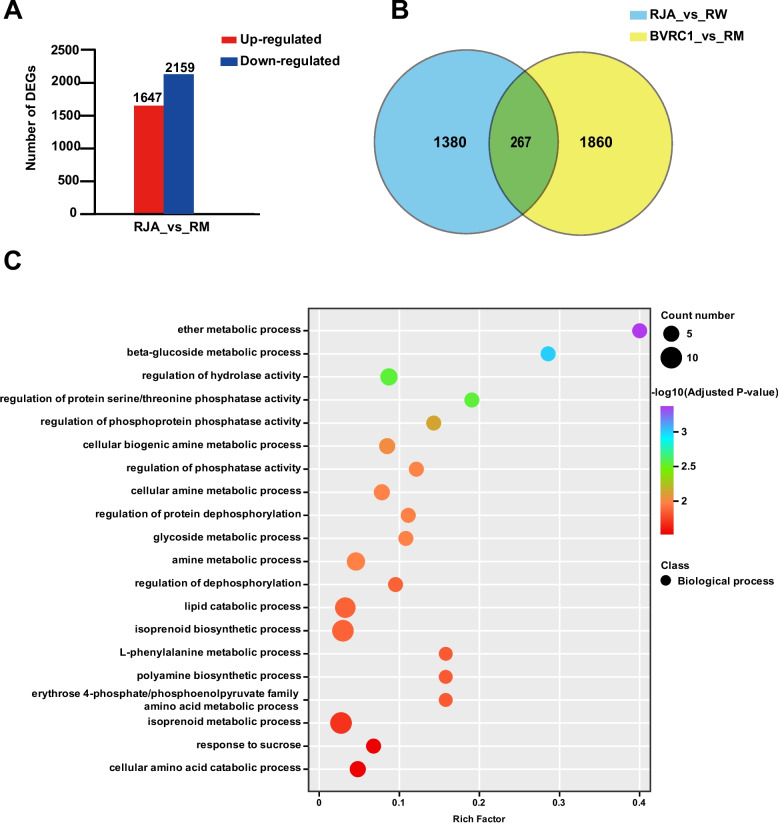
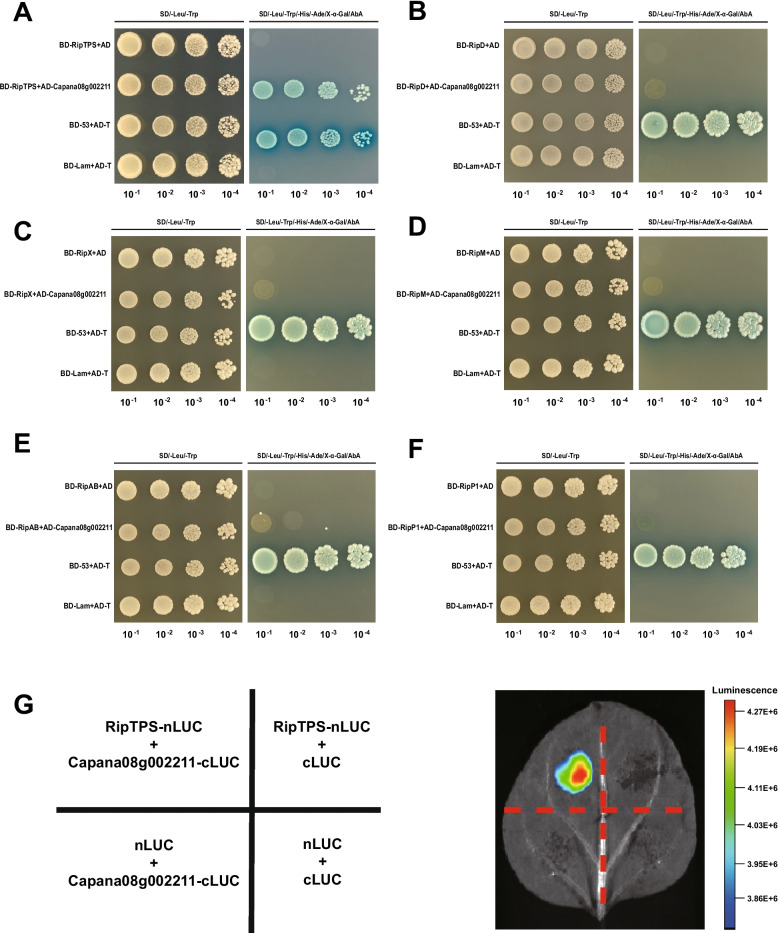
Ralstonia solanacearum is a destructive soil-borne pathogen that causes severe bacterial wilt (BW) disease in peppers. Phytohormone signaling pathways, including those mediated by jasmonic acid (JA), are crucial to plant defense responses against pathogen attacks. Nevertheless, the function of JA in the resistance response of pepper to R. solanacearum is unclear. Therefore, RNA sequencing (RNA-seq) and phytohormone determination experiments were performed to compare the dynamic transcriptome changes and differences in JA and salicylic acid (SA) contents between the resistant pepper line BVRC1 and the susceptible pepper line BVRC25 during R. solanacearum infection. The number of differentially expressed genes (DEGs) was greater in BVRC1 than in BVRC25 at 12, 24, 48, and 72 h post-infection. JA concentrations were also markedly elevated in BVRC1 in response to R. solanacearum. Four distinct co-expression modules and hub genes were identified using weighted gene co-expression network analysis. Exogenous application of JA significantly delayed the onset of R. solanacearum infection and reduced symptom severity in BVRC25. RNA-seq was performed on the resistant pepper line BVRC1 at 24 h post exogenous JA application. GO analysis revealed DEGs enriched in the cell wall biosynthesis-related pathway of BVRC1 after JA treatment. Notably, a pathogenesis-related protein, Capana08g002211, exhibited common up-regulated patterns in response to JA treatment and R. solanacearum infection. A yeast-2-hybrid assay and luciferase complementation imaging assay demonstrated that Capana08g002211 interacted with type III effector (RipTPS). These results demonstrate that the pepper JA-mediated cell wall synthesis pathway participates in the defense response to R. solanacearum.

Keywords: Capsicum annuum; Ralstonia solanacearum; Bacterial wilt; Jasmonic acid (JA); Transcriptome; Weighted gene co-expression network analysis (WGCNA).


Conflict of interest statement

Declarations. Clinical trial number: Not applicable. Ethics approval and consent to participate: Not applicable. Consent for publication: Not applicable. Competing interests: The authors declare no competing interests.

Figures

Fig. 1
Fig. 1
Characterization of differentially expressed genes (DEGs) in the pepper (Capsicum annuum) lines BVRC1 and BVRC25 at 12, 24, 48, and 72 h post-inoculation with Ralstonia solanacearum strain Rs-SY1. A Principal component analysis (PCA) plot of all genes identified in BVRC1 and BVRC25. B Number of up and downregulated DEGs between BVRC1 or BVRC25 and mock inoculation. Dot plots showing GO term enrichment for DEGs. The enriched biological processes C are displayed. The X axis corresponds to upregulated genes 12, 24, 48, and 72 h post-infection (hpi) in BVRC1 and BVRC25, and the Y axis represents the GO terms. The size and color of the dots correspond to the number of DEGs associated with the GO terms and pathways. The qvalue, the P-values of the hypergeometric test, and a smaller Qvalue indicate more significant enrichment. RT, BVRC1 inoculated with R. solanacearum Rs-SY1; ST, BVRC25 inoculated with R. solanacearum Rs-SY1; RM, BVRC1 control-inoculated with sterile water at 12 h; and SM, BVRC25 control-inoculated with sterile water at 12 h. Three biological replicates at each time point were used for RNA-sequencing analysis. DEGs were selected based on P-adjust < 0.05 and |log2 FC|≥ 1 cut-offs
Fig. 2
Fig. 2
Analysis of DEGs in two pepper lines (BVRC1 and BVRC25) after inoculation with R. solanacearum. Venn analysis of upregulated DEGs in the A disease-resistant pepper line BVRC1 and B disease-susceptible pepper line BVRC25 at 12, 24, 48, and 72 h post-inoculation with R. solanacearum. Dot plots showing GO term enrichment for DEGs. The enriched biological processes in C BVRC1 and D BVRC25 are displayed. The x-axis represents the rich factor. The y-axis represents the GO terms. The size and color of the dots correspond to the number of DEGs associated with the GO terms and pathways. Rich factor refers to the ratio of the differentially expressed genes enriched in the path to the number of genes annotated to the path. A larger Rich factor indicates greater enrichment. qvalue is the p-value corrected for multiple hypothesis testing (hypergeometric distribution p-value), and a smaller qvalue indicates more significant enrichment
Fig. 3
Fig. 3
Analysis of commonly up-regulated DEGs in two pepper lines during R. solanacearum infection. A Venn analysis of commonly up-regulated DEGs between BVRC1 and BVRC25 at different times (12, 24, 48 and 72 h) during R. solanacearum infection. B GO analysis of up-regulated genes in common in BVRC1 and BVRC25 at 12, 24, 48, and 72 h post-inoculation with R. solanacearum. C Heat map of upregulated genes in common that may be associated with disease resistance in disease-resistant BVRC1 and disease-susceptible BVRC25 lines. Rows represent DEGs, and columns represent treatments. White and red boxes represent DEGs with lower and higher expression levels, respectively. Color saturation reflects the magnitude of the log2 expression ratio for each unigene
Fig. 4
Fig. 4
Phytohormone concentrations in resistant pepper line BVRC1 and susceptible line BVRC25 during Ralstonia solanacearum infection. Mean A jasmonic acid (JA) and B salicylic acid (SA) concentrations (± SE, n = 3) in BVRC1 and BVRC25 post-inoculation with R. solanacearum. Data are shown as the mean standard errors of three replicates. Asterisks indicate significant differences between the treated BVRC1 and BVRC25. *, P < 0.05; ** P < 0.01, *** P < 0.001, **** P < 0.0001; Student’s t-test. FM, fresh mass
Fig. 5
Fig. 5
Weighted gene co-expression network analysis (WGCNA). A Expression profile, functional enrichment, and regulatory network of genes from the grey60, green, yellow and pink modules. B Heat map of JA and characteristic modules. The color gradient represents the relative sequence abundance. Numbers in the color key indicate log2 FC
Fig. 6
Fig. 6
Evaluation of peppers resistant (BVRC1) and susceptible (BVRC25) to Ralstonia solanacearum after treatment with jasmonic acid (JA) A-B Disease index of the BVRC1 and BVRC25 in response to JA treatment when challenged with R. solanacearum infection for 0 to 15 days. The data were collected from 12 plants for each line. The experiment was carried out three times to confirm the results. Treatment of R. solanacearum infection in (AB) was performed by root inoculation as described in the Materials and Methods. C Comparison of resistance against R. solanacearum strain Rs-SY1 in BVRC1 between the JA and water treatments (mock). The average AUDPC for each line was calculated from two experiments. Asterisks indicate significant differences in JA treatment compared with the mock. * P < 0.05; ** P < 0.01, *** P < 0.001, **** P < 0.0001; Student’s t-test
Fig. 7
Fig. 7
Analysis of peppers resistant (BVRC1) and susceptible (BVRC25) to Ralstonia solanacearum after being treated with jasmonic acid (JA). A DEGs unique to the JA treatment. B Venn graphs between JA and up-regulated DEGs in BVRC1 inoculated with R. solanacearum at four stages. RM, Pepper BVRC1 control-treated with sterile water. RJA, Pepper BVRC1 application with exogenous JA. Three biological replicates at each time point were used for RNA-sequencing analysis. DEGs were selected based on a cut-off of P-adjust < 0.05 and |log2 FC|≥ 1. The GO term with P > 0.05 was listed. C Dot plots showing GO term enrichment for DEGs after treatment with JA for 24 h. The X-axis represents the rich factor and the Y-axis represents the GO terms. The size and color of the dots correspond to the number of DEGs associated with the GO terms and pathways. Rich factor refers to the ratio of the number of differentially expressed genes enriched in the pathway to the number of genes annotated to the pathway. A larger Rich factor indicates greater enrichment. qvalue is the p-value corrected for multiple hypothesis testing (hypergeometric distribution p-value), and a smaller qvalue indicates more significant enrichment
Fig. 8
Fig. 8
Analysis of protein interactions between Capana08 g0002211 and T3Es. Yeast two-hybrid analysis of protein interactions between Capana08 g002211 and RipTPS (A), RipD (B); RipX (C), RipM (D), RipAB (E), and RipP1 (F). Yeast colonies were first grown on SD/-Leu/-Trp (DDO) and then positive interactions were determined by the appearance of yeast colonies on quadruple dropout agar medium SD/–Leu/–Trp/–His/–Ade with Aureobasidin A and x-α-gal (QDO/AbA/x-α-gal). The positive controls were pGBKT7(BD)−53 and pGADT7 (AD)-T, and the negative controls were pGBKT7 (BD)-lam, pGADT7 (AD)-T, pGBKT7 (BD)-T3Es, and pGADT7 (AD). DDO indicates SD/-Leu/-Trp; DDO/X indicates SD/-Leu/-Trp/X-α-gal; TDO/X indicates SD/-Leu/-Trp/-His/X-α-gal; and QDO/X/A indicates SD/-Leu/-Trp/-His/Ade/X-α-gal/AbA. The AbA concentration was 125 ng/mL, and the X-α-gal concentration was 40 mg/L. G LCI was used to detect LUC signals from the interaction between RipTPS and Capana08 g002211. The negative control exhibited no signs of luciferase activity. (negative control groups: nLUC and cLUC; TPS-nLUC and cLUC; cLUC-Capana08 g002211 and nLUC)

Similar articles

References

    1. Wang Z, Luo W, Cheng S, Zhang H, Zong J, Zhang Z. Ralstonia solanacearum – a soil borne hidden enemy of plants: Research development in management strategies, their action mechanism and challenges. Front Plant Sci. 2023;14:1141902. - PMC - PubMed
    1. Lowe-Power TM, Khokhani D, Allen C. How Ralstonia solanacearum exploits and thrives in the flowing plant xylem environment. Trends Microbiol. 2018;26:929–42. - PubMed
    1. Rivera-Zuluaga K, Hiles R, Barua P, Caldwell D, Iyer-Pascuzzi AS. Getting to the root of Ralstonia invasion. Semin Cell Dev Biol. 2023;148–149:3–12. - PubMed
    1. Du H, Chen B, Zhang X, Zhang F, Miller SA, Rajashekara G, et al. Evaluation of Ralstonia solanacearum infection dynamics in resistant and susceptible pepper lines using bioluminescence imaging. Plant Dis. 2017;101:272–8. - PubMed
    1. Du H, Wen C, Zhang X, Xu X, Yang J, Chen B, et al. Identification of a major QTL (qRRs-10.1) that confers resistance to Ralstonia solanacearum in pepper (Capsicum annuum) using SLAF-BSA and QTL mapping. IJMS. 2019;20:5887. - PMC - PubMed

MeSH terms

LinkOut - more resources