

Study on the physiological mechanism and molecular regulatory network of Blumea balsamifera in response to drought stress
- PMID: 40604416
- PMCID: PMC12220101
- DOI: 10.1186/s12870-025-06916-w
Study on the physiological mechanism and molecular regulatory network of Blumea balsamifera in response to drought stress
Abstract
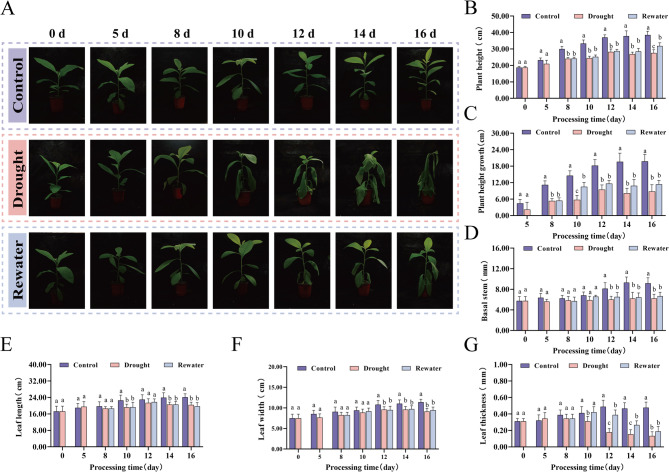
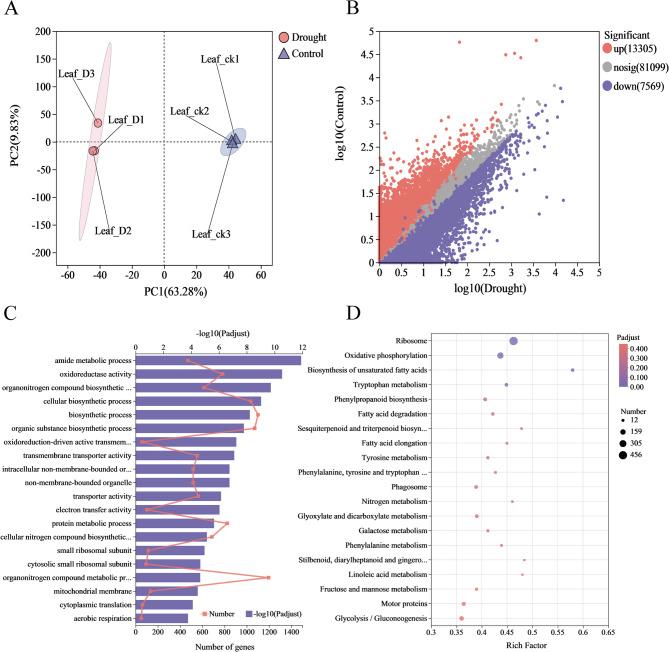
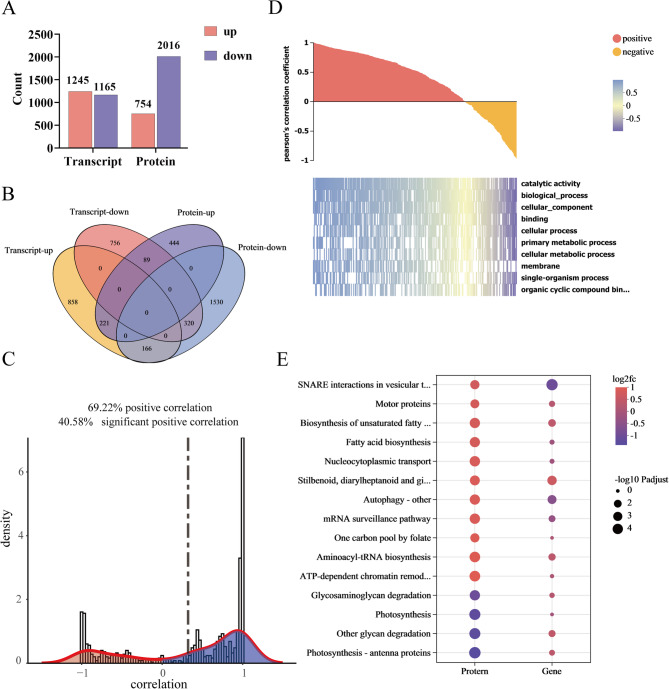
Drought restricts plant growth and agricultural production. As an important medicinal plant, Blumea balsamifera is sensitive to water, but there is still a lack of systematic research on its drought response mechanism. In this study, four-month-old B. balsamifera seedlings were used as materials, and three groups were set up: normal irrigation (CK), drought stress (DS), and rewatering recovery (RW). The results showed that drought significantly inhibited the growth and photosynthesis of B. balsamifera. With the prolongation of stress time (day 12), the limiting factor of photosynthesis changed from initial stomatal limitation to non - stomatal limitation. In terms of physiology and biochemistry, B. balsamifera increased MDA content by actively reducing SPAD value and relative water content of leaves; and activates the antioxidant enzyme system to remove ROS, synergistically accumulates lignin, soluble sugar, proline and other osmotic adjustment substances, and jointly maintains cell water balance and membrane system stability. Through transcriptome and proteome analysis, 20,874 DEGs and 2770 DEPs were screened out, which were significantly enriched in terms related to ribosome, oxidoreductase activity, biosynthesis of unsaturated fatty acids and other pathways. A total of 55 drought - related DEGs - DEPs were identified by two - omics, and 18 key regulatory genes were screened. In summary, B. balsamifera formed a comprehensive drought resistance mechanism through photosynthesis, physiology and DEGs - DEPs network. This study provides theoretical support for the breeding and resource development of B. balsamifera, and also provides reference for the study of stress resistance of other medicinal plants.
Keywords: Blumea balsamifera L; Drought resistance mechanism; Drought stress; Proteomics; Transcriptomics.
© 2025. The Author(s).
Conflict of interest statement
Declarations. Ethics approval and consent to participate: Not applicable. Consent for publication: Not applicable. Competing interests: The authors declare no competing interests.
Figures


Similar articles
-
Drought and rewatering effects on soybean photosynthesis, physiology and yield.PeerJ. 2025 Jul 3;13:e19658. doi: 10.7717/peerj.19658. eCollection 2025. PeerJ. 2025. PMID: 40620768 Free PMC article.
-
Transcriptome analysis reveals regulatory mechanisms of different drought-tolerant Gleditsia sinensis seedlings under drought stress.BMC Genom Data. 2024 Mar 13;25(1):29. doi: 10.1186/s12863-024-01216-y. BMC Genom Data. 2024. PMID: 38481144 Free PMC article.
-
Integrated Analysis of Physiological Responses and Transcriptome of Cotton Seedlings Under Drought Stress.Int J Mol Sci. 2025 Aug 13;26(16):7824. doi: 10.3390/ijms26167824. Int J Mol Sci. 2025. PMID: 40869143 Free PMC article.
-
Signs and symptoms to determine if a patient presenting in primary care or hospital outpatient settings has COVID-19.Cochrane Database Syst Rev. 2022 May 20;5(5):CD013665. doi: 10.1002/14651858.CD013665.pub3. Cochrane Database Syst Rev. 2022. PMID: 35593186 Free PMC article.
-
Selegiline for Alzheimer's disease.Cochrane Database Syst Rev. 2003;(1):CD000442. doi: 10.1002/14651858.CD000442. Cochrane Database Syst Rev. 2003. PMID: 12535396
References
-
- Pandey P, Patil M, Priya P, Senthil-Kumar M. When two negatives make a positive: the favorable impact of the combination of abiotic stress and pathogen infection on plants. J Exp Bot. 2024;75(3):674–88. - PubMed
-
- Jump AS, Ruiz-Benito P, Greenwood S, Allen CD, Kitzberger T, Fensham R, Martínez-Vilalta J, Lloret F. Structural overshoot of tree growth with climate variability and the global spectrum of drought-induced forest dieback. Glob Change Biol. 2017;23(9):3742–57. - PubMed
-
- Stuart-Haëntjens E, De Boeck HJ, Lemoine NP, Mänd P, Kröel-Dulay G, Schmidt IK, Jentsch A, Stampfli A, Anderegg WRL, Bahn M, et al. Mean annual precipitation predicts primary production resistance and resilience to extreme drought. Sci Total Environ. 2018;636:360–6. - PubMed
-
- Sato H, Mizoi J, Shinozaki K, Yamaguchi-Shinozaki K. Complex plant responses to drought and heat stress under climate change. Plant Journal: Cell Mol Biology. 2024;117(6):1873–92. - PubMed
-
- Furlan AL, Bianucci E, Giordano W, Castro S, Becker DF. Proline metabolic dynamics and implications in drought tolerance of peanut plants. Plant Physiol Biochemistry: PPB. 2020;151:566–78. - PubMed
MeSH terms
Grants and funding
- 3411-411000163/This research was supported by the Guizhou Authentic medicinal Materials Germplasm Resource Bank Equipment Construction Project (Authentic medicinal Materials Advantages and Characteristics Industry Cluster (Chinese medicinal materials Industry Cluster))
- 3411-411000163/This research was supported by the Guizhou Authentic medicinal Materials Germplasm Resource Bank Equipment Construction Project (Authentic medicinal Materials Advantages and Characteristics Industry Cluster (Chinese medicinal materials Industry Cluster))
- zyyzdxk-2023186/the State Administration of Traditional Chinese Medicine high-level key discipline construction project
- zyyzdxk-2023186/the State Administration of Traditional Chinese Medicine high-level key discipline construction project
- GZY TD Hezi [2022]001/the Guizhou University of Chinese Medicine, Karst medicinal resources protection and innovative utilization of scientific and technological innovation talent team project
LinkOut - more resources
Full Text Sources
Research Materials
