. 2025 Jul 2;26(1):221.
doi: 10.1186/s12931-025-03306-6.

An orally bioavailable BRD4 inhibitor disrupts expansion of a pathogenic epithelial-mesenchymal niche in bleomycin-induced fibrosis

Affiliations

An orally bioavailable BRD4 inhibitor disrupts expansion of a pathogenic epithelial-mesenchymal niche in bleomycin-induced fibrosis

Melissa Skibba et al. Respir Res. .

Abstract

Background: Idiopathic pulmonary fibrosis (IPF) is a relentlessly progressive and fatal disease with few effective therapies available. Fibrosis is driven, in part, by cell-state transitions of epithelial progenitors within the airways that repopulate the injured alveoli. This alveolar atypia affects gas exchange and stimulates ECM production. We sought to examine the role of BRD4 signaling in progenitor expansion in bleomycin-induced lung injury.

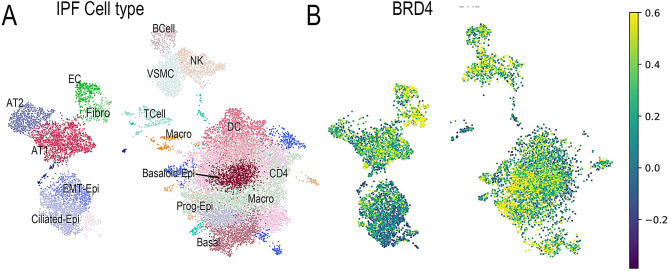
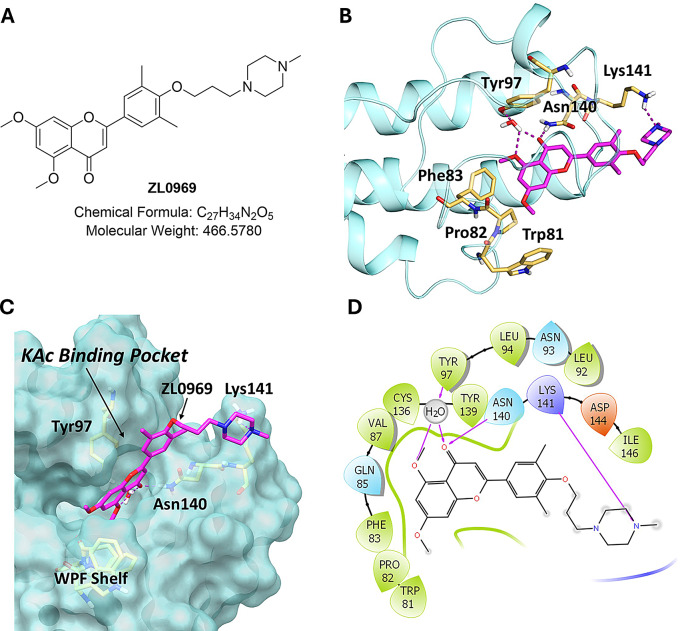
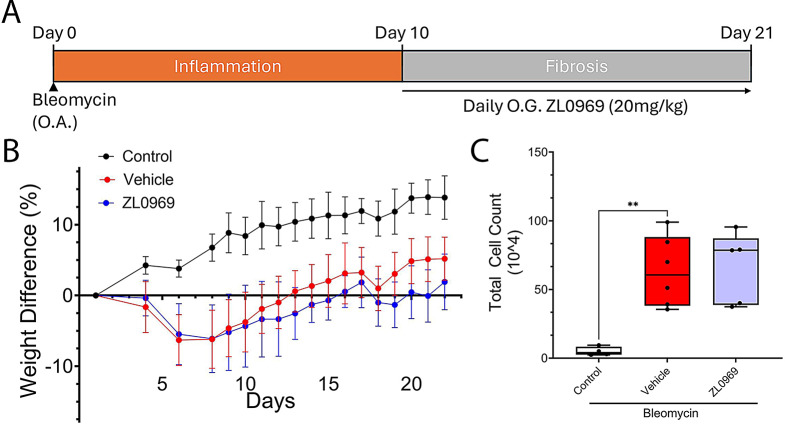
Methods: Activation of the Bromodomain-containing protein 4 (BRD4) epigenetic regulator in distinct stem cell populations was quantitated in a high-resolution scRNA-seq time course of bleomycin-induced injury, and confirmed in scRNA-seq studies in human IPF. A potent, selective, and orally bioavailable BRD4 inhibitor (BRD4i, ZL0969) was rationally designed and synthesized. The effect of BRD4i on myofibroblast transition, progenitor cell expansion and fibrosis was evaluated using a therapeutic experimental design in C57BL6/mice.

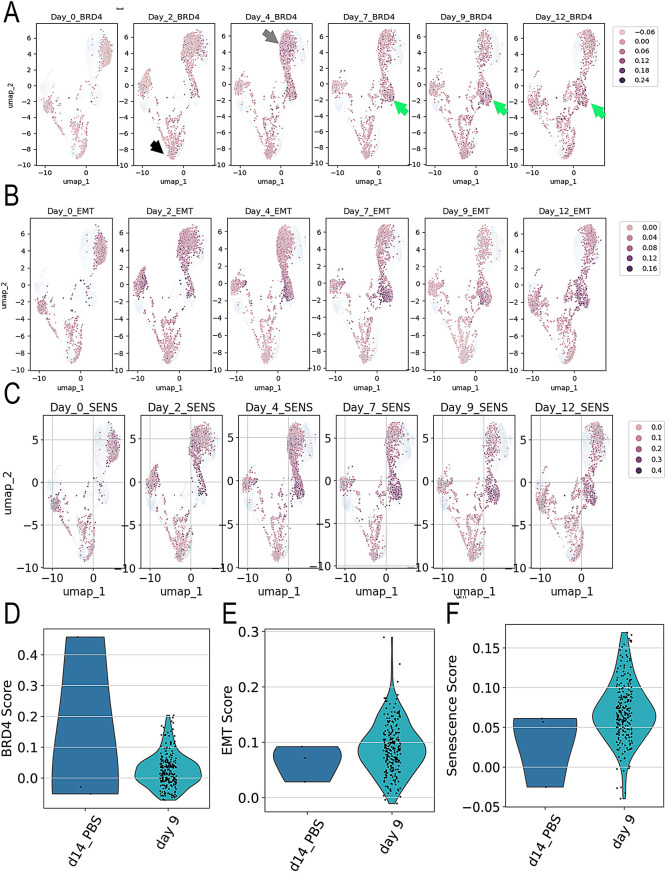
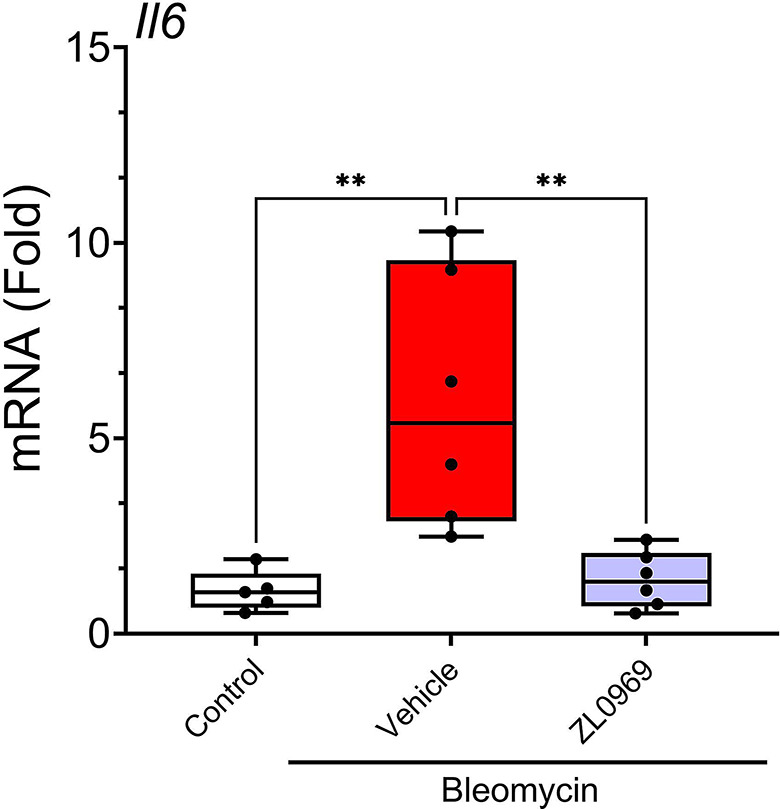
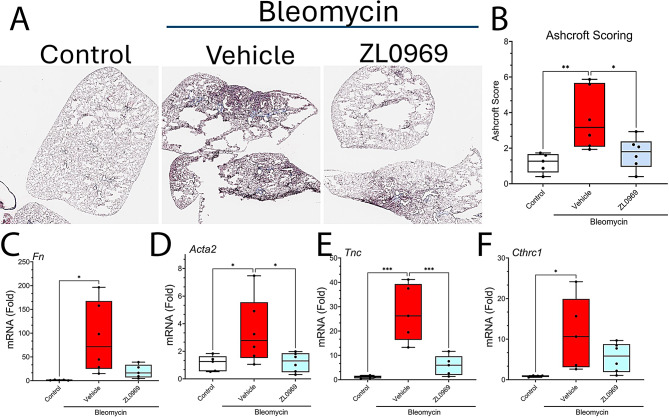
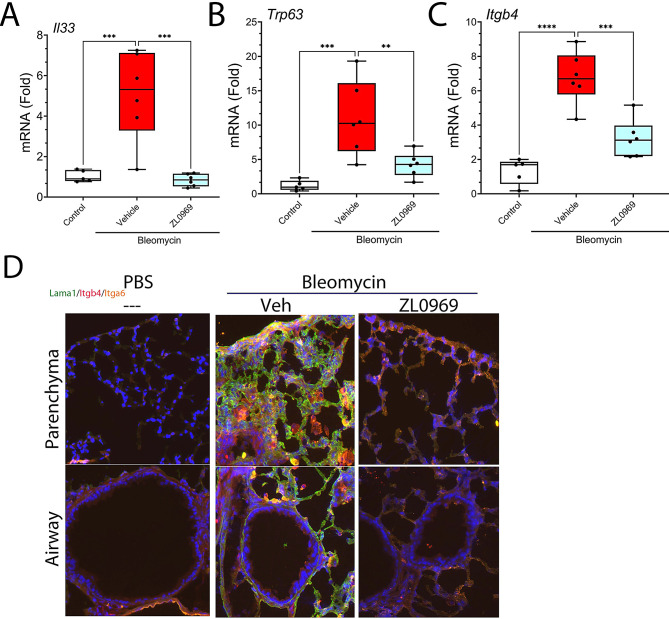
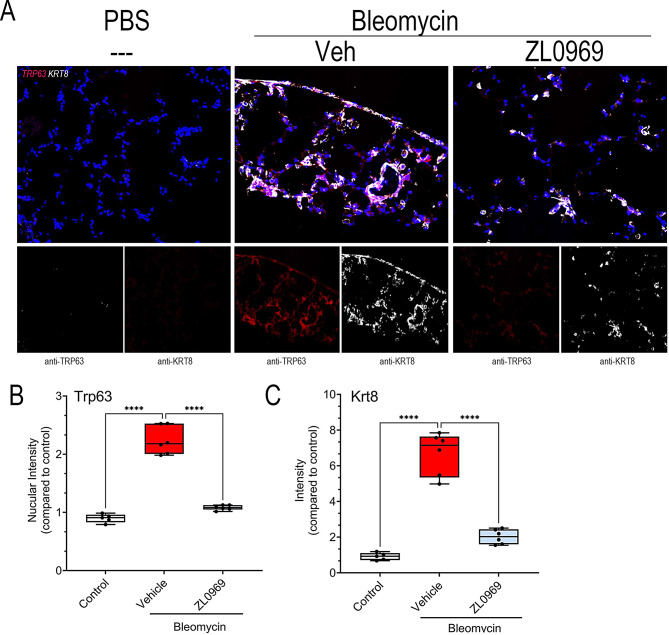
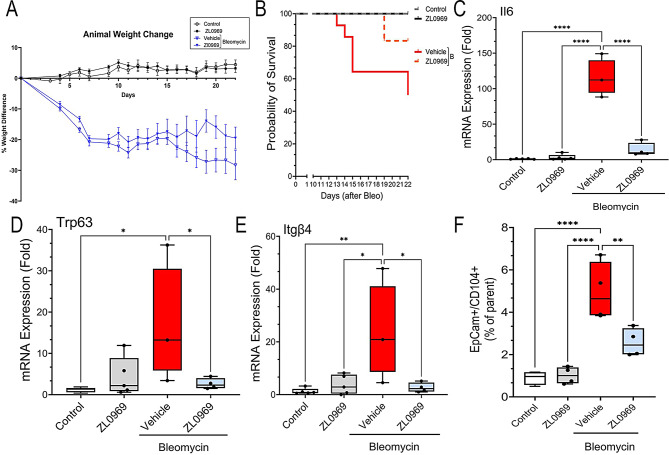
Results: We find that the BRD4 pathway is rapidly induced in regenerating activated alveolar type (AT)2 cells and persists in a population of pro-fibrotic Krt8 + progenitors expressing markers of epithelial mesenchymal transition as well as senescence. To test the functional role of BRD4 activation, we administered a potent, selective, and orally bioavailable BRD4 inhibitor (BRD4i, ZL0969) with ~ 80 nM IC50 to bleomycin-treated mice. BRD4i reduced myofibroblast formation and deposition of denatured ECM (collagen and laminin a1) in the alveolar space and improved disease scores. Importantly, BRD4i reduced a pathogenic population of alveolar progenitor cells expressing integrin (ITG)-A6/B4, tumor related protein 63 (Trp63) and keratin (Krt). In mice given an LD50 dose of bleomycin, BRD4 inhibition significantly improved their survival and reduced markers of disease.

Conclusions: These data demonstrate that inhibition of BRD4 signaling prevents expansion of myofibroblasts and expansion of a pathogenic epithelial progenitor population controlling alveolar atypia and fibrosis.


Conflict of interest statement

Declarations. Ethics approval and consent to participate: All vertebrate animals experiments were conducted using a protocol reviewed and approved by the University of Wisconsin-Madison School of Medicine and Public Health Institutional Animal Care and Use Committee (IACUC), adhering to guidelines set by National Institutes of Health (NIH) and Association for Assessment and Accreditation of Laboratory Animal Care (AAALAC). Consent for publication: Not applicable. Competing interests: JZ, BT and ARB hold patents on chemistry of BRD4 inhibitors. JZ and ARB are co-founders of Quadragenics Inc. The remaining authors declare that the research was conducted in the absence of any commercial or financial relationships that could be construed as a potential conflict of interest.

Figures

Fig. 1
Fig. 1
Kinetics of epithelial BRD4 activation. (A) Uniform Manifold Approximation and Projection (UMAP) representation of EPCam + cells enriched from mice over a time course of bleomycin treatment. scRNA seq was performed at days (d) 0–54 spanning the phases of bleomycin injury to resolution. Each symbol represents discrete single cell, labeled as 26 discrete cell varieties. Abbreviations used: AT, alveolar type; basal, basal epithelial cell; Mi67, Marker of Proliferation Ki-67; MHCII, Class II Major Histocompatibility Complex II. Cells are colored by treatment day; legend at right. (B) Dotplot of most highly variable genes for each cell type assignment. Circle diameter refers to percentage of cell population; color indicates BRD4 numerical score. Right, hierarchical clustering of cell types indicating the similar gene expression patterns for Proliferating (Mi67+) and AT2 cells; Goblet, ciliated and club cells; and AT1 and Krt8 + ADI cell types. (C) Violin plot of BRD4 pathway activation for each cell type at d14 of PBS treatment. Each symbol refers to BRD4 pathway activation score for cells. (D) Violin plot of BRD4 activation score for day 4 post bleomycin treatment. Black arrowheads note the marked increase in cells with activated BRD4 in activated AT2 activated and KRT8 + progenitor cells. (E) Cell frequency of AT2 activated cells after bleomycin treatment. Note the peak in AT2 activation 4 d after treatment, followed by disappearance. (F) Frequency of Krt8 + ADI cell population after treatment. Note the peak in the Krt8 + population 8–9 d after treatment with more prolonged persistence.
Fig. 2
Fig. 2
Kinetics of pathway activation in epithelial populations after bleomycin injury. (A-C), Time course of cellular activation score for epithelial cell populations at d = 0, 2, 4, 7, 9 and 12 d after bleomycin treatment. The level of pathway activation in each is overlaid on the epithelial cell umap projection (light gray in background). (A), Kinetics of BRD4 pathway activation. Empirically derived BRD4-dependent genes were used to develop the activation score (Supplementary Table S2) and mapped to individual cells by L1 regularization to reduce stochastic effects. Note the activation of BRD4 in the AT2 activated cells appear on d 2, further accumulating on d 4, with loss of BRD4 pathway in after d 9. By contrast, BRD4 signatures in Krt8 + ADI accumulate later and persist after 9 d (green arrows). (B), Kinetics of EMT pathway activation. EMT activation score was created from Hallmark MSigDB data set that included Krt18, Col1A1, FN1 and others. Note the superimposition of the distinct EMT and BRD4 pathway activation scores with early induction in “AT2 activated” and later, persistent, activation in Krt8 + ADI cells. (C), Kinetics of cellular senescence pathway activation. Cellular senescence pathway score was created from [23], including Cdkn1a, Integrin a 2(Itga2), Serpin Family E Member 2 (Serpine2), CC chemokine-like (CCL)5 and others (Supplementary Table S2). Note the emergence of senescence in the ADI population that persists past 12 d. (D), Violin plot of pathway activation for BRD4, EMT and cellular senescence in Krt8 + ADI at 9d vs. control (d14, PBS). Each symbol quantitates pathway activation score for an individual cell
Fig. 3
Fig. 3
BRD4 pathway activation in IPF. (A), A UMAP representation of nearest neighbor clustering of an integrated data set of 32 IPF lungs and 28 control donor lungs corresponding to 20,141 cells and 13,536 genes [2]. Twenty-two distinct populations can be resolved by transcriptional profile and colored by leiden clustering. Major cell populations were annotated using highly expressed marker genes and confirmed by manual validation with Ref [2]. Major cell populations include: AT1/2, alveolar type-1 or 2; DC, dendritic cells; ECs, endothelial cells; EMT-Epi, EMT-transitioned epithelial cells; NK, natural killer; Macro, alveolar macrophages, TCells, T- helper lymphocytes; HAS1 + fibro, hyaluronan synthase (HAS)1 + fibroblasts. (B), BRD4 activation score was calculated and overlaid on the UMAP projection. BRD4 activation scale is shown at right. Note the activated BRD4 pathway in the AT1, EMT-AT1, basaloid epithelial and progenitor epithelial populations
Fig. 4
Fig. 4
Chemical structure of BRD4 Inhibitor ZL0969 and the binding mode of ZL0969 with human BRD4 BD1. (A) Chemical structure of novel BRD4 inhibitor ZL0969 identified through rational design and structural optimization. (B) ZL0969 (magenta stick) docked into BRD4 BD1(PDB ID: 6UWU; cyan ribbon) acetylated lysine (KAc) binding site in zoomed view. Key residues of BRD4 BD1 at binding site (Asn140, Tyr97, Lys141, Phe83, Pro82, and Trp81) are shown as yellow sticks. Hydrogen bond interactions between ZL0969 and residues Asn140 and Tyr97, and salt bridge interaction between ZL0969 and residue Lys141 are shown as purple dashed lines. The WPF shelf (residues Phe83, Pro82, and Trp81) forms hydrophobic interaction with ZL0969. (C) ZL0969 (magenta stick) docking into Acetyl-lysine pocket of BRD4 BD1 (cyan) in surface representation. (D) 2D interaction diagram of ZL0969 docked into BRD4 BD1(PDB ID: 6UWU). Hydrogen bond and salt bridge interactions are shown as purple dashed lines
Fig. 5
Fig. 5
Dose response curves and IC50 values of ZL0969 against TLR3-induced expressions of innate inflammatory genes. The IC50 values of ZL0969 were determined on poly (I: C)-induced expression of IL-6, CIG5, IL-8, and ISG54 in hSAECs. The results are derived from three independent experiments (n = 3) and IC50 values are calculated out using Four Parameters Regression method (https://www.aatbio.com/tools/ic50-calculator/)
Fig. 6
Fig. 6
BRD4i administration in a therapeutic delivery model. (A) Schematic diagram of study design and treatment strategy. Top, time scale for bleomycin phases. followed by administration of ZL0969 by oral gavage (OG; 20 mg/kg) daily from day 10 until 21. Abbreviations: n, number of mice; OA, oropharyngeal aspiration; OG, oral gavage. (B) Body weights were collected daily and plotted as percent of original. Two-way ANOVA was utilized for assessment of statistical significance between the two bleomycin-treated groups over time. (C), BALF cell counts. Shown are total cell counts for each treatment group. **, P < 0.01
Fig. 7
Fig. 7
ZL0969 inhibits BRD4 signaling in vivo. To demonstrate direct target engagement, total lung RNA was quantitated for Il6 mRNA a highly BRD4-dependent gene. Shown is fold change in Il6 mRNA relative to PBS-treated mice, normalized to Ppia mRNA (internal control). Symbols are individual animals (n = 6 animals/treatment condition). Boxes are 25–75% interquartile range. **, P < 0.01, post-hoc Sidak correction for multiple comparisons
Fig. 8
Fig. 8
BRD4i reduces bleomycin collagen production. (A), Masson Trichrome staining. Left lungs were inflated and flash fixed in OCT and stained with Masson Trichrome. Representative images are displayed at ×2 magnification. (B), Collagen content was quantified using modified Ashcroft scoring in approximately 10 fields of view at ×20 magnification. **, P < 0.01, post-hoc Sidak. (C)-F), RT-qPCR of whole lung RNA. (C), Fn1; (D), Acta2; (E), Tnc; (F), Cthrc1. Symbols are individual animals (n = 5 animals/treatment condition). Boxes are 25–75% interquartile range. *, P < 0.05; **, P < 0.01; ***, P < 0.001, post-hoc Sidak correction for multiple comparisons
Fig. 9
Fig. 9
BRD4i reduces disordered collagen deposition. (A), Immunofluorescence microscopy (IFM) staining for collagen (Picosirius) and denatured collagen (F-CHP). Top, nuclei are counterstained with DAPI (blue). Bottom sections are Picosiruis staining (Red), and F-CHP (Green) at ×2 magnification. Note the absence of F-CHP signal in the stained sections. Scale bars are 80 μm. (B), Quantitation of staining. For each stain, multiple fields were quantitated (Fiji) and expressed as arbitrary fluorescence units relative to control. Each symbol represents a different animal. **, P < 0.01; ***, P < 0.001, post-hoc Sidak correction for multiple comparisons
Fig. 10
Fig. 10
BRD4i reduces ADI-like epithelial progenitors. Q-RT-PCR of whole lung RNA. (A), Il33; (B), Trp63; (C), Itgb4. Symbols are individual animals (n = 5 animals/treatment condition). Boxes are 25–75% interquartile range. **, P < 0.01; ***, P < 0.001, post-hoc Sidak correction for multiple comparisons. (D), IFM staining of airway and parenchyma sections at ×40 magnification. LAMA1 (green), ITGB4 (red), ITGA6 (orange). Nuclei are counterstained in DAPI
Fig. 11
Fig. 11
BRD4i reduces KRT8+/TRP63 + progenitors. (A), IFM staining for TRP63 and KRT8 in PBS, Bleo + Veh, and Bleo + BRD4i treatment groups at ×2 magnification. Nuclei are counterstained in DAPI. Top panel is merged TRP63 and KRT8 staining; bottom panel are separate images. (B), Quantification of TRP63 IFM staining (n = 6 animals/treatment condition). (C) Quantification of KRT8 IFM staining (n = 6 animals/treatment condition). Boxes are 25–75% interquartile range. ***, P < 0.001, post-hoc Sidak correction for multiple comparisons
Fig. 12
Fig. 12
BRD4i enhances survival. (A), LD50 administration of bleomycin. Body weights were collected daily and plotted as percent of original. (B), Survival curves by treatment group. (C, D) RT-qPCR of whole lung RNA. (C), Trp63; (D), Itgb4. Symbols are individual animals (n = 5 animals/treatment condition). Boxes are 25–75% interquartile range. **, P < 0.01; ***, P < 0.001, post-hoc Sidak correction for multiple comparisons. (E), Quantitation of ITGB4 + epithelial progenitors. Whole lungs were dissociated and sorted for EpCam+/ ITGB4+ (CD104+) stained cells. Gating strategy in Supplemental Fig. S1. ***, P < 0.001; **, P < 0.01, ANOVA. (C), Kaplan Meier survival curve of LD50 administration. Curves are statistically significant at P = 0.031

References

    1. Ley B, Collard HR, King TE. Clinical course and prediction of survival in idiopathic pulmonary fibrosis. Am J Respir Crit Care Med. 2011;183(4):431–40. - PubMed
    1. Adams TS, Schupp JC, Poli S, Ayaub EA, Neumark N, Ahangari F, et al. Single-cell RNA-seq reveals ectopic and aberrant lung-resident cell populations in idiopathic pulmonary fibrosis. Sci Adv. 2020;6(28):eaba1983. - PMC - PubMed
    1. Konkimalla A, Konishi S, Macadlo L, Kobayashi Y, Farino ZJ, Miyashita N, et al. Transitional cell States sculpt tissue topology during lung regeneration. Cell Stem Cell. 2023;30(11):1486–e5029. - PMC - PubMed
    1. Auyeung VC, Downey MS, Thamsen M, Wenger TA, Backes BJ, Sheppard D, et al. IRE1α drives lung epithelial progenitor dysfunction to Establish a niche for pulmonary fibrosis. Am J Physiol Lung Cell Mol Physiol. 2022;322(4):L564–80. - PMC - PubMed
    1. Habermann AC, Gutierrez AJ, Bui LT, Yahn SL, Winters NI, Calvi CL, et al. Single-cell RNA sequencing reveals profibrotic roles of distinct epithelial and mesenchymal lineages in pulmonary fibrosis. Sci Adv. 2020;6(28):eaba1972. - PMC - PubMed

MeSH terms

LinkOut - more resources