

TEA5K: a high-resolution and liquid-phase multiple-SNP array for molecular breeding in tea plant
- PMID: 40605004
- PMCID: PMC12220398
- DOI: 10.1186/s12951-025-03533-5
TEA5K: a high-resolution and liquid-phase multiple-SNP array for molecular breeding in tea plant
Abstract
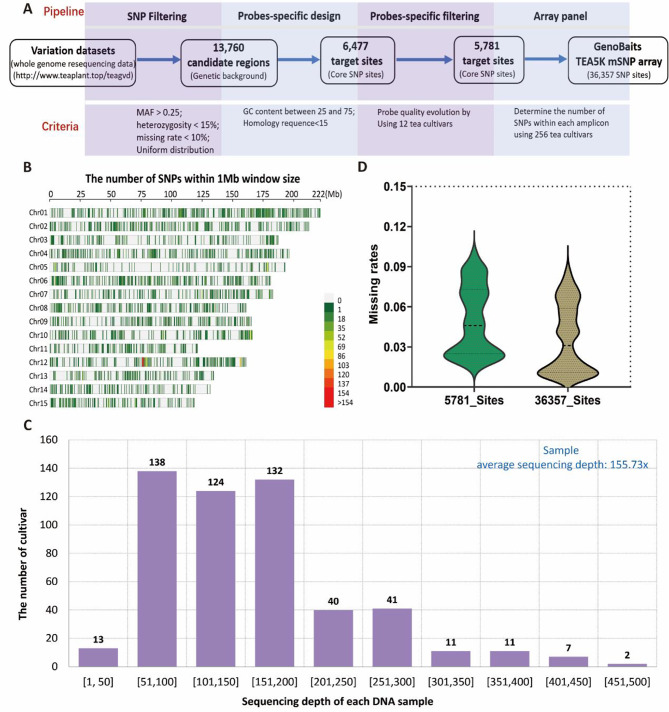
Background: High-throughput genotyping technology has become an indispensable tool for advancing molecular breeding and genetic research in plants, facilitating large-scale exploration of genomic variation. Genotyping technology based on liquid-phase array utilizes streptavidin-coated nanomagnetic beads to capture biotin-modified probes, thereby capturing the target sequence on the genome, achieving the purpose of genotyping. This study aims to develop a novel liquid-phase for tea plant, which can be used for cultivar identification, genetic map construction, Quantitative Trait Locus (QTL) mapping of key agronomic traits in tea plants, and genetic evolution analysis.
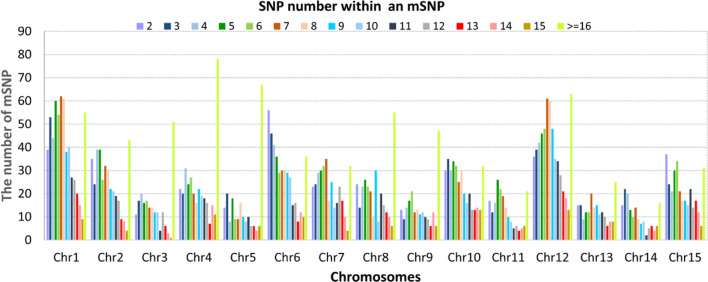
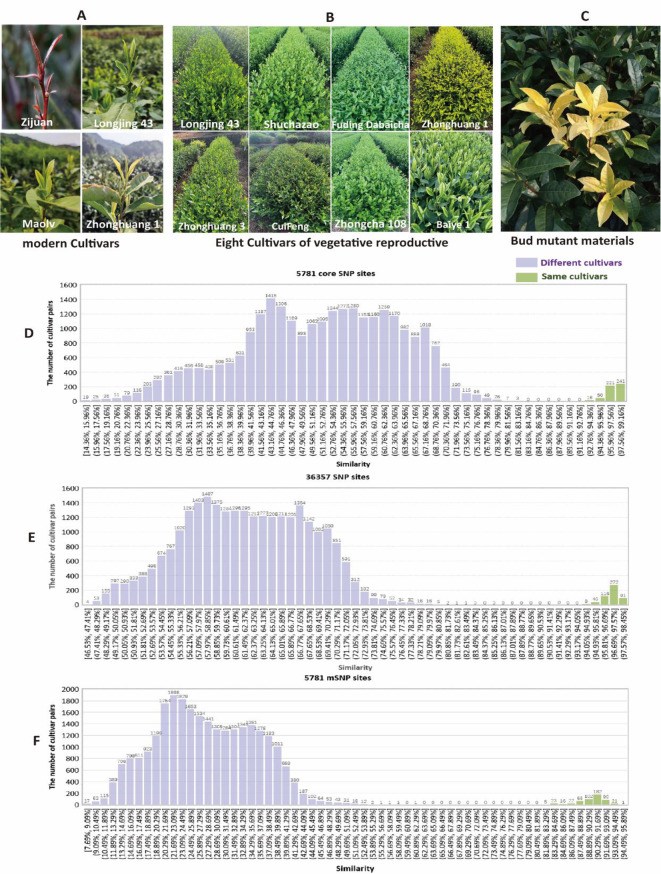
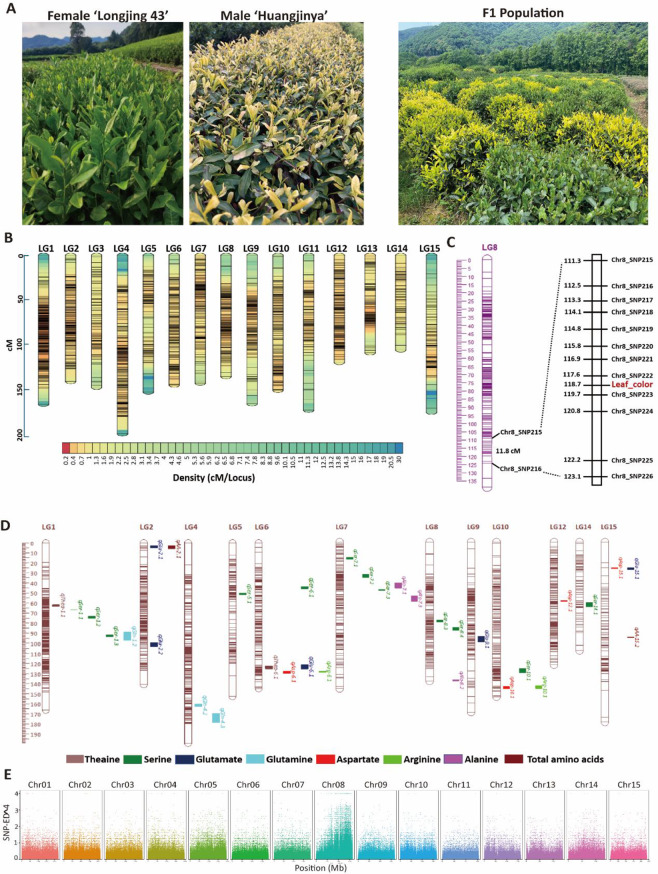
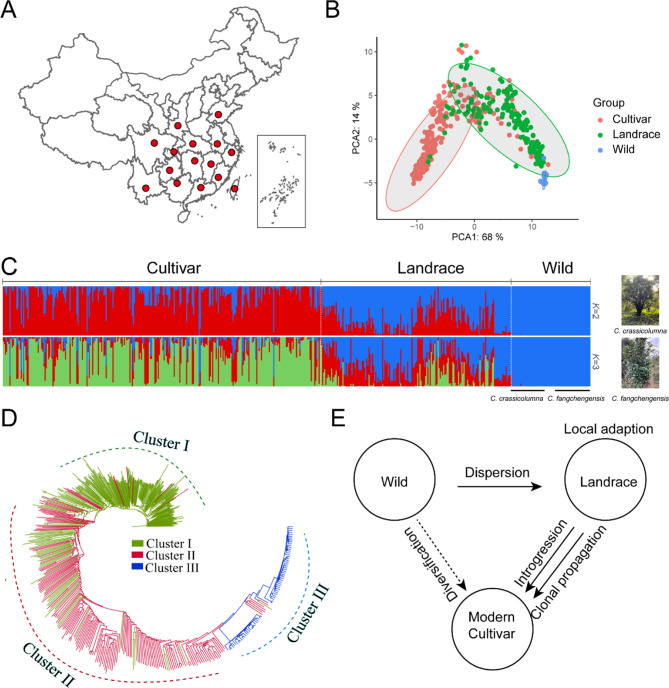
Result: We developed a highly efficient multiple-SNP array, the TEA5K mSNP array, which comprises 5,781 liquid-phase probes based on the Genotyping by Target Sequencing (GBTS) system. Using this array, we genotyped 231 developed tea cultivars, revealing that genetic similarity within the same cultivar ranged from 92.53-97.95%, whereas genetic similarity between different cultivars generally remained below 82.36%. Furthermore, utilizing this array, we constructed a high-density genetic map consisting of 3,274 markers, covering a total genetic distance of 2,225.19 cM, with an average marker interval of 0.76 cM. The high-resolution genetic map facilitated the identification of multiple QTLs linked to eight amino acid components, as well as two molecular markers strongly associated with the albino-leaf trait in the 'Huangjinya' cultivar, both mapped to chromosome 8. Moreover, we applied the array to analyze the population structure and phylogenetic relationships of 519 tea germplasm, classifying them into three major groups: wild accessions, landraces, and modern cultivars. Notably, modern cultivars exhibited lower genetic diversity compared to landraces. Additionally, we observed substantial genetic differentiation between wild resources and modern cultivars, with minimal to no gene flow from wild populations into domesticated cultivars. These findings suggest that modern tea breeding faces an "improvement bottleneck," a challenge similar to that encountered in other perennial crops.
Conclusion: The TEA5K mSNP array is presented as a flexible, cost-effective, and low-maintenance genotyping tool that significantly enhances both genetic research and molecular breeding in tea plants. By providing a robust platform for genome-wide analysis and facilitating the identification of key QTLs, this tool offers valuable insights for improving the genetic diversity and agronomic performance of tea cultivars.
Keywords: Cultivar identification; Gene mapping; Genetic evolution; Genetic maps; Genotyping by target sequencing.
© 2025. The Author(s).
Conflict of interest statement
Declarations. Ethics approval and consent to participate: Not applicable. Consent for publication: Not applicable. Competing interests: The authors declare no competing interests.
Figures
Similar articles
-
Genome wide association analysis of flavour related metabolites in tea germplasm [Camellia sinensis (L.) Kuntze] from Assam using a genotyping by sequencing strategy.BMC Plant Biol. 2025 Jul 14;25(1):911. doi: 10.1186/s12870-025-06889-w. BMC Plant Biol. 2025. PMID: 40653472 Free PMC article.
-
Genetic diversity and evolutionary insights of Dali tea (Camellia taliensis) in the Lancang River Basin: Implications for tea breeding and resource conservation.PLoS One. 2025 Jul 31;20(7):e0328658. doi: 10.1371/journal.pone.0328658. eCollection 2025. PLoS One. 2025. PMID: 40743217 Free PMC article.
-
Identification of new candidate genes affecting drip loss in pigs based on genomics and transcriptomics data.J Anim Sci. 2025 Jan 4;103:skaf177. doi: 10.1093/jas/skaf177. J Anim Sci. 2025. PMID: 40485044 Free PMC article.
-
Diagnostic test accuracy and cost-effectiveness of tests for codeletion of chromosomal arms 1p and 19q in people with glioma.Cochrane Database Syst Rev. 2022 Mar 2;3(3):CD013387. doi: 10.1002/14651858.CD013387.pub2. Cochrane Database Syst Rev. 2022. PMID: 35233774 Free PMC article.
-
Systemic pharmacological treatments for chronic plaque psoriasis: a network meta-analysis.Cochrane Database Syst Rev. 2021 Apr 19;4(4):CD011535. doi: 10.1002/14651858.CD011535.pub4. Cochrane Database Syst Rev. 2021. Update in: Cochrane Database Syst Rev. 2022 May 23;5:CD011535. doi: 10.1002/14651858.CD011535.pub5. PMID: 33871055 Free PMC article. Updated.
References
-
- Pandurangan S, Workman C, Nilsen K, Kumar S. Introduction to Marker-Assisted selection in wheat breeding. Accelerated breeding.of cereal crops. Springer Protocols Handbooks, 2021; 77–117.
-
- Li XD, Liu XM, Fan YH, Li ST, Yu MN, Qian MC, Chen YL, et al. Development of a target capture sequencing SNP genotyping platform for genetic analysis and genomic breeding in rapeseed. Crop J. 2023;11:499–510.
MeSH terms
Substances
Grants and funding
- jxsq2023102020/Jiangxi Province Talent Plan
- 2024YFD1200504/The National Key Research and Development Program of China
- grant number 2021C02067-6/Zhejiang Science and Technology Major Program on Agricultural New Variety Breeding-Tea Plant
- grant number LZ24C160003/the Zhejiang Provincial Natural Science Foundation of China
- grant number1610212022009/the Fundamental Research Fund for Tea Research Institute of the Chinese Academy of Agricultural Sciences
LinkOut - more resources
Full Text Sources
