. 2025 Jul 2;23(1):729.
doi: 10.1186/s12967-025-06754-2.

DSG3 promotes bladder cancer growth and metastasis via AKT/GSK3β/β-catenin pathway

Affiliations

DSG3 promotes bladder cancer growth and metastasis via AKT/GSK3β/β-catenin pathway

Tao Wang et al. J Transl Med. .

Abstract

Background: The high metastasis rate is the primary contributor to the high mortality rate associated with muscle-invasive bladder cancer (MIBC). Therefore, elucidating the mechanisms involved and identifying potential therapeutic targets are crucial for improving the overall prognosis of bladder cancer (BLCA).

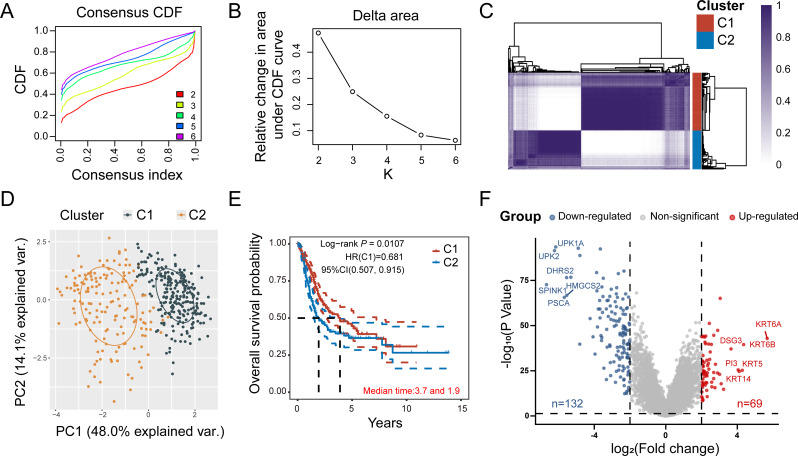
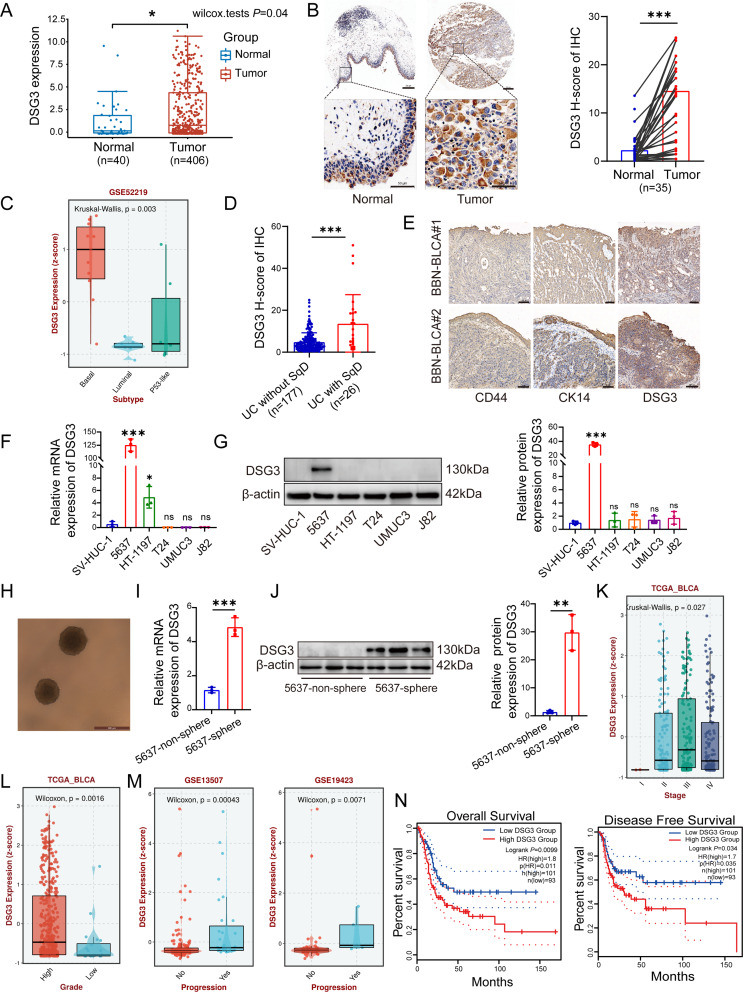
Methods: We used consensus clustering and differential gene expression analyses to identify the key gene desmoglein 3 (DSG3). Subsequently, we examined the expression of DSG3 in BLCA and its association with the clinical characteristics and prognosis. Comprehensive in vitro and in vivo experiments were conducted to elucidate the functions of DSG3 and the reasons behind the upregulation of DSG3 in BLCA, as well as to investigate the mechanisms by which DSG3 promotes metastasis.

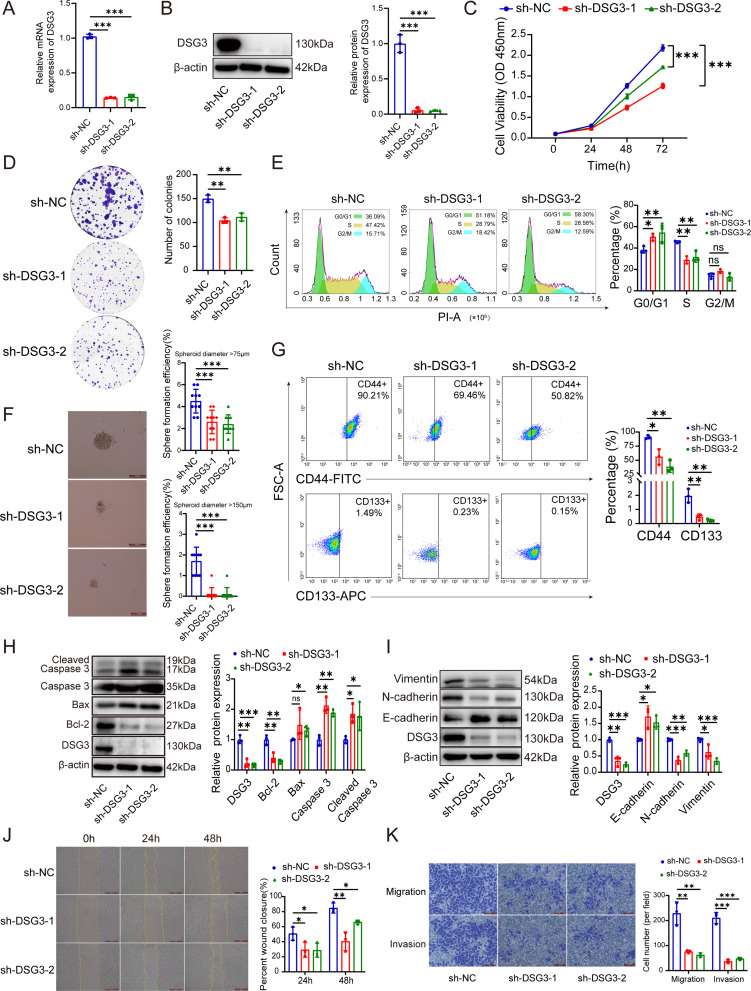
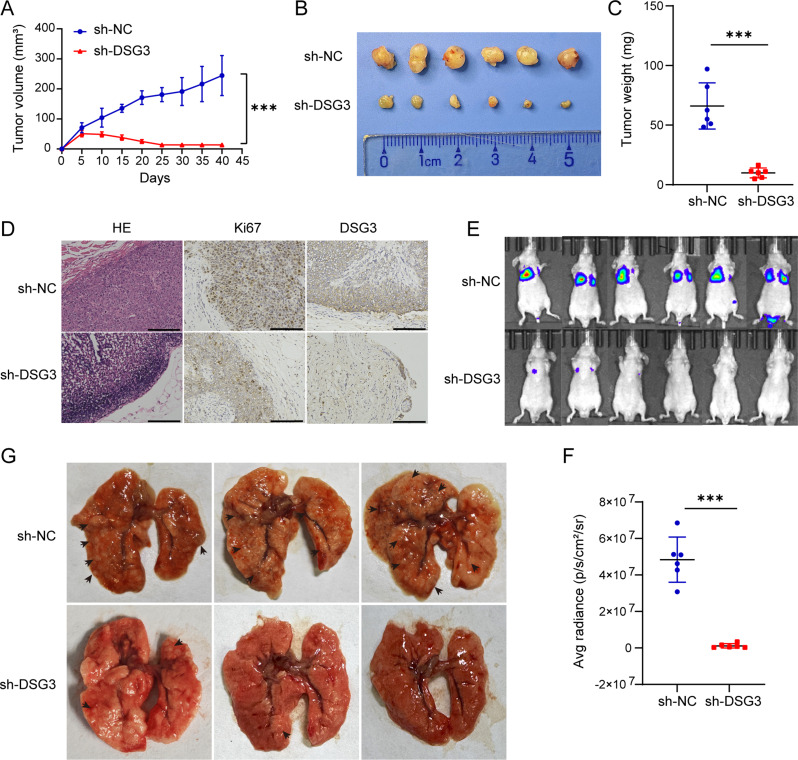
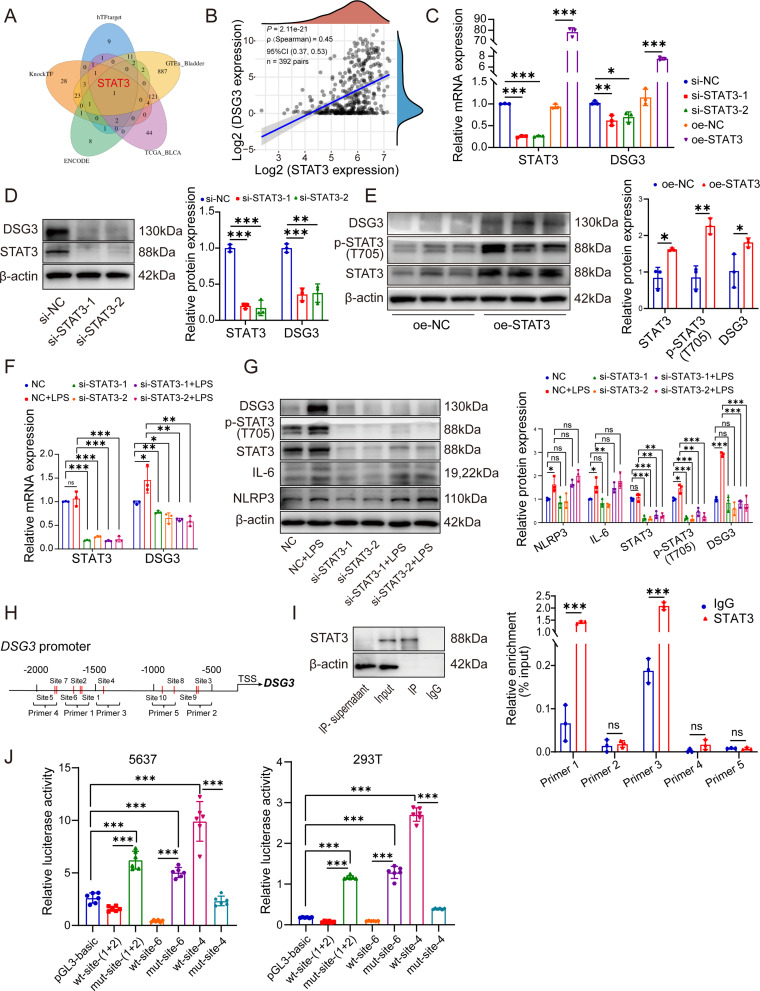
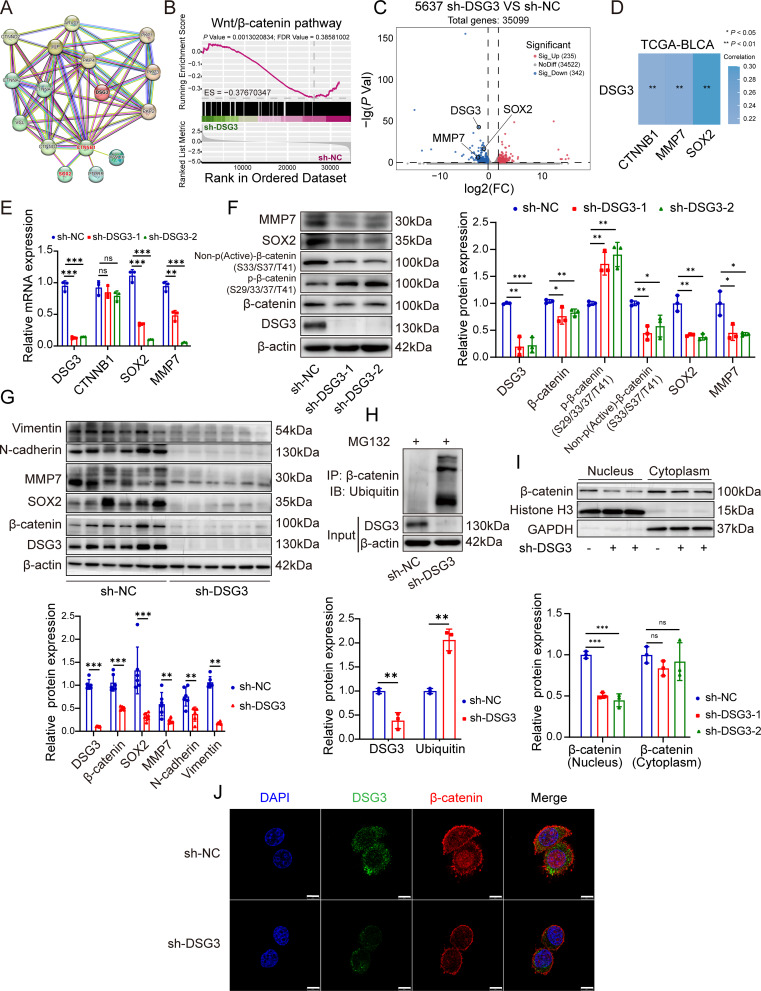
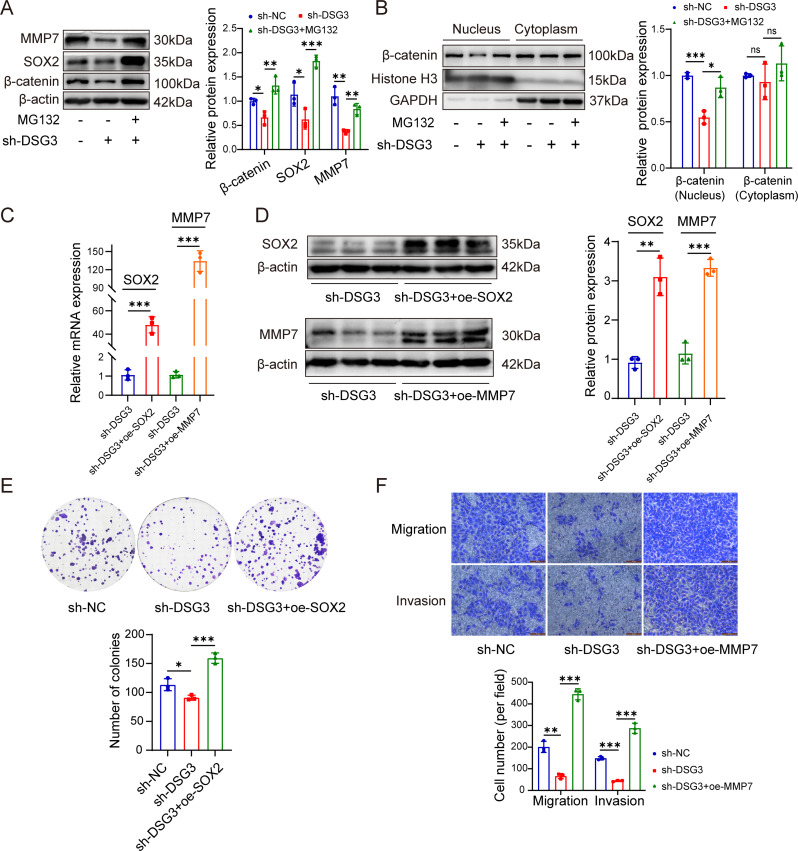
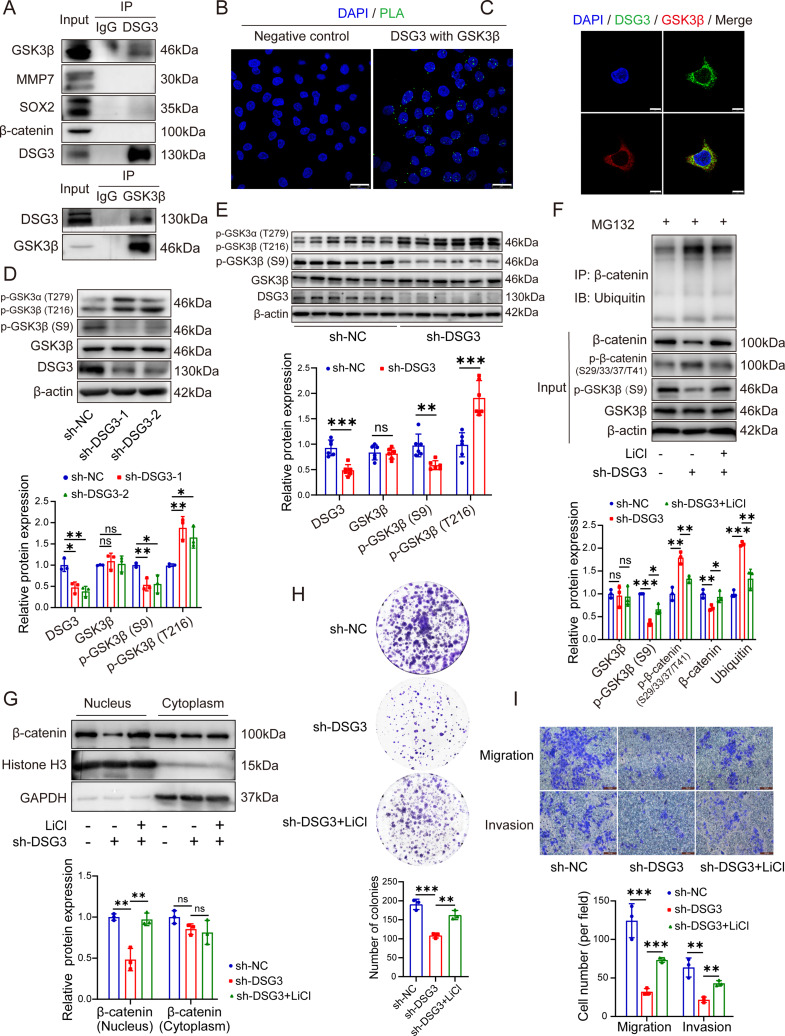
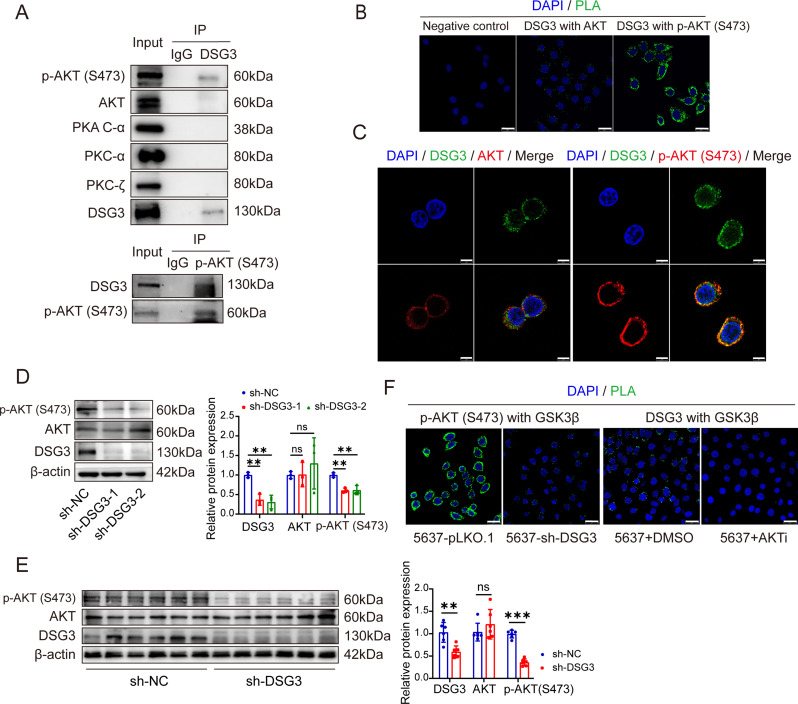
Results: DSG3 was markedly upregulated in BLCA, particularly in the basal/squamous (Ba/Sq) subtype. Importantly, elevated DSG3 levels demonstrated a strong association with aggressive tumor behavior and poorer clinical outcomes. Functional experiments revealed that DSG3 knockdown significantly impeded cancer stemness characteristics, epithelial-mesenchymal transition (EMT), migration, and invasion capabilities in vitro, whereas in vivo studies showed marked reductions in tumorigenesis and lung metastasis. Mechanistic investigations indicated that STAT3 transcriptionally activated DSG3 expression in BLCA cells. Downstream pathway analysis further showed that DSG3 promoted AKT phosphorylation, thereby inhibiting GSK3β activity. This molecular pathway promoted β-catenin nuclear translocation, thereby triggering transcriptional upregulation of SOX2 and MMP7 expression, ultimately mediating BLCA progression.

Conclusion: Our study demonstrates a novel mechanism by which DSG3 enhances cancer stemness, EMT, migration, and invasive capabilities through upregulation of SOX2 and MMP7 expression through the AKT/GSK3β/β-catenin pathway, ultimately leading to growth and metastasis of BLCA. This study elucidated the role of DSG3 in BLCA and its mechanism in activating the Wnt/β-catenin signaling pathway. We anticipate this study will identify potential biomarkers for predicting progression and for assessing prognosis. Furthermore, this study introduced a novel intervention target for BLCA treatment.


Conflict of interest statement

Declarations. Ethical approval and consent to participate: The study was conducted in accordance with the Declaration of Helsinki, and approved by the Research and Clinical Trial Ethics Committee of the First Affiliated Hospital of Zhengzhou University, China, (approval number: 2023-KY-1216-004). The animal study protocol was approved by the Life Science Ethics Review Committee of Zhengzhou University, (approval number: ZZUIRB2022-143). Patient’s specimen and clinical case information were collected following the declaration of Helsinki and Istanbul. Written informed consent was obtained from all the participants or legal guardians. The study was conducted with archived specimens. Consent for publication: All patient data were fully anonymized prior to analysis, and no individual identifiers were retained. Therefore, consent for publication was not required as per institutional guidelines and international ethical standards. Competing interests: The authors have declared that no competing interest exists.

Figures

Fig. 1
Fig. 1
Identification of the upregulated differential gene DSG3 in the BLCA Ba/Sq subtype. (A-C) The results of the consensus clustering analysis, based on luminal subtype and Ba/Sq subtype markers for BLCA samples in the TCGA database, are presented as the CDF curve (A), CDF Delta area curve (B), and heatmap of consensus clustering results (C). In consensus clustering, the Delta area curve illustrates the change in the area under the CDF curve for each category number k relative to k-1. The horizontal axis represents category number k, whereas the vertical axis indicates the relative change in the area under the CDF curve. (D) PCA results based on gene expression data. (E) Kaplan-Meier survival analysis for Cluster 1 and 2 groups in the TCGA database. (F) Volcano plot of differentially expressed genes between Clusters 1 and 2
Fig. 2
Fig. 2
DSG3 is highly expressed in BLCA and associated with poor prognosis. (A and B) Expression of DSG3 in BLCA and normal bladder tissues: (A) DSG3 mRNA expression levels in samples from TCGA database (BLCA samples, n = 406; normal bladder tissues, n = 19) and GTEx database (normal bladder tissues n = 21); (B) IHC analysis of DSG3 protein expression in BLCA tissue microarray samples (n = 35) (scale bar: 200 μm, zoomed scale bar: 50 μm). (C-E) Expression levels of DSG3 in the Ba/Sq subtype of BLCA; (C) DSG3 expression levels in the luminal, basal, and p53-like subtypes of BLCA in the GSE52219 dataset; (D) IHC analysis of DSG3 protein expression in BLCA tissue microarray samples from UC without SqD (n = 177) and UC with SqD (n = 26); (E) IHC analysis of CD44, CK14, and DSG3 protein expression in the BBN-induced BLCA in mice (n = 2) (scale bar: 100 μm). (F and G) mRNA (F) and protein (G) expression levels of DSG3 in the normal urinary epithelial cell line SV-HUC-1 and the BLCA cell lines 5637, HT-1197, T24, UMUC3, and J82 (vs. SV-HUC-1). (H) Spheroids from 5637 cells were cultured in a serum-free suspension (scale bar: 500 μm). (I) mRNA and (J) protein expression levels of DSG3 in the 5637 cell spheroids. (K-M) Correlation analysis of DSG3 with the clinical characteristics of BLCA staging (K), grading (L), and tumor progression (M) using data from TCGA and GEO databases. (N) Kaplan-Meier survival curve analysis for OS and DFS in BLCA samples with high and low expression of DSG3 in TCGA database. Kaplan-Meier survival curve comparing top 25% vs. bottom 25% expressers. ns: not statistically significant, *P < 0.05, **P < 0.01, and ***P < 0.001
Fig. 3
Fig. 3
DSG3 promotes cancer stemness, EMT, migration, and invasion capabilities of BLCA in vitro. (A) RT-qPCR validation of the knockdown efficiency of DSG3 at the mRNA level. (B) WB analysis confirmed the knockdown efficiency of DSG3 at the protein level. (C) The CCK-8 proliferation assay was used to evaluate the activity of 5637 cells at 0, 24, 48, and 72 h post-DSG3 knockdown. (D) The plate colony formation assay assessed the proliferative capacity of 5637 cells following DSG3 knockdown. (E) The changes in the cell cycle of 5637 cells after the knockdown of DSG3 were detected using flow cytometry. (F) In the 5637 cells spheroid formation experiment, spheroid formation efficiency was calculated based on the number of cell spheroids with diameters > 75 and > 150 μm relative to the original cell count (scale bar: 100 μm). (G) Flow cytometry was performed to evaluate the proportions of CD44 and CD133 subpopulations in the sh-NC group and sh-DSG3 group of 5637 cells. (H) WB analysis of apoptosis-related protein expression in 5637 cells after DSG3 knockdown. (I) WB analysis was used to evaluate the expression levels of EMT-related proteins. (J) The wound-healing assay investigated the cell migration capability (scale bar: 500 μm). (K) Transwell assay to assess the invasion and migration abilities of the cells (scale bar: 100 μm). ns: not statistically significant, *P < 0.05, **P < 0.01, and ***P < 0.001. vs. sh-NC group
Fig. 4
Fig. 4
DSG3 promotes tumorigenesis and lung metastasis in vivo. (A) The growth curve was plotted based on the volume of the subcutaneous tumors in nude mice. (B) Tumor images taken 40 days after subcutaneous tumor formation in the nude mice. (C) Comparison of the weights of the subcutaneously transplanted tumors between the two groups. (D) HE staining and IHC analyses of Ki67 and DSG3 expression in subcutaneously transplanted tumors (scale bar: 275 μm). (E and F). The bioluminescence signal (E) and quantitative data (F) of lung metastasis in nude mice were detected using the IVIS imaging system. (G) Tumor-bearing lung tissue with a black arrow indicating the metastatic nodules. ***P < 0.001. n = 6/group. vs. sh-NC group
Fig. 5
Fig. 5
STAT3 upregulates the expression of DSG3 at the transcriptional level. (A) Transcription factors bound to the DSG3 promoter region were identified by intersecting data from multiple databases, including hTFtarget, KnockTF, ENCODE, TCGA, and GTEx. (B) Correlation between the gene expression of STAT3 and DSG3 in BLCA. (C) The mRNA level of DSG3 was assessed following knockdown or overexpression of STAT3. (D and E) The protein expression levels of DSG3 were evaluated after silencing (D) and overexpressing (E) STAT3. (F and G) Changes in the expression of DSG3 mRNA and protein were detected using RT-qPCR (F) and WB analysis (G) after LPS (10 µg/mL, 24 h) induction, with or without silencing STAT3. (H) The JASPAR database predicted 10 potential binding sites between STAT3 and the DSG3 promoter region, and five pairs of ChIP-qPCR primers were designed for this purpose. (I) Efficiency of IP during the ChIP experiment. ChIP-qPCR results indicated that primers 1 and 3 exhibited binding (n = 3/group, vs. IgG group). (J) Dual-luciferase reporter gene experiments were conducted in 5637 and 293T cell lines to verify the binding sites and transcriptional activity, with comparisons made between the 2nd, 4th, and 6th groups against the 1st group (n = 6/group). ns: not statistically significant, *P < 0.05, **P < 0.01, and ***P < 0.001
Fig. 6
Fig. 6
DSG3 regulates the expression of SOX2 and MMP7 through the β-catenin signaling pathway. (A) Results of PPI analysis using the STRING database. (B and C) Differentially expressed genes following RNA transcriptome sequencing in 5637 cells with DSG3 knockdown. (B) GSEA was used to assess the correlation between differentially expressed genes and the Wnt/β-catenin signaling pathway. (C) A volcano plot illustrating the differentially expressed genes SOX2 and MMP7, which are associated with the Wnt/β-catenin pathway. (D) Spearman correlation analysis to evaluate the relationship between DSG3 and the expression of CTNNB1, MMP7, and SOX2 genes in BLCA samples from TCGA database. (E) RT-qPCR and (F) WB analysis to verify the changes in the expression of downstream target genes following DSG3 knockdown in 5637 cells (n = 3/group). (G) Subcutaneous tumor tissues from nude mice were collected to extract total protein, and WB analysis was performed to confirm the expression of the relevant proteins (n = 6/group). (H) WB analysis to verify changes in the ubiquitination level of β-catenin following DSG3 knockdown in 5637 cells. (I) Nuclear-cytoplasmic fractionation assay to detect alterations in the nuclear entry of β-catenin after DSG3 knockdown in 5637 cells. (J) IF to assess the changes in the nuclear entry of β-catenin after DSG3 knockdown in 5637 cells (scale bar: 10 μm). ns: not statistically significant, *P < 0.05, **P < 0.01, and ***P < 0.001
Fig. 7
Fig. 7
Rescue experiment demonstrates that DSG3 regulates the β-catenin/SOX2-MMP7 pathway, influencing the BLCA phenotype. (A) WB analysis confirmed the expression levels of β-catenin, SOX2, and MMP7 following the rescue experiment with the addition of MG132. (B) In the rescue experiment, the nuclear-cytoplasmic fractionation assay verified the alteration in the nuclear translocation of β-catenin after the addition of MG132. (C and D) Overexpression of SOX2 and MMP7, respectively, in the DSG3 knockdown 5637 stable cell line, with the efficiency of overexpression assessed through RT-qPCR (C) and WB analysis (D). (E) The plate cloning assay evaluates the impact of SOX2 overexpression on the proliferation of 5637 cells post-DSG3 knockdown. (F) The transwell assay examined the effect of MMP7 overexpression on the invasion and migration of 5637 cells after DSG3 knockdown (scale bar: 100 μm). ns: not statistically significant, *P < 0.05, **P < 0.01, and ***P < 0.001
Fig. 8
Fig. 8
The activity of GSK3β, regulated by DSG3, affects β-catenin phosphorylation. (A) Co-IP results demonstrated an interaction between DSG3 and GSK3β at the protein level. (B) The PLA experiments further confirmed this interaction (scale bar: 25 μm). (C) IF colocalization verified the colocalization of DSG3 and GSK3β (scale bar: 10 μm). (D and E) WB analysis detects changes in GSK3β and its phosphorylation levels following DSG3 knockdown in 5637 cells (D) and subcutaneous tumor tissues (E). (F) After DSG3 knockdown, the GSK3β inhibitor LiCl (10 mM, 24 h) was applied and the level of β-catenin ubiquitination was subsequently assessed. (G) β-catenin nuclear translocation was measured following DSG3 knockdown and LiCl application. (H) Plate colony formation assay was conducted to evaluate the effect of LiCl on the proliferation of 5637 cells post-DSG3 knockdown. (I) Transwell assays were performed to assess the effects of LiCl on the invasion and migration of 5637 cells after DSG3 knockdown (scale bar: 100 μm). ns: not statistically significant, *P < 0.05, **P < 0.01, and ***P < 0.001
Fig. 9
Fig. 9
DSG3 regulates the activity of GSK3β by promoting AKT activation. (A-C) The protein interaction between DSG3 and p-AKT-S473 was verified through co-IP (A) and PLA experiments (B) (scale bar: 25 μm). In addition, the colocalization of DSG3 and p-AKT-S473 was further confirmed by IF (C) (scale bar: 8 μm). (D and E) WB analysis to assess changes in AKT and p-AKT-S473 protein levels following the knockdown of DSG3 in 5637 cells (D) and subcutaneous tumor tissues (E). (F) PLA experiment to examine the impact of DSG3 knockdown on the interaction between p-AKT-S473 and GSK3β as well as the alteration in the interaction between DSG3 and GSK3β following the application of the AKT inhibitor (scale bar: 25 μm). ns: not statistically significant; **P < 0.01

Similar articles

References

    1. Filho AM, Laversanne M, Ferlay J, Colombet M, Pineros M, Znaor A, Parkin DM, Soerjomataram I, Bray F. The Globocan 2022 cancer estimates: data sources, methods, and a snapshot of the cancer burden worldwide. Int J Cancer. 2024;11. 10.1002/ijc.35278. - PubMed
    1. Siegel RL, Kratzer TB, Giaquinto AN, Sung H, Jemal A, Cancer statistics. 2025. CA: A Cancer Journal for Clinicians. 2025;75:10–45. 10.3322/caac.21871 - PMC - PubMed
    1. Lopez-Beltran A, Cookson MS, Guercio BJ, Cheng L. Advances in diagnosis and treatment of bladder cancer. BMJ. 2024;384:22. 10.1136/bmj-2023-076743. - PubMed
    1. Samnani S, Veitch ZWN, Kaiser J, Stecca C, Alqaisi H, North SA, Sridhar SS, Alimohamed NS. Trends over time in survival in patients with urothelial carcinoma in the real-world: a multicenter analysis. J Clin Oncol. 2021;39:2. 10.1200/JCO.2021.39.6_suppl.412.
    1. Warrick JI, Sjodahl G, Kaag M, Raman JD, Merrill S, Shuman L, Chen G, Walter V, DeGraff DJ. Intratumoral heterogeneity of bladder cancer by molecular subtypes and histologic variants. Eur Urol. 2019;75:18–22. 10.1016/j.eururo.2018.09.003. - PubMed

MeSH terms

LinkOut - more resources