

Polygenic and pharmacogenomic contributions to medication dosing: a real-world longitudinal biobank study
- PMID: 40605081
- PMCID: PMC12220086
- DOI: 10.1186/s12967-025-06782-y
Polygenic and pharmacogenomic contributions to medication dosing: a real-world longitudinal biobank study
Abstract
Background: Understanding interindividual variability in medication dosing is central to precision medicine. Despite significant pharmacogenomic (PGx) insights into key biological pathways influencing drug response, the polygenic contribution to dose variability and the potential of electronic health records for maintenance dose estimation remain largely unexplored.
Methods: We leveraged longitudinal drug purchase data linked to the Estonian Biobank (N = 212,000) to derive individual-level daily doses per purchase as well as median and maximum doses as consolidated metrics across purchases for cardiovascular and psychiatric drugs: statins, warfarin, metoprolol, antidepressants, and antipsychotics. Associations with polygenic scores (PGSs) for 16 traits were assessed using linear mixed models and multivariable regression with a forward stepwise approach. Genome-wide association studies (GWAS) were followed by gene set enrichment analyses for known PGx genes.
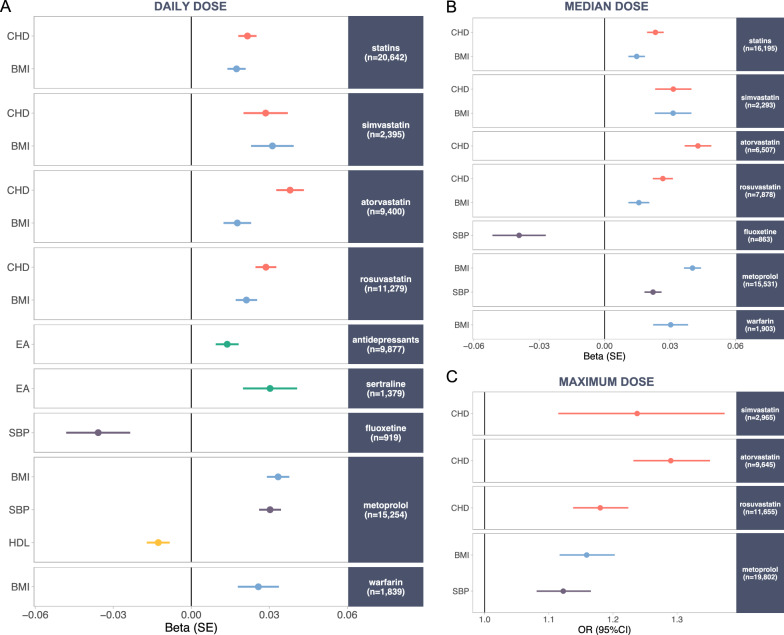
Results: Sample sizes ranged from 684 (antipsychotics) to 20,642 (statins), with median doses reflecting typical maintenance doses. Trait-specific PGSs were significant for the daily dose of statins (coronary heart disease PGS, β = 0.02, P = 5.9 × 10⁻¹⁰) and metoprolol (systolic blood pressure PGS, β = 0.03, P = 7.5 × 10⁻¹³). The PGS for body mass index was linked to daily doses of statins (β = 0.02, P = 6.4 × 10⁻⁷), metoprolol (β = 0.03, P = 1.4 × 10⁻¹⁴), and warfarin (β = 0.03, P = 0.001), whereas the PGS for educational attainment showed opposing associations with statins (β = - 0.01, P = 5.9 × 10⁻⁴) and antidepressants (β = 0.01, P = 0.002). Median and maximum doses yielded similar, though generally weaker, associations. GWAS confirmed signals for metoprolol (CYP2D6, P = 1.1 × 10⁻²⁰) and warfarin (CYP2C9, P = 8.9 × 10-60; VKORC1, P = 4.2 × 10-148), as well as enrichment of PGx signals for individual statins (P = 0.02 for simvastatin, P = 0.03 for atorvastatin). Associations remained significant after adjusting for disease-specific PGSs, suggesting independent contributions of PGx loci.
Conclusions: These findings illustrate the feasibility and value of leveraging real-world electronic health records to derive pharmacologically meaningful medication dosing phenotypes. Both polygenic and pharmacogenomic signals contribute to dose variability, underscoring their potential utility in personalized prescribing strategies.
Keywords: Biobank; Electronic Health Records; Genome-wide association study; Medication dosing; Pharmacogenomics; Polygenic scores; Real-world health data.
© 2025. The Author(s).
Conflict of interest statement
Declarations. Ethics approval and consent to participate: The current study was approved by the Estonian Committee on Bioethics and Human Research at the Estonian Ministry of Social Affairs (24 March 2020, nr 1.1-12/624) and carried out using data according to release U16 from EstBB. All EstBB participants have signed a broad informed consent. Consent for publication: Not applicable. Competing interests: The authors declare that they have no competing interests.
Figures


References
-
- Pirmohamed M. Pharmacogenomics: current status and future perspectives. Nat Rev Genet. 2023;24:350–62. - PubMed
-
- Zanger UM, Schwab M. Cytochrome P450 enzymes in drug metabolism: regulation of gene expression, enzyme activities, and impact of genetic variation. Pharmacol Ther. 2013;138:103–41. - PubMed
MeSH terms
Grants and funding
LinkOut - more resources
Full Text Sources
