. 2025 Dec;22(1):1-20.
doi: 10.1080/15476286.2025.2502719. Epub 2025 Jul 2.

Novel non-coding FOXP3 transcript isoform associated to potential transcriptional interference in human regulatory T cells

Affiliations

Novel non-coding FOXP3 transcript isoform associated to potential transcriptional interference in human regulatory T cells

Marcos Cases et al. RNA Biol. 2025 Dec.

Abstract

CD4+ regulatory T cells (TREGS) are critical for immune tolerance and the transcription factor Forkhead Box P3 (FOXP3) plays a crucial role in their differentiation and function. Recently, an alternative promoter has been reported for FOXP3, which is active only in TREGS and could have profound implications for the output of the locus, and therefore, for the functionality of these cells. By direct RNA sequencing we identified multiple novel FOXP3 transcriptional products, including one relatively abundant isoform with an extended 5' UTR that we named 'longFOXP3'. Western blotting, analysis of public mass spectrometry data, and transfection of in vitro transcribed RNA suggested that longFOXP3 is not coding. Furthermore, we show using two distinct RNA single-molecule fluorescence in situ hybridization technologies that transcription from the upstream promoter correlates with decreased levels of FOXP3 at the mRNA and protein levels. Together, we provide compelling evidence that the transcriptional output of the human FOXP3 locus is far more complex than that of the current annotation and warrants a more detailed analysis to identify coding and non-coding transcript isoforms. Furthermore, the alternative promoter may interfere with the activity of the canonical promoter, evoking intragenic transcriptional interference, and in this way, fine-tune the levels of FOXP3 in human TREGS.

Keywords: FOXP3; TREG; alternative promoter; transcript isoform; transcriptional interference.


Conflict of interest statement

No potential conflict of interest was reported by the author(s).

Figures

Figure 1.
Figure 1.
DRS revealed novel polyadenylated FOXP3-associated transcripts in expanded human TREG transcriptomes. A) IGV browser screenshot of the human FOXP3 locus displaying nanopore DRS data. Alternative promoter of FOXP3, as described and used in reporter assays by Schmidl et al. (track 1), lncRNA FLICR isoform 3 (track 2), and full-length FOXP3 mRNA (track 3) are included as visual references for structure and genomic location. Track 4 shows a representative novel transcripts emanating from the canonical promoter. Tracks 5 and 6 show representative novel transcripts originating from the alternative promoter. Those that extended until the last annotated exon of FOXP3 were named longFOXP3 (track 6). Track 7 shows a selection of DRS reads. Due to limited space, only one out of four biological replicates and a small fraction of all relevant reads are shown. Please refer to S1 file for a merged BAM file containing all FOXP3 reads from the totality of the datasets. Canonical FOXP3 transcripts are colored light-blue, while novel transcripts are highlighted in bold. B) Approximate quantification of novel transcripts relative to canonical FOXP3 transcripts after selecting relevant reads. C) IGV screenshot zoomed into the annotated site of cleavage and polyadenylation of FOXP3 (red circle). A few relevant reads are displayed to exemplify the tight distribution around this genomic position. D) Distribution of the poly(A) tail length of canonical and longFOXP3 transcripts. Non-parametric Mann-whitney test. E) LongFOXP3 is mostly present in two splice variants: full-length and delta 2. F) Schematic representing the complexity of the alternative promoter. CAGE peak 3 was chosen as the representative TSS of longFOXP3 based on its reported CAGE score. (B) Values on top of each column are the median for the calculated ratios. (B) and (E), black dots correspond to 1-week-old TREG cultures, while red dots correspond to over-4-week-old cultures.
Figure 2.
Figure 2.
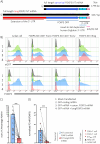
LongFOXP3 does not code for a novel FOXP3 proteoform. A) Scheme summarizing the coding potential of longFOXP3. Full-length longFOXP3 RNA is represented at the top. No 5´-cap nor 3´-poly(A) tail were included, annotated exons are indicated with numbers, and the 5´-UTR extension is represented by a red rectangle. The novel transcript could code for different FOXP3 proteoforms (long arrows): canonical transcription factor and predicted N-terminal extended proteoforms. Microproteins (mpro) that could be decoded from short upstream ORFs are also depicted and colour-coded according to their TIS (green arrow: CUG, orange arrow: AUG). B) Scheme representing both reported and predicted full-length FOXP3 proteoforms, and the antibodies used. Two monoclonal anti-human FOXP3 antibodies were used for WB. The antibody clone and the position of its epitope within the canonical FOXP3 protein (including the exons that code for that part of the protein) are colour-coded. C) Western blots of cultured TREGS. The existence of the predicted longFOXP3 proteoforms was tested in four biological replicates (HD1 – HD4). Jurkat cells were used as a biological negative control. To control for background signals, the samples were incubated with and without the primary antibody. The blots were first analysed using the antibody clone 236A/E7, and then stripped for analysis using the antibody clone 150D/E4. The blue rectangle on the blots highlights those bands interpreted as the canonical FOXP3 protein, whereas the red rectangle encircles the position in which the predicted longFOXP3 proteoforms are expected. The signal observed in lane 9 inside the red rectangle is attributed to the tweezers used to handle the blotted membrane.
Figure 3.
Figure 3.
LongFOXP3 does not encode any FOXP3 proteoform. A) Schematic representation of the FOXP3 IVT constructs used for the overexpression assay. The thick black arrows represent the final product resulting from the IVT reaction. These are dissected into their constituting elements in the lines below. B) Results of an exemplary overexpression experiment to test the capacity of longFOXP3 to be decoded into a FOXP3 proteoform. In this case, Jurkat cells and different FOXP3KO T cells were electroporated with IVT RNA emulating the full-length variant of the canonical or the longFOXP3 transcripts. The cells were co-transfected with a GFP-coding IVT mRNA for control of delivery and translation competence. Non-toxic equimolar amounts of the canonical and longFOXP3 transcripts were transfected (S7 Fig). C) Normalized Fold change in the percentage of FOXP3+ cells upon transfection with canonical FOXP3 or longFOXP3 constructs. D) Normalized Fold-change in the MFI of FOXP3 in the living singlet gate when cells were transfected with canonical FOXP3 or longFOXP3 constructs. Mock, mock-transfected. MFI, median fluorescence intensity. The MFI value corresponds to the entire living singlet gate and not to the FOXP3+ subpopulation. Non-parametric paired Wilcoxon test. *** p < 0.001.
Figure 4.
Figure 4.
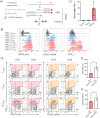
The alternative promoter of FOXP3 appears TREG-exclusive, but it is not active in every cell in culture. A) Scheme explaining the amplification strategy used by both the PrimeFlow and RNAscope assays and summarizing the RNA species expected to be detected using both PrimeFlow probes, ordered from left to right in terms of decreasing abundance, as observed in the DRS experiment (Figure 1). The panel design allowed the co-detection of total FOXP3 protein, total FOXP3 mRNA, and transcriptional activity of the alternative promoter. B) Expanded tnTREG cells were reactivated under normal culture conditions. In parallel, expanded naive-like TCONV cells were reactivated either in the presence of rhIL-2 or rhIL-2 and rhTGF-b1 (iTREG condition). FACS plot are pre-gated on living RPL13a+ singlets and different marker combinations according to the sample. A total of four tnTREG cultures were analyzed; two are shown here. Histograms of all relevant targets analyzed across the three (CD4+) T cell cultures. Black histograms: reactivated TCONV; light blue histograms: iTREG cells; red histograms: tnTREG cultures. C) Percentage of UPA+ cells across T cell cultures. D) Contour plots showing how the activity of the upstream promoter correlates with the other targets (FOXP3 protein and total FOXP3 mRNA). E) MFI of FOXP3 protein or F) MFI of FOXP3 mRNA in cells that either showed transcriptional activity from the upstream promoter or did not. Only the values for the tnTREG cultures are plotted. E-F) Nonparametric unpaired Mann-Whitney test. * p<0.05.
Figure 5.
Figure 5.
The alternative promoter is more active in naive TREG cultures than in their memory counterpart, and short and long transcripts can be found in the nucleus and the cytoplasm. Four T cell cultures (naive (−like) TCONV, memory TCONV, (truly-) naive TREG, and memory TREG) were analyzed with the RNAScope assay using the total FOXP3 mRNA and UPA_Scope probes described in S10 Fig. A) Confocal microscopy overlay of total FOXP3 mRNA (magenta), UPA_Scope (yellow), and DAPI (blue) in representative zoomed-in regions showing T cells from the four different cultures analysed (from left to right, scale represents 5 µm). B) Total number of cells analysed per T cell culture. C) Proportion of cells that showed total FOXP3 mRNA speckles in each T cell culture. D) Proportion of cells that showed UPA_Scope speckles in each culture condition. E) Number of total FOXP3 mRNA speckles per cell in naive TREG cultures from different biological replicates. F) Number of UPA_Scope speckles per cell in naive TREG cultures from different biological replicates. G) Proportion of UPA_Scope speckles that co-localize with total FOXP3 mRNA speckles in each cell type. These events were interpreted as longFOXP3 transcripts. H) Proportion of all total FOXP3 mRNA speckles with intra-nuclear localization. I) Proportion of all UPA_Scope speckles with intranuclear localization. J) Proportion of all co-localization events with intranuclear localization. B) – J) Values at the top or bottom of each column represent the median of the group for the plotted variable of the respective condition.
Figure 6.
Figure 6.
Potential non-adenylated FOXP3 transcript isoforms in expanded human TREGS. A) IGV browser screenshot displaying sequencing coverage of the human FOXP3 locus using 2nd and 3rd generation sequencing technologies applied to the same RNA sample from human tnTREG cultures. For genomic location and structural reference: track 1, alternative promoter as described and used in reporter assays by Schmidl et al.; track 2: lncRNA FLICR isoform 3; track 3, canonical full-length FOXP3 mRNA isoform; track 4, representative novel transcript from canonical promoter (S3 Fig); track 5, representative novel short upstream transcript; and track 6, full-length longFOXP3. Track 7 displays the coverage of the DRS experiment described in Figure 1 (pre-processing: poly(A)+ enrichment), while track 8 shows the coverage of the short-read RNA-seq experiment (pre-processing: ribo-depletion). The heights of the coverage tracks are the same. The red dotted line indicates the approximate maximum coverage for the region of possible transcription initiation for CAGE peak 1 observed with DRS. The black arrows indicate regions in which the coverage was lower in the NGS experiment. B) Ratio of longFOXP3 transcripts (co-localization events) to short upstream transcripts (UPA-only events) as observed in the RNAscope analysis (Figure 5G and Table 3). C) Plausible transcriptional model of the human FOXP3 locus. The upstream promoter outputs two classes of transcripts (represented by transcripts with a red 5´-cap): (i) non-adenylated RNAs that do not extend sufficiently into the FOXP3 gene to be simultaneously detected with the totalFOXP3 mRNA probe in addition to the UPA_Scope probe (green box), and (ii) polyadenylated RNAs that mostly extend until exon 11 of FOXP3 (longFOXP3), using the same PAS site as those FOXP3 transcripts originating from the canonical promoter (blue 5´-cap). Short poly(A)+ transcripts are also generated by the upstream promoter, but these are rare. Upstream non-poly(A) transcripts are more abundant than poly(A)+ transcripts generated from the same promoter, but are readily missed by the standard DRS protocol. For simplicity, the lncRNA FLICR is not included, novel transcripts originating from the canonical promoter are not discriminated, and the relative abundances between the different RNAs are only approximate.

References

    1. Zemmour D, Pratama A, Loughhead SM, et al. Flicr, a long noncoding RNA, modulates Foxp3 expression and autoimmunity. Proc Natl Acad Sci USA. 2017;114(17):E3472–E80. doi: 10.1073/pnas.1700946114 Epub 20170410. - DOI - PMC - PubMed
    1. Ono M. Control of regulatory T-cell differentiation and function by T-cell receptor signalling and Foxp3 transcription factor complexes. Immunology. 2020;160(1):24–37. doi: 10.1111/imm.13178 Epub 20200309. - DOI - PMC - PubMed
    1. Colamatteo A, Carbone F, Bruzzaniti S, et al. Molecular mechanisms controlling Foxp3 expression in health and autoimmunity: from epigenetic to post-translational regulation. Front Immunol. 2019;10:3136. doi: 10.3389/fimmu.2019.03136 Epub 20200203. - DOI - PMC - PubMed
    1. Du J, Wang Q, Yang S, et al. FOXP3 exon 2 controls T(reg) stability and autoimmunity. Sci Immunol. 2022;7(72):eabo5407. doi: 10.1126/sciimmunol.abo5407 Epub 20220624. - DOI - PMC - PubMed
    1. Robinson EK, Jagannatha P, Covarrubias S, et al. Inflammation drives alternative first exon usage to regulate immune genes including a novel iron-regulated isoform of Aim2. Elife. 2021;10. doi: 10.7554/eLife.69431 Epub 20210528. - DOI - PMC - PubMed

MeSH terms

LinkOut - more resources