. 2025 Sep;344(6):325-340.
doi: 10.1002/jez.b.23312. Epub 2025 Jul 3.

The Interplay of Ontogeny and Phylogeny at the Transcriptome Level of the Tetrapod Heart

Affiliations

The Interplay of Ontogeny and Phylogeny at the Transcriptome Level of the Tetrapod Heart

G A Cordero et al. J Exp Zool B Mol Dev Evol. 2025 Sep.

Abstract

The tetrapod heart is characterized by three chambers in amphibians and non-avian reptiles, as opposed to four in birds, crocodilians and mammals. We explored this diversity via the most phylogenetically comprehensive comparison of heart transcriptomes undertaken to date. Transcriptomes representing the ontogeny of heart compartmentalization (septation) in alligator, chicken, frog, mouse, lizard and turtle embryos exhibited a clear species-specific signal, which was driven by genes involved in heart contraction. During the stage dominated by septation-related tissue transformations, the most highly expressed genes shared by species originated before the tetrapods diversified and were related to septum morphogenesis, ventricular development, and chamber formation. The expression of septation-related genes did not adhere to phylogeny or heart chamber number, and genes differentially expressed across developmental stages within species varied in their evolutionary ages and predicted functions. We discuss how the acquisition of novel structures in some lineages, convergent evolution of four heart chambers, embryonic metabolism, microstructural variation, and ontogenetic shifts (heterochronies), collectively, provide insight into evolved and conserved patterns of transcriptome-level variation. These data serve as a resource to further stimulate evo-devo research on complex organ systems, such as the heart.

Keywords: comparative transcriptomics; evo‐devo; heart development; tetrapod embryology.


Conflict of interest statement

The authors declare no conflicts of interest.

Figures

Figure 1
Figure 1
(a ‐ left panel) von Baer's third law of embryology predicts that embryos of distantly related animal taxa are most similar in the middle (mid.) period of development and phenotypically diverge thereafter. (a ‐ right panel) The ‘transcriptomic hourglass’ model predicts interspecific gene expression divergence early and late in development, while including a “phylotypic period” in mid‐development wherein gene expression is the least variable owing to high embryonic similarity among species. (b) Early ontogeny is dominated by organ formation (organogenesis), that is, when major morphogenetic rearrangements are induced by gene‐gene, cell‐cell, and tissue‐tissue interactions (see dashed arrows). Inductive interactions intensify as organogenesis is nearly complete during mid‐development, which might explain the “phylotypic period.” (c) It was hypothesized that the gene expression profile of the developing heart adheres to the hourglass model when controlling for gene age (see transcriptome age index). Based on data from Cardoso‐Moreira et al. (2019), older genes should be more active as septation (see ventricular septum: VS) divides the heart chambers: Right atrium (ra), left atrium (la), right ventricle (rv), and left ventricle (lv). Concomitant with the septation of the atrium and ventricle is the septation of the outflow tract (oft), yielding the aorta (ao) and pulmonary artery (pa). (d) Representative tetrapods sampled: Mouse (gestation days [E] are shown); Chicken at Hamburger and Hamilton (HH; 1951) stages; Alligator at Ferguson (F; 1985) stages; Turtle at Cordero and Janzen (CJ; 2014) stages; Frog at Nieuwkoop and Faber (NF; 1994) stages. Mouse embryos are redrawn from Werneburg and Spiekman (2018), while frog tadpoles are redrawn from Faber and Nieuwkoop (1994). The HH18.5 and HH31 chicken embryos were redrawn from Nuñez‐León et al. (2021). The F10 and F16 embryos were based on images from Ferguson (1985). The approximately equivalent stages in frog were observed at early tadpole stages. Not shown are lizard embryos at stages 2, 7, and 10 of Sanger et al. (2008). ^ = Chamber count does not include the sinus venosus or ventricular “subchambers.”
Figure 2
Figure 2
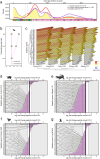
(a) Generalized principal component analysis on normalized and batch‐corrected read counts yielded a clear species‐specific signal, with species with four‐chambered hearts clustered along one extreme of the first dimension. *Lizard (Anole) transcriptomes (N = 1) for stages 2, 7, and 10 are included as an additional taxonomic refence. (b) Based on ordination of the 7957 tetrapod orthologs, the genes driving variation (positive/negative loadings) along the dimensions of the PCA are shown. (c) Enrichment map of “GO: Biological process” terms on the combined list of genes (N = 80) that comprised the top/bottom loadings. Nodes represent GO term gene sets (adj. p < 0.01; see Table S1) and edges represent the overlap among the gene sets, while cluster labels summarize how frequently a particular word is contained within GO term annotations (font size is proportional to the number of GO terms within a cluster). Not shown is the term GO:0090068 as it did not cluster together with other terms.
Figure 3
Figure 3
(a, b) Transcriptomes at heart stages characterized by septation in amniote tetrapods are plotted against that of the earliest‐branching tetrapod representative, that is, frog. Blue lines of isometry (slope = 1) and 95% confidence interval ellipses are shown. Genes in the upper 95th percentile in terms of expression (log2 counts) within a species and in frog are labeled within the yellow boxes. (e) Lists of highly expressed genes against frog are compared in an UpSet plot wherein common (dots connected by line) or unique genes per species are depicted. (f) 36 out of the 1987 highly expressed genes shared by amniotes was included within the list of 90 genes involved in heart septation. (g) The “GO: Biological process” terms enriched in the list of commonly shared highly expressed genes, with heart related terms highlighted (adj. p < 0.0001; see Table S1). (h) Heart‐related terms overrepresented when querying the “Human phenotypes” database (adj. p < 0.0001; see Table S1). Animal silhouettes were accessed through https://www.phylopic.org via creative commons licenses.
Figure 4
Figure 4
(a) Age distributions of all mouse genes, common highly expressed genes (relative to frog) in mouse and other amniotes, and septation genes shared by species. (b) The transcriptome age index across the sampled mouse stages was similar, but otherwise decreased when computed on data (N = 36,188 genes) that were not subjected to log2 transformation. (c) Hierarchical clustering of septation gene expression (log2 counts) during the species‐specific stages expected to be characterized by septation. Septation gene expression patterns are not predicted by chamber number or evolutionary relationships. (d–g) Expression fold changes against mouse in turtle, alligator, chicken, and frog. Genes are labeled if the fold changes were log2 > 1 or log2 < −1.
Figure 5
Figure 5
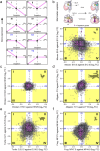
(a) Hypothetical gene expression patterns across three stages of development representing intervals before, during, and after septation. (b ‐ above) In mammalian development, atrial septation is characterized by the expansion of atrial septa (as 1°–2°) posterior to the cardiac cushions (cc). (b ‐ below) The ventricle then undergoes ventricular septation as evident by an incompletely formed ventricular septum (vs; left panel) which later expands until the right ventricle (rv) and left ventricle (lv) are subdivided. The right atrium (ra) and left atrium (la) are labeled. Four‐way plot depicted fold changes before (E9.5) against during septation (E12.5), as well as after (E16.5) versus during septation, in mouse. Quadrants and axes are labelled in accordance with expected gene expression patterns depicted in panel a. Genes within yellow boxes feature log2 > 1 or log2 < −1. Heart images were modified from http://pie.med.utoronto.ca/HTBG/. (c–f) Four‐way plots highlight dynamically expressed genes in nonmammalian species. Many genes adhered to pattern III, including some septation genes.
Figure 6
Figure 6
(a–e) Results of “GO: Biological process” enrichment (left) and gene age enrichment (right) tests on dynamically expressed genes identified in four‐way plots for each species. The top‐10 “GO: Biological process” terms are shown (adj. p < 0.01; see Table S2). The faded squares correspond to age enrichment tests that were p > 0.05. (f) Similarity matrix of “GO: Biological process” terms across species. N.S. = the Fisher's exact test was not significant. Numbers in cells correspond to p values.

Similar articles

References

    1. Anderson, R. H. , Spicer D. E., Brown N. A., and Mohun T. J.. 2014. “The Development of Septation in the Four‐Chambered Heart.” Anatomical Record 297, no. 8: 1414–1429. 10.1002/ar.22949. - DOI - PubMed
    1. Auer, P. L. , and Doerge R. W.. 2010. “Statistical Design and Analysis of RNA Sequencing Data.” Genetics 185, no. 2: 405–416. 10.1534/genetics.110.114983. - DOI - PMC - PubMed
    1. von Baer, K. E. (1828). Über Entwickelungsgeschichte der Thiere: Beobachtung und Reflexion (Vol. 1): Bornträger.
    1. Bray, N. L. , Pimentel H., Melsted P., and Pachter L.. 2016. “Near‐Optimal Probabilistic RNA‐Seq Quantification.” Nature Biotechnology 34, no. 5: 525–527. 10.1038/nbt.3519. - DOI - PubMed
    1. Bruneau, B. G. 2013. “Signaling and Transcriptional Networks in Heart Development and Regeneration.” Cold Spring Harbor Perspectives in Biology 5, no. 3: a008292. 10.1101/cshperspect.a008292. - DOI - PMC - PubMed

LinkOut - more resources