. 2025 Sep;45(9):1616-1635.
doi: 10.1161/ATVBAHA.124.322893. Epub 2025 Jul 3.

Lamin A/C Expression in Hematopoietic Cells Declines During Human Aging and Constrains Atherosclerosis in Mice

Affiliations

Lamin A/C Expression in Hematopoietic Cells Declines During Human Aging and Constrains Atherosclerosis in Mice

Marta Amorós-Pérez et al. Arterioscler Thromb Vasc Biol. 2025 Sep.

Abstract

Background: Aging is the primary risk factor for atherosclerosis, a degenerative process regulated by immune cells and the leading cause of death worldwide. Previous studies on premature aging syndromes have linked atherosclerosis to defects in A-type lamins, key nuclear envelope components. However, whether these defects influence atherosclerosis during normal aging remains unexplored. Here, we examined how aging affects lamin A/C expression in circulating leukocytes and investigated the impact of manipulating their expression in hematopoietic cells on their function and atherosclerosis progression.

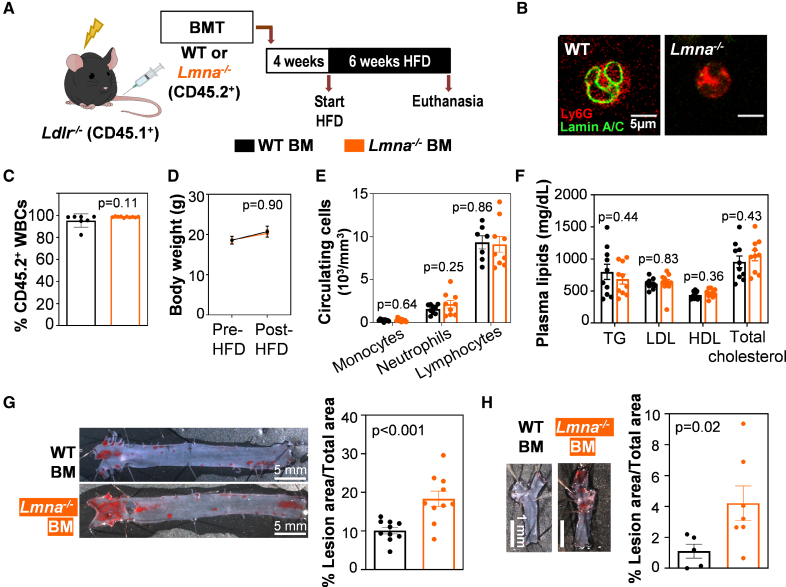
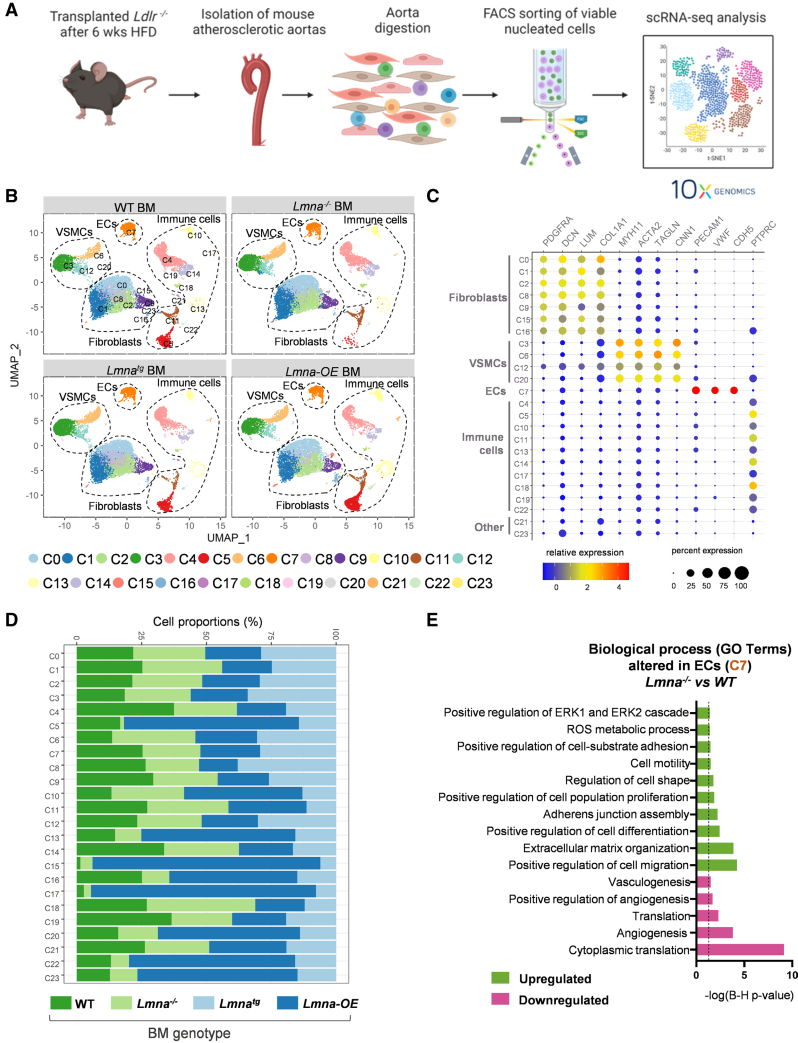
Methods: Flow cytometry assessed lamin A/C expression in human circulating leukocytes. Bone marrow from donor mice was transplanted into lethally irradiated, Ldlr-/--deficient mice to study leukocyte extravasation into the vessel wall via intravital microscopy in the cremaster muscle, and high-fat-diet-induced atherosclerosis via Oil Red O staining of the aorta and carotid arteries. Single-cell RNA sequencing of the aorta was conducted to identify transcriptional changes associated with hematopoietic cell lamin A/C gain-of-function or loss-of-function.

Results: Human aging is associated with lower levels of lamin A/C expression in blood-borne leukocytes. To evaluate the functional relationship between hematopoietic lamin A/C expression and atherosclerosis development, we used Lmna-null mice and Lmnatg mice, the latter being the first in vivo model of lamin A gain-of-function. Transplanting lamin A/C-deficient bone marrow into Ldlr-/- mice increased leukocyte extravasation into the vessel wall and accelerated atherosclerosis. Conversely, transplantation of bone marrow overexpressing lamin A into Ldlr-/- receptor mice reduced leukocyte extravasation and atherosclerosis. Single-cell RNA sequencing of atherosclerotic mouse aorta revealed that alterations to hematopoietic cell lamin A/C expression primarily modify the transcriptome of immune cell populations and endothelial cells, affecting their functionality.

Conclusions: We suggest that the age-related decline in lamin A/C expression in blood-borne immune cells contributes to increased leukocyte extravasation and atherosclerosis, highlighting lamin A/C as a novel regulator of age-related atherosclerosis.

Keywords: aging; atherosclerosis; cardiovascular diseases; inflammation; lamin type A; single-cell gene expression analysis.


Conflict of interest statement

H. Bueno received consulting/speaking fees from AstraZeneca, Novartis, Novo Nordisk, and Organon, unrelated to the current study. The funders had no role in the design of the study, the collection, analysis, or interpretation of the data, or the reporting of the study. The other authors report no conflicts.

Figures

Figure 1.
Figure 1.
Lamin A/C expression in human peripheral blood leukocytes declines with age. Flow cytometry analysis of lamin A/C expression in human blood populations from young and old individuals. Statistical significance was determined by robust linear regression after mitigating confounder effects by inverse probability weighting. MFI indicates mean fluorescence intensity; and WBC, white blood cell.
Figure 2.
Figure 2.
Lamin A/C deficiency in hematopoietic cells accelerates atherosclerosis development in atheroprone Ldlr−/− mice. A, Protocol for atherosclerosis studies. B, Representative immunofluorescence images of peripheral blood granulocytes from wild-type (WT) and Lmna−/− mice. The WT cell shows the perinuclear staining characteristic of lamin A/C (green), which is absent in Lmna−/− cells. C, Transplant efficiency shown as the percentage of CD45.2+ cells in the total white blood cell (WBC) population 4 weeks after bone marrow transplantation (BMT), evaluated by flow cytometry (n=7 WT; n=10 Lmna−/−). Statistical differences were assessed by the 2-tailed unpaired t test. D, Body weight evolution over the 6-week fat-feeding period (n=10 WT; n=9 Lmna−/−). Statistical significance was determined by ANOVA. E, Absolute blood cell counts of WBC subpopulations in peripheral blood of reconstituted animals after 6 weeks of fat feeding (n=9, both genotypes). Statistical significance was determined by the multiple t test with the Holm-Sidak method, with α=0.05. Each cell population was analyzed individually, without assuming a consistent SD. F, Fasting plasma lipid concentration after 6 weeks of fat feeding (n=10, both genotypes). Statistical significance was determined by the multiple t test with the Holm-Sidak method, with α=0.05. Each cell population was analyzed individually, without assuming a consistent SD. G, Representative images of Oil Red O–stained aortas and quantification of plaque burden in the aortic arch (n=10, both genotypes). Statistical differences were assessed by the 2-tailed unpaired t test. H, Representative images of Oil Red O–stained right carotid arteries and quantification of plaque burden (n=5 WT; n=7 Lmna−/−). Statistical differences were assessed by the 2-tailed unpaired t test. BM indicates bone marrow; HDL, high-density lipoprotein; HFD, high-fat diet; LDL, low-density lipoprotein; and TG, triglyceride.
Figure 3.
Figure 3.
Generation of transgenic Lmna-OE mice with Cre-dependent overexpression of lamin A in hematopoietic cells. A, Representation of the genetic construct inserted in the mouse Rosa26 locus before and after Cre-dependent removal of the LoxP-flanked stop sequence. B, Relative Lmna transcript expression in circulating leukocytes, normalized to the average expression of 2 housekeeping genes (Rplp0 and Actb; N=4 Lmnatg; n=8 Lmna-OE; each dot represents a pool of 2 or 3 animals, with approximately equal numbers of males and females). Statistical significance was assessed by the 2-tailed unpaired t test. C, Lamin A protein expression in circulating leukocytes assessed by flow cytometry (n=3 male and 2 female mice per genotype). Statistical significance was determined by the multiple t test with the Holm-Sidak method, with α=0.05. Each cell population was analyzed individually, without assuming a consistent SD. D, Lamin A protein expression in the Lin Sca1 cKit+ (LK) and Lin Sca1+ cKit+ (LSK) bone marrow progenitor populations, assessed by flow cytometry and presented as mean fluorescence intensity (MFI); n=3 male and 2 female mice per genotype. Statistical significance was determined by the 2-tailed unpaired t test. E, Immunoblot analysis of lamin A/C in circulating leukocytes from mice of the indicated genotype. Endogenous lamin A runs at the expected 72 KDa in all mice, while Lmna-OE mice overexpress a larger lamin A isoform (lamin A+51aa). The graphs show the quantification of lamin A and lamin A+A+51aa, normalized to GAPDH as loading control. Statistical significance was determined using a 2-tailed unpaired t test comparing Lmnatg and Lmna-OE. F, Representative immunofluorescence images of peripheral blood leukocytes from Lmnatg and Lmna-OE mice showing the perinuclear staining characteristic of lamin A and increased lamin A protein expression in Lmna-OE mice. MERGE refers to the composite image generated by overlapping the DAPI and the Lamin A/C signals, allowing their visualization within the same field of view. cKit indicates cellular Kit proto-oncogene; Cre, causes recombination; DAPI, 4′,6-diamidino-2-phenylindole; HSC, hematopoietic stem cell; Lin, lineage; LoxP, Locus of X (cross)-over in P1; Sca1, stem cell antigen; and WT, wild type.
Figure 4.
Figure 4.
Lamin A overexpression in hematopoietic cells reduces atherosclerosis development in atheroprone Ldlr−/− mice. A, Protocol for atherosclerosis studies. B, Lamin A protein expression in CD45.2+ cells assessed by flow cytometry (Lmnatg mice: n=8 females and n=7 males; Lmna-OE mice: n=7 females and n=8 males). Statistical significance was determined by the multiple t test with the Holm-Sidak method, with α=0.05. Each population was analyzed individually, without assuming a consistent SD. C, Transplant efficiency shown as the percentage of CD45.2+ circulating leukocytes 4 weeks after bone marrow transplantation (BMT), evaluated by flow cytometry (Lmnatg mice: n=8 females and n=7 males; Lmna-OE mice: n=7 females and n=8 males). Statistical significance was determined using a Mann-Whitney U test. D, Body weight evolution over the 6-week fat-feeding period (Lmnatg mice: n=8 females and n=7 males; Lmna-OE mice: n=7 females and n=8 males). Statistical significance was determined by ANOVA. E, Absolute cell counts in peripheral blood of reconstituted animals after 6 weeks of fat feeding (Lmnatg mice: n=8 females and n=7 males; Lmna-OE mice: n=7 females and n=8 males). Statistical significance was determined by the multiple t test with the Holm-Sidak method, with α=0.05. Each cell population was analyzed individually, without assuming a consistent SD. F, Fasting plasma lipid concentration after 6 weeks of fat feeding (Lmnatg mice: n=8 females and n=7 males; Lmna-OE mice: n=7 females and n=8 males). Statistical significance was determined by the multiple t test with the Holm-Sidak method, with α=0.05. Each cell population was analyzed individually, without assuming a consistent SD. G, Representative images of Oil Red O–stained aortas and quantification of plaque burden in the aortic arch (Lmnatg mice: n=15; Lmna-OE mice: n=14). Statistical differences were assessed by the 2-tailed unpaired t test. H, Representative images of Oil Red O–stained right carotid arteries and quantification of plaque burden (n=5 for Lmnatg and n=5 for Lmna-OE). Statistical differences were assessed by the 2-tailed unpaired t test. BM indicates bone marrow; HDL, high-density lipoprotein; HFD, high-fat diet; LDL, low-density lipoprotein; MFI, mean fluorescence intensity; TG, triglyceride; and WBC, white blood cell.
Figure 5.
Figure 5.
Single-cell RNA sequencing analysis of the aorta in Ldlr−/− transplant recipients. A, Experimental approach. Lethally irradiated Ldlr−/− mice were reconstituted with bone marrow (BM) from Lmna+/+, Lmna−/−, Lmnatg, or Lmna-OE mice, and aortas were collected at the end of the 6-week period of fat feeding. B, Uniform manifold approximation and projection (UMAP) representation of single-cell RNA sequencing (scRNA-seq) data, showing cell clusters and identified cell types. C, Relative expression and percentage expression of cell type–specific markers in each cluster. D, Relative abundance of each cluster in Ldlr−/− mice reconstituted with lamin A–deficient, lamin A–overexpressing, and control BM. E, Biological processes altered within the endothelial cell (EC) cluster (C7) in mice reconstituted with Lmna−/− versus wild-type (WT) BM. The dashed black line indicates the Benjamini-Hochberg significance threshold (P=0.05). Statistical significance was assessed with the Benjamini-Hochberg procedure. FACS indicates fluorescence-activated cell sorting; GO, gene ontology; HFD, high-fat diet; and VSMC, vascular smooth muscle cell.
Figure 6.
Figure 6.
Characterization of immune cell reclustering in the atherosclerotic aorta of Ldlr−/− mice with lamin A/C deficiency or lamin A overexpression in hematopoietic cells. A, Uniform manifold approximation and projection representation of single-cell RNA sequencing (scRNA-seq) immune cell reclustering (CD45+), showing cell clusters and identified cell types in Ldlr−/− mice reconstituted with bone marrow of the indicated genotype and fed the high-fat diet for 6 weeks. B, Bar plots representing the proportions of each immune cell type in each condition (in percentages). Colors for each cluster are defined as in A. C, Violin plots showing gene signature scores for neutrophil activation, NETosis, and apoptosis in the neutrophil cluster (IC6). The black horizontal line marks the mean score for each BM genotype. Statistical significance was determined by ANOVA with the Tukey post hoc test or with Kruskal-Wallis with Bonferroni correction. D, Biological processes altered in aortic macrophage clusters IC3 (left) and IC4 (right) in Ldlr−/− mice reconstituted with Lmna−/− BM and fed the high-fat diet for 6 weeks versus wild-type (WT) control bone marrow. Statistical significance was determined by the Benjamini-Hochberg procedure. Discontinuous black lines indicate Benjamini-Hochberg P=0.05. BM indicates bone marrow; GO, gene ontology; and IC, immune cluster.
Figure 7.
Figure 7.
Changes in hematopoietic lamin A/C expression modulate the leukocyte immune response and extravasation capacity in vivo. Ldlr−/− mice were reconstituted with bone marrow (BM) of the indicated genotype and were fed the high-fat diet for 2 (A and B) or 12 weeks (C). A, Representative en face immunofluorescence staining of endothelial cells (CD31+; green) and leukocytes (CD45.2+; red) in the aortic arch and quantification of CD45+ leukocytes per area (wild-type [WT] and Lmna−/− mice: n=9; Lmnatg and Lmna-OE mice: n=10; with ≈50% males and females in all experimental conditions). The mean value for each mouse was determined by averaging the number of cells present in 3 microscopic fields. Scale bar, 100 µm. B, Absolute white blood cell (WBC) counts at the end of the 2-week fat-feeding period (WT and Lmna−/− mice: n=9; Lmnatg and Lmna-OE mice: n=10; with ≈50% males and females in all experimental conditions). Scale bar, 100 µm. C, Representative intravital microscopy images and quantification of leukocyte extravasation into the cremaster muscle. Each value represents a different venule analyzed from transplanted Ldlr−/− mice (n=23 WT; n=47 Lmna−/−; n=24 Lmnatg; and n=20 Lmna-OE). Statistical significance in A through C was assessed by the 2-tailed unpaired t test. Scale bar, 50 µm. D, Proposed mechanism for lamin A/C–dependent regulation of atherogenesis during aging. Age-related downregulation of lamin A/C levels in circulating leukocytes facilitates their extravasation into the arterial wall, thereby contributing to increased inflammation and the progression of atherosclerosis.

References

    1. Libby P. Fanning the flames: inflammation in cardiovascular diseases. Cardiovasc Res. 2015;107:307–309. doi: 10.1093/cvr/cvv188 - PubMed
    1. Ley K, Laudanna C, Cybulsky MI, Nourshargh S. Getting to the site of inflammation: the leukocyte adhesion cascade updated. Nat Rev Immunol. 2007;7:678–689. doi: 10.1038/nri2156 - PubMed
    1. Lakatta EG, Levy D. Arterial and cardiac aging: major shareholders in cardiovascular disease enterprises: part I: aging arteries: a “set up” for vascular disease. Circulation. 2003;107:139–146. doi: 10.1161/01.cir.0000048892.83521.58 - PubMed
    1. Savji N, Rockman CB, Skolnick AH, Guo Y, Adelman MA, Riles T, Berger JS. Association between advanced age and vascular disease in different arterial territories: a population database of over 3.6 million subjects. J Am Coll Cardiol. 2013;61:1736–1743. doi: 10.1016/j.jacc.2013.01.054 - PubMed
    1. Wang JC, Bennett M. Aging and atherosclerosis: mechanisms, functional consequences, and potential therapeutics for cellular senescence. Circ Res. 2012;111:245–259. doi: 10.1161/CIRCRESAHA.111.261388 - PubMed

MeSH terms