Review
. 2025 Jun 17:53:100698.
doi: 10.1016/j.jbo.2025.100698. eCollection 2025 Aug.

Exploring bone-tumor interactions through 3D in vitro models: Implications for primary and metastatic cancers

Affiliations
Review

Exploring bone-tumor interactions through 3D in vitro models: Implications for primary and metastatic cancers

Nicolas Cristini et al. J Bone Oncol. .

Abstract

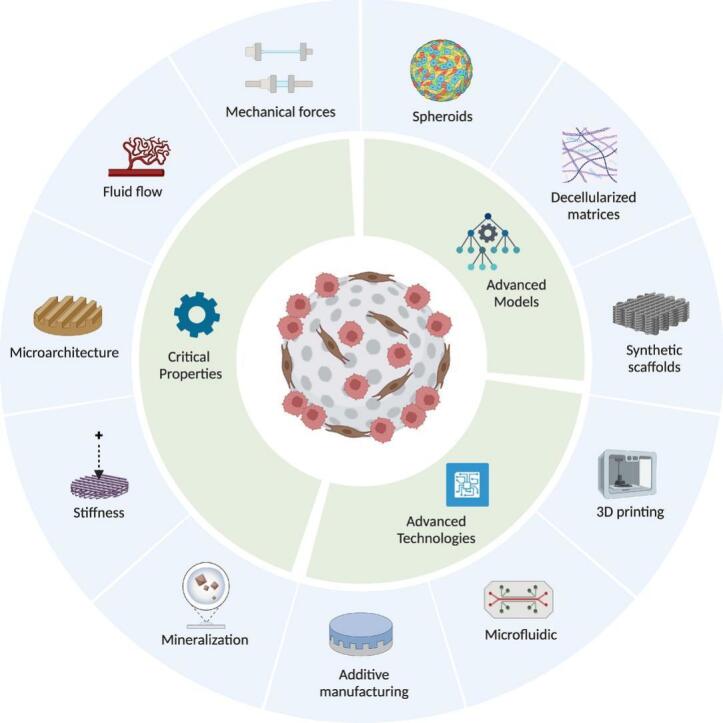
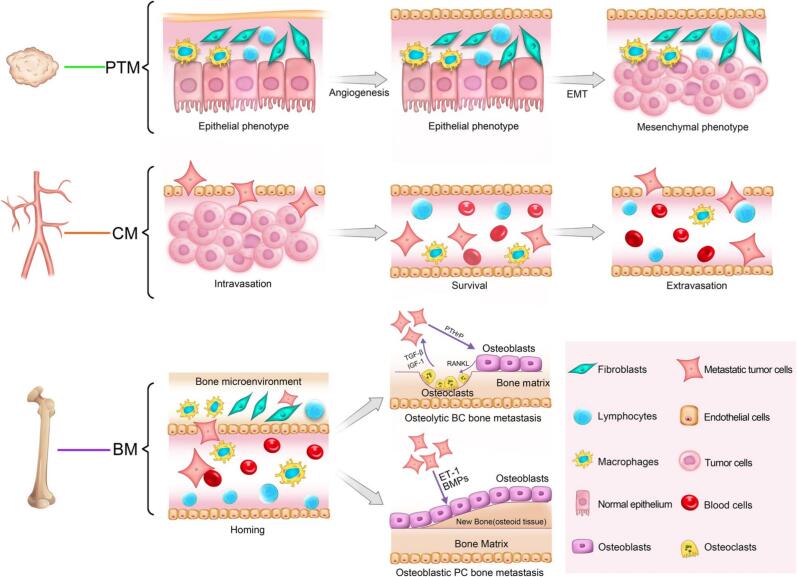
Bone tissue serves as a perfect hosting site where metastatic cancer cells of the most prevalent cancer types, such as prostate and breast cancers, as well as the native bone sarcomas, can further proliferate, advancing the disease stage with the consequential decline of the patient's prognosis. Understanding how the bone niche interacts with tumor cells and the mechanisms leading to drug resistance is a crucial step for enabling the identification of effective cancer therapies. Nevertheless, bone tumor research and the development of new effective anticancer drugs have been hampered for a long time due to the limitations of preclinical models. Traditional 2D cultures and animal models have failed to accurately replicate the human bone cancer microenvironment, driving researchers to develop 3D in vitro bone models using tissue-engineered bone constructs and advanced technologies like microfluidics and additive manufacturing. While a complete reproduction of the bone tumor microenvironment (TME), including all relevant cell types, stromal elements, and biophysical cues, remains elusive, targeted inclusion of key components has advanced the physiological relevance of these models. The following review evaluates the biomimetic approaches that have been used to recapitulate the bone TME through 3D in vitro models, with particular attention to recent studies aimed at more accurately mimicking the complexity of bone TME, highlighting future directions and the advancements required to overcome present limitations.

Keywords: 3D models; Bone tumors; In vitro; Metastatic cancers; Tumor microenvironment.


Conflict of interest statement

The authors declare that they have no known competing financial interests or personal relationships that could have appeared to influence the work reported in this paper.

Figures

None
Graphical abstract
Fig. 1
Fig. 1
Osteolytic and osteoblastic bone metastasis. Cancer cells initially emerge, proliferate, and acquire invasive traits within the primary tumor microenvironment (PTM). Following detachment, they enter the circulation microenvironment (CM), where they must evade immune surveillance. Upon arrival at the bone, tumor cells engage with the bone microenvironment (BM) and resident stromal and immune cells, facilitating colonization and the formation of osteolytic and osteoblastic metastatic lesions. Reproduced under terms of the CC BY 4.0 license [13]. Copyright 2018, Springer Nature.
Fig. 2
Fig. 2
Mechanical loading of MLO-Y4 osteocytes affects PC-3 extravasation. (A) PC-3 cell extravasation toward the osteocyte channel without seeded osteocytes. (B) The superplot of PC-3 cell extravasation distance without osteocytes (C) Extravasation score which quantifies the fraction of affected side channels and the number of extravasated cells in the absence of osteocytes. (D) PC-3 cell extravasation toward MLO-Y4 osteocytes under static and OFF conditions. (E) The superplot of PC-3 cell extravasation distance when MLO-Y4 osteocytes are present (F) Extravasation score in the presence of MLO-Y4 osteocytes. Data presented as mean ± SD. **p < 0.01 and ***p < 0.001 in comparison to the static condition. Reproduced under terms of the CC BY-NC-ND 4.0 license [76]. Copyright 2025, John Wiley and Sons.
Fig. 3
Fig. 3
Stereolithography-based 3D printed nanocomposite matrixes for breast cancer bone metastasis. (A) 3D bioprinted bone matrix for investigating breast cancer cell invasion. (B) Top, side, and enlarged computer-aided design illustrations of matrices with large square, small square, large hexagonal, and small hexagonal pore structures. Adapted with permission [84]. Copyright 2016, Elsevier.
Fig. 4
Fig. 4
Impact of ECM stiffness on tumor cell proliferation in 3D in vitro and computational models of bone metastasis. (A) Encapsulation of 4 T1 cells as single-cell suspensions within gelatin-transglutaminase hydrogels, followed by static culture and spheroid formation. (B) Change in the average number of nuclei per spheroid over time across three hydrogel stiffness levels (0.58, 0.85, and 1.1 kPa). (C) Spheroid volume progression over time under different stiffness conditions. (D) Fluorescent imaging of 4 T1 spheroids (indicated by arrows) within hydrogels, showing actin (green) and nuclei (DAPI, blue) on day 7. (E) Comparison of tumor spheroid formation in hydrogels on day 7 with computational model simulations of tumor growth at the same stiffness levels. (F) Computational model illustrating spheroid expansion within hydrogels (green background) and the corresponding stress distribution. (G) Correlation between tumor spheroid growth and hydrogel stiffness. Data are presented as mean ± SEM. & (p ≤ 0.05) vs. day 3; a, b, c (p ≤ 0.05) vs. 0.58, 0.85, and 1.1 kPa, respectively; *p ≤ 0.05, **p ≤ 0.01, ***p ≤ 0.001, ****p ≤ 0.0001. Reproduced under terms of the CC BY-NC 4.0 license [90]. Copyright 2024, Cell Press. (For interpretation of the references to colour in this figure legend, the reader is referred to the web version of this article.)
Fig. 5
Fig. 5
Various approaches for MCTS generation for cancer biology and drug screening investigations. Mono-MCTSs are monocellular tumor spheroids, also called homospheroids. Hetero-MCTSs are co-culture tumor spheroids, also called heterospheroids. Scaffold-based MCTSs include scaffold-based Mono- or Hetro-MCTSs. Adapted with permission [102]. Copyright 2024, Elsevier.
Fig. 6
Fig. 6
Organization of PCa and osteoblastic cells in co-culture. (A) MDA PCa 118b monocultures (PCa), MC 3 T3-E1 monocultures (OB), and their co-cultures (CO) at different time points. (B and C) EpCAM-positive (green) tumor cells and vimentin-positive (red) osteoblastic cells in monocultures (B) and co-cultures (C) at day 6. (D) A 3D volume rendering of an osteoblast-wrapped PCa tumoroid in co-culture. (E) Hematoxylin-eosin-stained sections of an intrafemorally grown MDA PCa 118b PDX. T (tumor), M (bone matrix); the black arrow marks osteoblasts. Adapted with permission [150]. Copyright 2016, Elsevier. (For interpretation of the references to colour in this figure legend, the reader is referred to the web version of this article.)
Fig. 7
Fig. 7
Culture-expandable organoids mirroring parental tumor morphology. (A) Representative images of sarcoma tissues and matched organoids. Columns 1 and 2 show H&E-stained sections of patient-derived sarcomas and their corresponding organoids, respectively. Columns 3 and 4 display representative bright-field images of the same sarcoma-derived organoids in culture on day 1 and day 5. Organoid growth was quantified over time using a machine learning-based image analysis pipeline that segmented in-focus organoids in bright-field images. Growth was expressed as the fold change in cross-sectional area relative to day 1. Data are presented as mean ± SEM. Scale bars: 40 µm (H&E images), 100 µm (bright-field images). (B) Genomic and transcriptomic profiling of selected sarcoma samples and corresponding organoids. Top panel: Spearman’s rank correlation coefficients (dark boxes) indicate transcriptomic similarity between RNA-sequenced tumor samples and their matched organoids, excluding genes with expression below 0.1 transcripts per million in either sample. Bottom panel: Genomic alterations identified using the Dana-Farber Cancer Institute OncoPanel v3.1. Heatmap colors denote the type of alteration: copy number variants (CNVs), single-nucleotide variants (SNVs), or structural variants (SVs). Overlay symbols represent clinical relevance tiers: circles (Tier 1) indicate variants with well-established diagnostic or prognostic value; crosses (Tier 2) indicate variants with potential clinical utility; absence of symbols denotes Tier 3 variants of uncertain significance. (C) Spearman’s rank correlation coefficients comparing transcriptomic profiles of tumor tissue and matched organoids. Reproduced under terms of the CC BY-NC 4.0 license [247]. Copyright 2024, Cell Press.
Fig. 8
Fig. 8
Critical properties as well as advanced methods and technologies for 3D in vitro bone tumor models. Created by BioRender.com.

Similar articles

References

    1. Chaffer C.L., Weinberg R.A. A perspective on cancer cell metastasis. Science. 2011;331(6024):1559–1564. - PubMed
    1. Coleman R.E. Clinical features of metastatic bone disease and risk of skeletal morbidity. Clin. Cancer Res. 2006;12(20):6243s–s6249. - PubMed
    1. Siegel D.A., O’Neil M.E., Richards T.B., Dowling N.F., Weir H.K. Prostate cancer incidence and survival, by stage and race/ethnicity—United States, 2001–2017. Morb. Mortal. Wkly Rep. 2020;69(41):1473. - PMC - PubMed
    1. Sathiakumar N., Delzell E., Morrisey M.A., Falkson C., Yong M., Chia V., Blackburn J., Arora T., Kilgore M. Mortality following bone metastasis and skeletal-related events among men with prostate cancer: a population-based analysis of US Medicare beneficiaries, 1999–2006. Prostate Cancer Prostatic Dis. 2011;14(2):177–183. - PubMed
    1. J. Ferlay, I. Soerjomataram, M. Ervik, R. Dikshit, S. Eser, C. Mathers, M. Rebelo, D. Parkin, D. Forman, F. Bray, GLOBOCAN 2012 v1. 0, Cancer incidence and mortality worldwide: IARC CancerBase 11 (2013). - PubMed

LinkOut - more resources