

Prediction cardiovascular deterioration in a paediatric intensive care unit (PicEWS): a machine learning modelling study of routinely collected health-care data
- PMID: 40606526
- PMCID: PMC12213932
- DOI: 10.1016/j.eclinm.2025.103255
Prediction cardiovascular deterioration in a paediatric intensive care unit (PicEWS): a machine learning modelling study of routinely collected health-care data
Abstract
Background: Paediatric intensive care medicine uses fine granular clinical data that describe substantial patient instability to make high-consequence decisions. However, these decisions are also hindered by clinical experts' ability to interpret longitudinal data along with recent and gradual changes in the vital sign data. Machine learning aided decisions can improve the identification of patient deterioration. Important prior work has predicted outcomes in paediatric intensive care units (PICUs), but has often used non-time series data without age normalisation. Most current work also aims to predict mortality, not potentially treatable clinical inflection points such as cardiovascular deterioration.
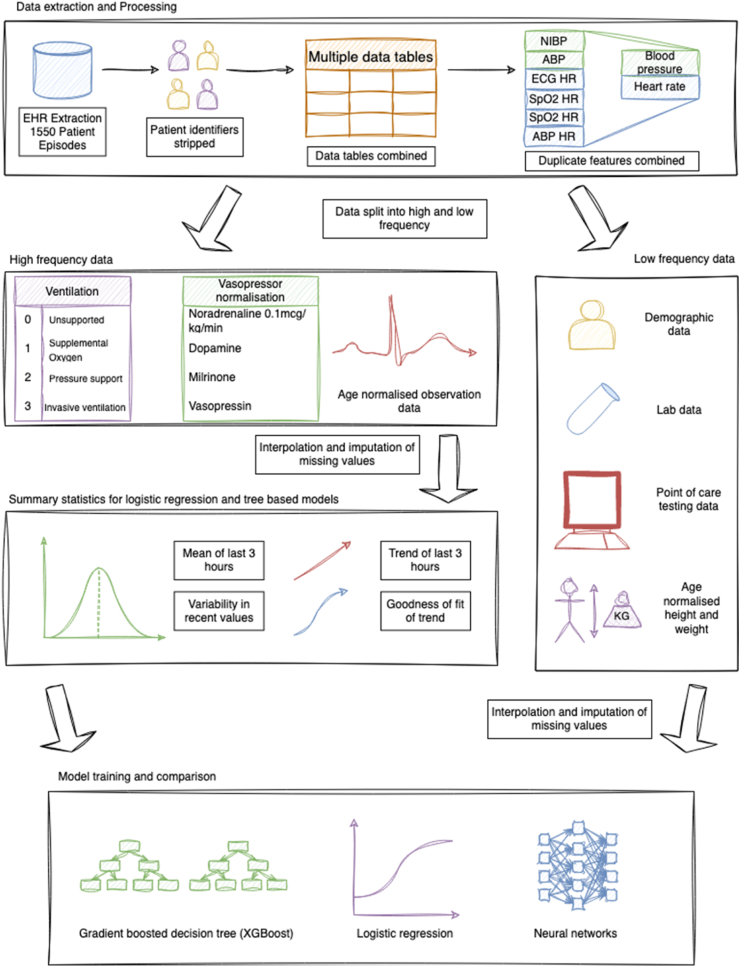
Methods: We extracted telemetry data, alongside laboratory and demographic data, from the Electronic Health Record (EHR) of patients admitted to the general PICU at Great Ormond Street Hospital, London (UK), between 1st April 2019 and 31st April 2021. We engineered deterioration monitoring variables into a smaller feature set using a generalisable pipeline. We calculated trend and variability, and used validated age-normalisation for input variables where appropriate. We compared neural network models, gradient-boosted decision trees (XGBoost), and a logistic regression model to predict cardiovascular deterioration within 12 h (defined as a rise in the paediatric Sequential Organ Failure Assessment (pSOFA) cardiovascular sub-score, rising plasma lactate if lactate ≥2 mmol/l, new extra-corporeal membrane oxygenation (ECMO) requirement, or death). We trained the models on a 70-15-15 percent train-test-validation split. We compared model compositions, including without trend, variability, and frequency of input to smaller models. We investigated feature importance using internal feature importance and Shapley Additive Explanation values. We compared the resulting paediatric intensive care early warning score (PicEWS) with the paediatric Sequential Organ Failure Assessment (pSOFA) score as the gold-standard.
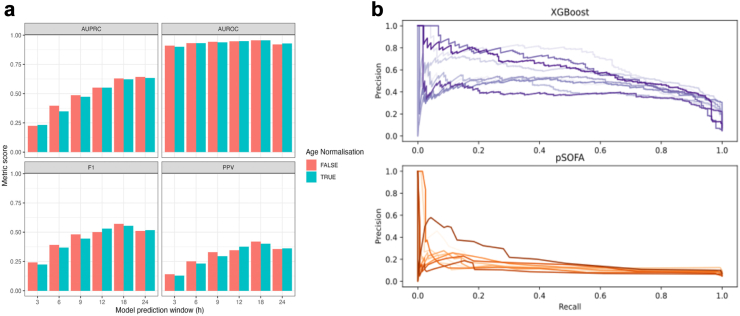
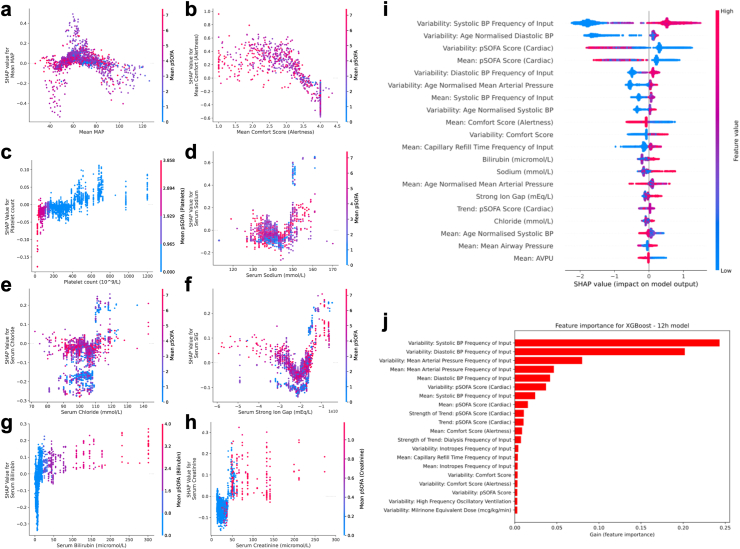
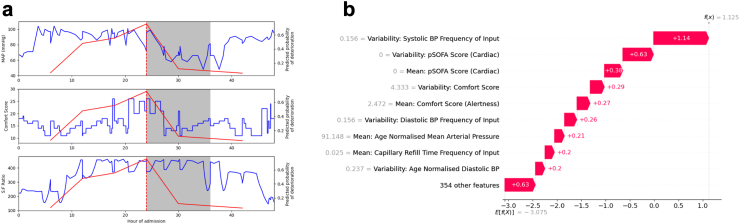
Findings: 1167 patients were included out of a possible 1195. The best performing predictive model for PicEWS was XGBoost. PicEWS was able to predict cardiovascular deterioration 90% of the time, with fewer than two false alarms for every true alarm. For this model, the area under the precision-recall curve (AUPRC) was 0.552, and area under the receiver operator curve (AUROC) was 0.949. This outperformed pSOFA, which yielded over 10 false alarms per true alarm, with an AUPRC of 0.150 and AUROC of 0.715. The most important features for PicEWS included blood pressure, physiological markers such as bilirubin, and COMFORT score (a sedation and behavioural score used in paediatric intensive care). Feature variability was key to model performance. We demonstrated predictions on an individual patient to show model utility. The study showed that machine learning models can outperform current clinical best practice approaches. We use our model to provide insights into future improvements in clinical practice.
Interpretation: PicEWS outperforms current clinical modelling approaches to predict cardiovascular deterioration. The proposed data processing pipeline and machine learning method offer a clinically applicable decision-support model using age-stratified normal ranges and feature variability over time for the early detection of clinical deterioration in critically ill children.
Funding: The NIHR Great Ormond Street Biomedical Research Centre at UCL and the Great Ormond Street Hospital Children's Charity peer-reviewed grant award.
Keywords: Artificial intelligence; Critical & intensive & emergency care; Digital health; Paediatric intensive care.
© 2025 The Authors.
Conflict of interest statement
DFS would like to acknowledge a UK National Institute for Health and Care Research (NIHR) Academic Clinical Fellowship, and a grant from the Centre for Ageing and Resilience in a Changing Environment at King’s College London. SR would like to declare NIHR Health Technology Assessment (HTA) funding as part of the Oxy-PICU and PRESSURE trials, UKRI Engineering and Physical Sciences Research Council (EPSRC) funding as part of the University College London CHIMERA hub, EU Horizon and UK Research and Innovation (UKRI) funding as part of the Phems project, and from La Roche Ltd for consulting fees for educational materials. PB would like to acknowledge funding via the Royal Academy of Engineering and Great Ormond Street Hospital, the UK Dementia Research Institute (award number UK DRI-7002) through UK DRI Ltd, principally funded by the Medical Research Council, and the UKRI Engineering and Physical Sciences Research Council (EPSRC) and the National Institute of Health and Care Research (NIHR) (grant number: EP/W031892/1). MJP would like to declare grant funding from NIHR HTA for clinical trials in critically ill children, payment for expert testimony in criminal and medical negligence cases. He is also Deputy Chair of the NIHR HTA General Funding committee. MJC would like to declare funding from the NIHR for an Academic Clinical Lectureship.
Figures
Similar articles
-
Signs and symptoms to determine if a patient presenting in primary care or hospital outpatient settings has COVID-19.Cochrane Database Syst Rev. 2022 May 20;5(5):CD013665. doi: 10.1002/14651858.CD013665.pub3. Cochrane Database Syst Rev. 2022. PMID: 35593186 Free PMC article.
-
Automated monitoring compared to standard care for the early detection of sepsis in critically ill patients.Cochrane Database Syst Rev. 2018 Jun 25;6(6):CD012404. doi: 10.1002/14651858.CD012404.pub2. Cochrane Database Syst Rev. 2018. PMID: 29938790 Free PMC article.
-
Immunogenicity and seroefficacy of pneumococcal conjugate vaccines: a systematic review and network meta-analysis.Health Technol Assess. 2024 Jul;28(34):1-109. doi: 10.3310/YWHA3079. Health Technol Assess. 2024. PMID: 39046101 Free PMC article.
-
Cost-effectiveness of using prognostic information to select women with breast cancer for adjuvant systemic therapy.Health Technol Assess. 2006 Sep;10(34):iii-iv, ix-xi, 1-204. doi: 10.3310/hta10340. Health Technol Assess. 2006. PMID: 16959170
-
Supervised Machine Learning Models for Predicting Sepsis-Associated Liver Injury in Patients With Sepsis: Development and Validation Study Based on a Multicenter Cohort Study.J Med Internet Res. 2025 May 26;27:e66733. doi: 10.2196/66733. J Med Internet Res. 2025. PMID: 40418571 Free PMC article.
References
-
- NHS England National early warning score (NEWS) https://www.england.nhs.uk/ourwork/clinical-policy/sepsis/nationalearlyw... [cited 2024 Sep 11]. Available from:
-
- Chapman S.M., Wray J., Oulton K., Pagel C., Ray S., Peters M.J. ‘The Score Matters': wide variations in predictive performance of 18 paediatric track and trigger systems. Arch Dis Child. 2017;102(6):487–495. - PubMed
-
- Haque I.U., Zaritsky A.L. Analysis of the evidence for the lower limit of systolic and mean arterial pressure in children. Pediatr Crit Care Med J Soc Crit Care Med World Fed Pediatr Intensive Crit Care Soc. 2007;8(2):138–144. - PubMed
LinkOut - more resources
Full Text Sources
Miscellaneous
