. 2025 Jun 18:16:1584334.
doi: 10.3389/fgene.2025.1584334. eCollection 2025.

Identification of three T cell-related genes as diagnostic and prognostic biomarkers for triple-negative breast cancer and exploration of potential mechanisms

Affiliations

Identification of three T cell-related genes as diagnostic and prognostic biomarkers for triple-negative breast cancer and exploration of potential mechanisms

Zhi-Chuan He et al. Front Genet. .

Abstract

Background: Triple-negative breast cancer (TNBC) is an aggressive subtype of breast cancer (BRCA) with limited therapeutic targets. This study aimed to identify T cell-related signatures for TNBC diagnosis and prognosis.

Methods: Clinical data and transcriptomic profiles were obtained from the TCGA-BRCA dataset, and single-cell RNA sequencing (scRNA-seq) data were downloaded from the GEO database. Differentially expressed genes (DEGs) between TNBC and other BRCA subtypes were intersected with T cell-related genes to identify candidate biomarkers. Machine learning algorithms were used to screen for key hub genes, which were then used to construct a logistic regression (LR) model. Immune cell infiltration patterns were analyzed between high- and low-LR score groups, and Kaplan-Meier analysis evaluated the prognostic significance of hub genes. Functional enrichment and pathway analysis were performed using GSEA, and scRNA-seq data further explored hub gene-related pathways in immune cells.

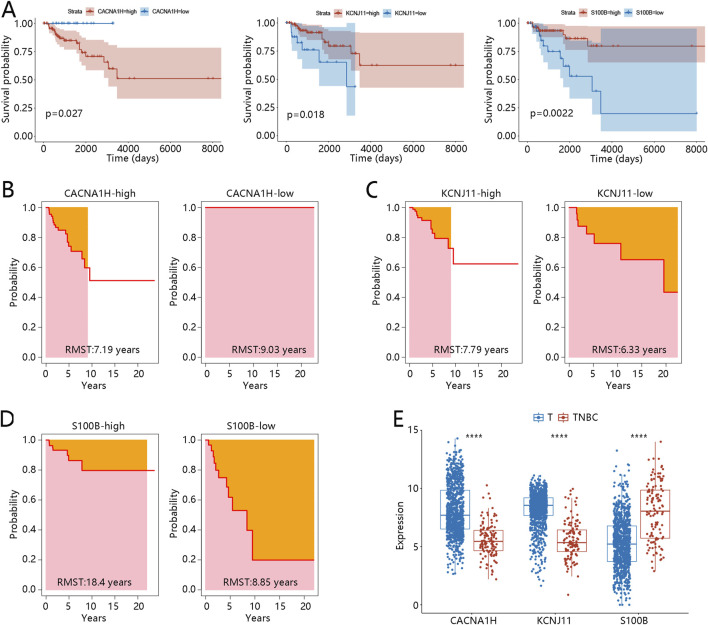
Results: Three hub genes (CACNA1H, KCNJ11, and S100B) were identified with strong diagnostic and prognostic relevance in TNBC. The LR model based on these genes achieved an AUC of 0.917 in diagnosing TNBC from other BRCA subtypes. Low LR scores were associated with poorer overall survival and reduced immune cell infiltration, particularly CD8 T cells and cytotoxic lymphocytes. S100B showed strong associations with the cytokine-cytokine receptor interaction pathway, JAK-STAT signaling, and T cell receptor signaling.

Conclusion: CACNA1H, KCNJ11, and S100B are potential diagnostic and prognostic biomarkers in TNBC. Their immune-related functions highlight their potential for guiding targeted immunotherapy strategies.

Keywords: T cell-related genes; Triple-negative breast cancer; diagnosis; immune infiltration; prognosis.


Conflict of interest statement

The authors declare that the research was conducted in the absence of any commercial or financial relationships that could be construed as a potential conflict of interest.

Figures

FIGURE 1
FIGURE 1
Identification of T cell-related DEGs in TNBC (A) Volcano plot of DEGs between TNBC and other BRCA subtypes. (B) Venn diagram identified 750 overlapping genes between T cell-related genes and TNBC-DEGs. (C) Go enrichment analysis of 750 overlapping genes. (D) KEGG pathways related to 750 overlapping genes. Abbreviations: DEGs, differentially expressed genes; TNBC, triple-negative breast cancer; BRCA, breast cancer; GO, Gene Ontology; KEGG, Kyoto Encyclopedia of Genes and Genomes.
FIGURE 2
FIGURE 2
Identification of hub genes related to prognosis in TNBC (A) Lasso regression analysis was performed on the 750 T cell-related DEGs. (B–D) The top 10 genes identified through (B) random forest, (C) XGBoost, and (D) AdaBoost.
FIGURE 3
FIGURE 3
Clinical relevance of the LR model in TNBC patients (A) ROC and DCA curves for diagnosing TNBC. (B) Kaplan-Meier curve for the LR model based on the TCGA dataset. (C) Kaplan-Meier curve for the LR model based on the GSE58812. (D) LR score differences between different clinical subgroups. **p < 0.01, ns means no significance, yr means year. Abbreviations: LR, logistic regression; TNBC, triple-negative breast cancer; ROC, receiver operator characteristic; AUC, area under curve; DCA, decision curve analysis.
FIGURE 4
FIGURE 4
Tumor microenvironment landscapes between two LR score groups in TNBC patients (A) Immune cell infiltration in high- and low-LR score groups. (B) TIDE in high- and low-diagnostic score groups. *p < 0.05, ***p < 0.001, ****p < 0.0001, ns means no significance. Abbreviations: LR, logistic regression; TNBC, triple-negative breast cancer; NK, natural killer; TIDE, tumor immune dysfunction and exclusion; MSI, microsatellite instability.
FIGURE 5
FIGURE 5
Prognosis performance expression of three hub genes in TNBC (A) Kaplan-Meier curves of three hub genes CACNA1H, KCNJ11, and S100B. (B-C) RMST analysis for three hub genes (B) CACNA1H, (C) KCNJ11, and (D) S100B. (E) Expression of three hub genes between other BRCA subtype samples (defined as T) and TNBC samples; ****p < 0.0001. Abbreviations: TNBC, triple-negative breast cancer; BRCA, breast cancer; RMST, restricted mean survival time.
FIGURE 6
FIGURE 6
Gene set enrichment analysis of three hub genes (A–C). Three pathways (cytokine-cytokine receptor interaction pathway, JAK-STAT signaling pathway, and T cell receptor signaling pathway) were related to (A) CACNA1H, (B) KCNJ11, and (C) S100B.
FIGURE 7
FIGURE 7
Correlation of three hub genes with immune cells (A–C). Correlation of immune cells with (A) CACNA1H, (B) KCNJ11, and (C) S100B.
FIGURE 8
FIGURE 8
Immune cell distribution and hub gene-related pathways in TNBC (A) Seven cell types were annotated based on a single cell-RNA sequencing dataset; different colors represent different cell types. (B) Pathway scores of T cell receptor signaling pathway in cells. (C) Pathway scores of JAK-STAT signaling pathway in cells. (D) Pathway scores of cytokine-cytokine receptor interaction in cells. Orange-colored dots indicate higher pathway activity scores. (E) Correlation of three hub genes with three pathways; dark blue dots represent significant negative correlations, while dark red dots represent significant positive correlations. The size of the dots reflects the magnitude of the correlation coefficients. Abbreviation: TNBC, triple-negative breast cancer.

References

    1. Aysola K., Desai A., Welch C., Xu J., Qin Y., Reddy V., et al. (2013). Triple negative breast cancer - an overview. Hered. Genet. 2013 (Suppl. 2), 001. 10.4172/2161-1041.S2-001 - DOI - PMC - PubMed
    1. Dietze E. C., Sistrunk C., Miranda-Carboni G., O'Regan R., Seewaldt V. L. (2015). Triple-negative breast cancer in African-American women: disparities versus biology. Nat. Rev. Cancer 15 (4), 248–254. 10.1038/nrc3896 - DOI - PMC - PubMed
    1. Ding R., Wang Y., Fan J., Tian Z., Wang S., Qin X., et al. (2023). Identification of immunosuppressive signature subtypes and prognostic risk signatures in triple-negative breast cancer. Front. Oncol. 13, 1108472. 10.3389/fonc.2023.1108472 - DOI - PMC - PubMed
    1. Dobovisek L., Borstnar S., Debeljak N., Kranjc Brezar S. (2024). Cannabinoids and triple-negative breast cancer treatment. Front. Immunol. 15, 1386548. 10.3389/fimmu.2024.1386548 - DOI - PMC - PubMed
    1. Farhood B., Najafi M., Mortezaee K. (2019). CD8(+) cytotoxic T lymphocytes in cancer immunotherapy: a review. J. Cell Physiol. 234 (6), 8509–8521. 10.1002/jcp.27782 - DOI - PubMed

LinkOut - more resources