. 2025 May 19:14:103378.
doi: 10.1016/j.mex.2025.103378. eCollection 2025 Jun.

A framework to evaluate the thermal and energy performance of smart building systems in existing buildings: A case study on automated interior insulating window shades

Affiliations

A framework to evaluate the thermal and energy performance of smart building systems in existing buildings: A case study on automated interior insulating window shades

Jongki Lee et al. MethodsX. .

Abstract

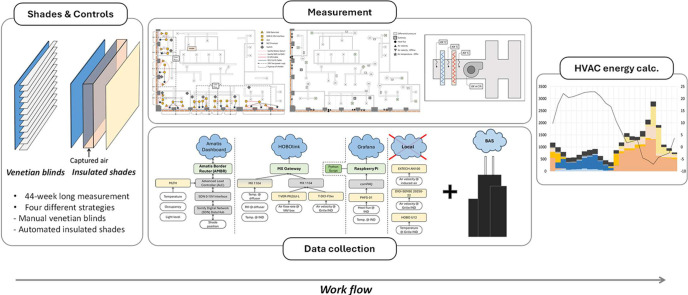
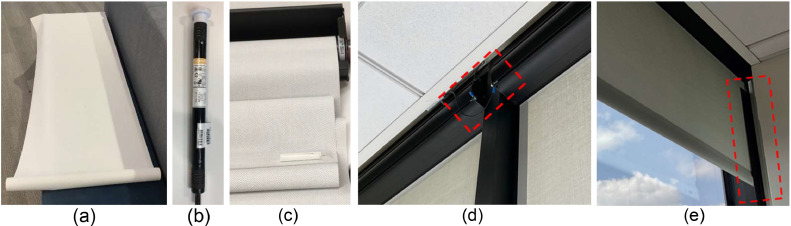
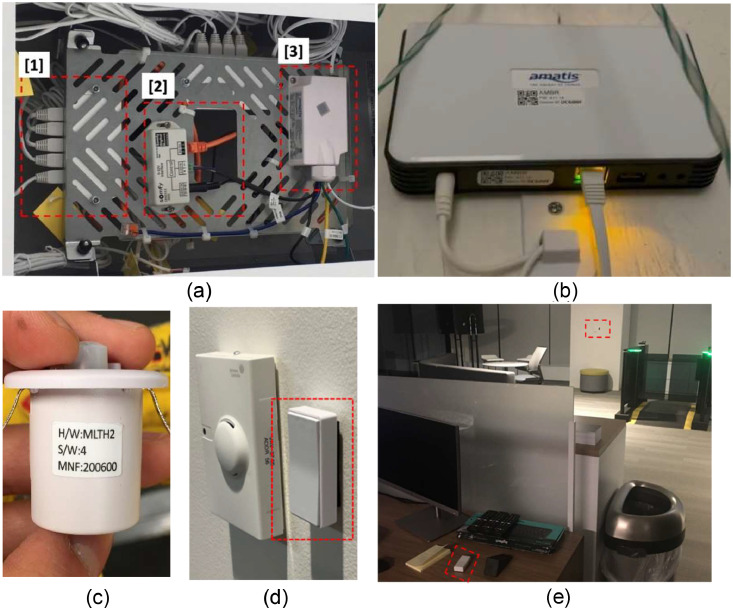
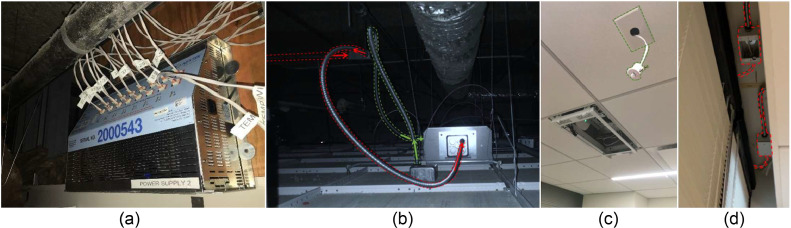
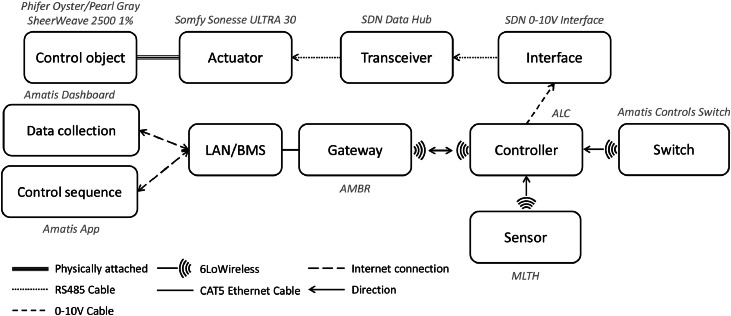
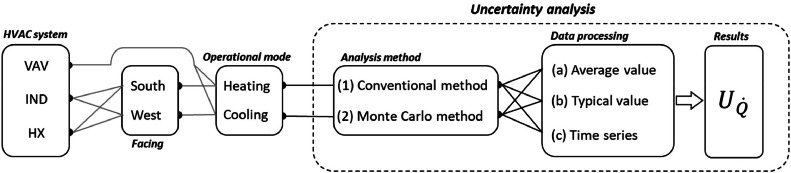
This paper presents a methodological framework for evaluating the thermal and energy performance of smart building systems in existing buildings, with a focus on automated interior insulating window shades as an energy efficiency retrofit measure. The methodology is demonstrated through a case study of a high-rise building in which different shade control strategies were assessed. This paper provides comprehensive descriptions of the (i) development and implementation of the study design, (ii) selection and deployment of measurement instruments, (iii) analysis of various shade control strategies to quantify thermal and energy performance for heating, cooling, and ventilation energy end-uses, and (iv) quantification of the uncertainty associated with the measurements and calculations. This manuscript provides detailed, step-by-step and in-depth guidance to conduct such an evaluation. Overall, this paper:•Highlights the benefits, challenges, and limitations in conducting long-term measurements that capture realistic temporal, seasonal, and operational patterns in an occupied existing building.•Provides practical considerations for such measurements and analysis approaches, upon which future studies can build.•Emphasizes the importance of ensuring that the study design and measurements do not interfere with the building's existing operations.

Keywords: A methodological framework to evaluate the thermal and energy performance of interior insulating window shades in existing buildings; Building science; Energy efficiency measure; Energy performance; Field measurement and validation; Heating ventilation and air conditioning systems.


Conflict of interest statement

The authors declare the following financial interests/personal relationships which may be considered as potential competing interests: This work was supported by the Emerging Technologies initiative within the ComEd Energy Efficiency Program. Also, this study was also funded in part by an ASHRAE New Investigator Award to Mohammad Heidarinejad.

Figures

Image, graphical abstract
Graphical abstract
Fig 1
Fig. 1
The schematic of the case study area illustrating the layout of the mechanical systems, shades, and spaces.
Fig 2
Fig. 2
Demonstration of the interior insulating shades and mini-blinds: (a) when the motorized interior shades are in operation, (b) when mini-blinds are in operation for the Baseline strategy, and (c) when the motorized interior shades are in operation and the mini-blinds are all the way up (a close view).
Fig 3
Fig. 3
The order of control strategies based on the two-week measurement.
Fig 4
Fig. 4
The physical portions of the installed shade system: (a) the shade cloth, (b) the motor (actuator), (c) the shade cloth and the motor in the casing, (d) the static removal and grounding solution, and (e) the l-guide extension.
Fig 5
Fig. 5
The control portions of the installed window shade system: (a) control panel, (b) communication router, (c) MLTH sensor, (d) shade switch next to a room thermostat, and (e) the removal of the control switch from the wall, so the occupant can easily control the shade.
Fig 6
Fig. 6
The low-voltage connections for the controllers and the shades: (a) power supply, (b) conduits for the low voltage, (c) MLTH sensor and the control box in the ceiling, and (d) electrical junction box for the shades to controllers.
Fig 7
Fig. 7
The configuration of automated shade systems physical and control components together.
Fig 8
Fig. 8
A simplified schematic of the VAV system.
Fig 9
Fig. 9
The induction unit system in the test case area: (a) induction unit with the cover, (b) upper view, and (c) the front view.
Fig 10
Fig. 10
A simplified schematic of the induction unit: (a) inside the AHU and (b) inside the heat exchanger at the zone level.
Fig 11
Fig. 11
The customized differential pressure measuring box in the drop ceiling: (a) wired by a low voltage power line and (b) battery powered custom boxes, (c) T-VER-PXU-L, and (d) T-VER-PX3UL connected to MX1105 logger as a 0–5 VDC.
Fig 12
Fig. 12
(a) The custom enclosure for utilizing air velocity and temperature sensors, (b) installation of the velocity sensor in the discharge grille of an induction unit, (c) the completed set of heat flux sensor box and (d) installation of the heat flux sensor on the grille.
Fig 13
Fig. 13
The locations of sensors and set-ups in the test space for the Onset HOBO data loggers, offline sensors, and customized heat flux sensors, excluding the sensors related to the Amatis system.
Fig 14
Fig. 14
The location of the sensors and set-ups in the study design space for the Amatis platform.
Fig 15
Fig. 15
The configuration of data flow, cloud systems, and local systems used in this study.
Fig 16
Fig. 16
A summary of cases of all uncertainty analyses.
Fig 17
Fig. 17
Distributions of daily average outdoor air temperatures during each shade control strategy deployment across the 44-week study from May 2021 to March 2022.
Fig 18
Fig. 18
The supply and zone air temperatures across system for different orientations for the entire measurement period from May 3, 2021 to March 6, 2022.
Fig 19
Fig. 19
The air flow rate across the system and facing sides for the entire measurement period from May 3, 2021 to March 6, 2022.
Fig 20
Fig. 20
The energy consumption patterns in the VAV system over the entire measurement period from May 3, 2021 to March 6, 2022.
Fig 21
Fig. 21
The energy consumption patterns in the induction units energy consumption over the entire measurement duration from May 3, 2021 to March 6, 2022.
Fig 22
Fig. 22
Comparison of time-series uncertainty (UQ˙): Conventional (1)-c vs. Monte Carlo (2)-c.
Fig 23
Fig. 23
A comprehensive summary of the uncertainties (UQ˙) for all the propagation methods and averaging approaches.

Similar articles

References

    1. Lamberti G., Contrada F., Kindinis A. Exploring adaptive strategies to cope with climate change: the case study of Le Corbusier’s modern architecture retrofitting. Energy Build. 2024;302 doi: 10.1016/j.enbuild.2023.113756. - DOI
    1. Kirimtat A., Koyunbaba B.K., Chatzikonstantinou I., Sariyildiz S. Review of simulation modeling for shading devices in buildings. Renew. Sustain. Energy Rev. 2016;53:23–49. doi: 10.1016/j.rser.2015.08.020. - DOI
    1. Gehbauer C., Lee E.S., Wang T. An evaluation of the demand response potential of integrated dynamic window and HVAC systems. Energy Build. 2023;298 doi: 10.1016/j.enbuild.2023.113481. - DOI
    1. Zhang G., Wu H., Liu J., Liu Y., Ding Y., Huang H. A review on switchable building envelopes for low-energy buildings. Renew. Sustain. Energy Rev. 2024;202 doi: 10.1016/j.rser.2024.114716. - DOI
    1. Bellia L., Marino C., Minichiello F., Pedace A. An overview on solar shading systems for buildings. Energy Procedia. 2014;62:309–317. doi: 10.1016/j.egypro.2014.12.392. - DOI

LinkOut - more resources