. 2024 Nov:180:117973.
doi: 10.1016/j.trac.2024.117973. Epub 2024 Sep 18.

Nanoplasmonics biosensors: At the frontiers of biomedical diagnostics

Affiliations

Nanoplasmonics biosensors: At the frontiers of biomedical diagnostics

Aidan J Canning et al. Trends Analyt Chem. 2024 Nov.

Abstract

This article presents an overview of various nanoplasmonics biosensors and their diverse applications, focusing on recent developments in our laboratory. We describe the versatility and effectiveness of different plasmonics-active platforms, ranging from solid substrates to adaptable nanoparticles like gold nanostars and nanorattles. The "Inverse Molecular Sentinel" (iMS) biosensing technology uses surface-enhanced Raman scattering (SERS) to detect nucleotide biomarkers associated with diseases ranging from acute infections to several types of cancer. We have also developed SERS-based nanochip systems capable of detecting DNA targets related to infectious disease biomarkers such as HIV, malaria, and dengue, promising advancements in global health diagnostics. Further, nanorattle-based biosensors are designed as "lab-in-a-stick" devices for rapid head and neck cancer diagnosis. Other technologies include plasmonics-enhanced lateral flow immunoassay systems, smartphone-based biosensing, and implantable biosensors or "smart tattoo" systems. These nanoplasmonics biosensors open new frontiers to rapid, simple, and effective detection systems for biomedical diagnostics.

Keywords: Biosensors; Cancer biomarkers; Global health; Liquid biopsy; Nanoplasmonics; Point-of-care; Raman; SERS.


Conflict of interest statement

Declaration of competing interest The authors declare that they have no known competing financial interests or personal relationships that could have appeared to influence the work reported in this paper.

Figures
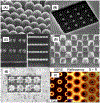
Fig. 1.
Fig. 1.
Plasmonics-Active Solid Substrates. (A) Nanowave platform consisting of metal film on nanosphere array, adapted from Ref. [9]. (B) Nanodots, adapted from Ref. [30]. (C) Left: Periodic array of dimer nanopillars with a 20-nm gap between the nanopillars forming the dimer. Right: arrays of elliptical gold nanopillars separated by a 15-nm gap, adapted from Ref. [31]. (D) Scanning Ion Microscope (SIM) image of an array of 250 nm wide square-shaped nanopillar arranged in a manner that there is ~18 nm gap between the diagonal tips of the square pillars. These nanopillars were developed on planar silica substrates using focused ion beam (FIB) milling, adapted from Ref. [32]. (E) SIM image of an array of star-shaped nanopillars developed on planar silica substrates by employing FIB, adapted from Ref. [32]. (F) Microhole arrays exhibiting localized surface plasmons shown by SERS (S) and reflectance (R) images highlighted by the intensity contrast of 4 nitrobenzene thiol (4-NTB), adapted from Ref. [33].
Fig. 2.
Fig. 2.. Plasmonic nanostars to augment biosensing applications
(A) Surfactant-free gold nanostar morphologies, adapted from Ref. [78]. (B–G) surfactant-free gold nanostars synthesis method where the morphology was tuned by controlling the concentration of AgNO3, adapted from Refs. [79,108]. (H–I) HAADF-STEM and STEM-EDS images of Hybrid silver-coated gold nanostars. J-K) surfactant-free bimetallic silver coated gold nanostars synthesis method where the silver was deposited at the core of the nanostars, adapted from Ref. [79]. L) HAADF-STEM image of unsealed and M) sealed caged gold nanostar particles, adapted from Ref. [81].
Fig. 3.
Fig. 3.
Theoretical investigation of plasmonic nanoparticles (A) Electric-field magnitude of a 2-D x-z slice showing the plasmonic coupling effect between two silver nanoshells with 15 % shell thickness at a wavelength of 640 nm, adapted from Ref. [111]. (B) (Top) TEM images of nanostars formed under different Ag + concentrations (S5: 5 M, S10: 10 M, S20: 20 M, S30: 30 M). The scale bar is 50 nm. (Bottom) Simulation of the E-field in the vicinity of the nanostars in response to a z-polarized plane wave incident E-field of unit amplitude, propagating in the y-direction and with a wavelength of 800 nm. E-field enhancement is greatest on the S20 nanostar. Insets depict the 3D geometry of the stars. Diagrams are not to scale, adapted from Ref. [78]. (C) Scatter plots of simulated polarization-averaged absorption against aspect ratio (AR). Their corresponding 3D geometry is on top (Inset), adapted from Ref. [78]. D) Schematic depicting a range of silver thicknesses simulated for bimetallic nanostar models. E) maximum electric field enhancement and heat losses generated by bimetallic nanostar particles at 633 nm as a function of silver shell thickness. F) Normalized electric field around the top-performing bimetallic nanostar model. G) SERS intensity of different bimetallic nanostar formulations at 1583−cm. D-G adapted from Ref. [113].
Fig. 4.
Fig. 4.. Direct miRNA sensing facilicated by the Inverse Molecular Sentinel probe
(A)Left-Scheme depicting iMS assay operation. Top right-illustration of Raman label within a high area of local electric field enhancement as a result of iMS probe confirmation. Bottom right-representative spectra of iMS probes in the “OFF and “ON” configuration, adapted from Ref. [124]. (B) Results of Clinical Study Using SERS-iMS diagnostics for Gastro-Intestinal Cancer, healthy (black), Barrett’s esophagus (BE, grey), and tumor (red) samples. In this pilot cohort, the miR-21 iMS assay demonstrated notable diagnostic accuracy with 100 % sensitivity and 100 % specificity when discriminating tumor from normal tissue, adapted from Ref. [125]. (C) Illustration showing a region from which the corresponding primary disease originated. D) PCA results of multiplexed iMS assay, resulting in 100 % sensitivity and 100 % specificity, adapted from Ref. [124].
Fig. 5.
Fig. 5.. Implantable miRNA sensors.
(A) In vivo nucleic acid detection using the SERS-based iMS nanoplasmonic biosensors in a large animal model (pig). A gel matrix was used to protect the iMS probes from the complex in vivo environment. (B) The photo depicts the intradermal injection of nanoplasmonic biosensor implants in the dorsum of a male Yorkshire pig. (C) The peak height intensity ratios of the iMS at 506 cm−1 to the internal standard at 1288 cm−1 before (left) and after (right) the injection of the DNA targets (right), adapted from Ref. [144].
Fig. 6.
Fig. 6.. Schematic diagram showing the cascade iMS signal amplification strategy based on the CARTP method.
In this strategy, the iMS-OFF nanoprobes are incubated with input targets and RTP strands. The input miRNA target first binds to the toehold-1 domain to initiate the first strand displacement reaction and turn the SERS signal “ON” (STEP 1) by releasing the target/placeholder duplex (STEP 2). The released target/placeholder duplex then serves as a substrate for the RTP strand. The “linear” RTP strand can bind to the single-stranded overhang (toehold-2 domain) of the target/placeholder duplex to trigger the second strand displacement reaction (STEP 3), allowing the target to be released from the target/placeholder duplex at the end of each cycle (STEPS 4, 9 and 14). In this way, the released target is recycled and reused (STEPS 5, 10, and 15) to turn ON more iMS-OFF nanoprobes (e.g., the second iMS-OFF, the third iMS-OFF, and so on).
Fig. 7.
Fig. 7.. Amplification-free sensing using the nanorattle platform.
(A) Schematic of the nanorattle synthesis process, adapted from Ref. [83]. (B–E) Transmission electron microscope (TEM) images of nanorattles at different stages shown in schematic (A) with (B) gold nanosphere seeds or AuNP; (C) Bimetallic cube or AuNP@AgCube, (D) Hollow silver cage over gold nanosphere or AuNP@CubeCage after galvanic replacement, and (E) final nanorattle after gold coating, adapted from Ref. [83]. (F) Schematic of nanorattle sandwich assay mechanism, adapted from Ref. [83]. (G) The application of an assay to detect malaria DNA in blood lysate and the effect of incubation time on assay performance or SERS intensity at the 930 cm-1 peak, as adapted from Ref. [83]. (H–I) The application of the nanorattle sandwich assay is used to detect head and neck squamous cell carcinoma mRNA biomarkers. The clinical workflow is shown in (H): tissue samples were obtained and segmented for both histology and RNA extraction and assay analysis adapted from Ref. [161]. (I) The normalized average peak intensity of the diagnostic peak for each clinical sample, with SCC in red and non-SCC in blue, adapted from Ref. [161].
Fig. 8.
Fig. 8.
(A) Colorimetric LFIA detection based on different branch sharpness of gold nanostars. (B) Schematic of the LFIA system for Yersinia pestis detection. (C) LFIA assay improvement using GNS-3, adapted from Ref. [181]. (D) Schematic of the synthesis of gold nanocrown (GNC) and SERS-based LFIA detection with GNC. (E) SERS spectra and calibration curve (F) of the test line at different concentrations of S1 antigen ranging from 1 μg/mL to 100 fg/mL adapted from Ref. [182].
Fig. 9.
Fig. 9.. Smartphone-based Krometrics assay.
(A) Schematic diagram illustrating the use of a smartphone-based Krometriks system as a useful colorimetric tool to test patient samples collected at the point of care for nucleic acid biomarker detection and clinical diagnostics. (B) Schematic of PCI assay and example of color change. (C) Simple Smartphone signal transduction for rapid diagnosis.
Fig. 10.
Fig. 10.. Machine learning augmentation of nanoplasmonics biosensors.
A) Reference spectra of individual dye-loaded nanorattles used for training data simulation. Spectra were offset for clarity, adapted from Ref. [160]. (B) Actual and predicted spectra plotted in orange and black, respectively, adapted from Ref. [160]. (C) Effect of training set size and smoothing (filled markers) or not smoothing (hollow markers) training data on RMSEspectrum from 80 mW test set performance evaluation of models for PLSR (teal square), SVR (blue circle), RFR (purple triangle, and CNN (orange triangle), adapted from Ref. [160]. (D) Schematic of iMS sensing mechanism and study design, adapted from Ref. [160]. (E) Offset reference spectra for each iMS were shown, and an illustration of predicted labels, adapted from Ref. [211]. (F) Test spectrum (red) and predicted spectrum (blue) were plotted to show overlap. The difference between predicted and actual spectra was offset and plotted in black, adapted from Ref. [211]. Root-mean-squared-error of spectral points (RMSEspectrum).

Similar articles

References

    1. Jeanmaire DL, Van Duyne RP, Surface Raman spectroelectrochemistry: Part I. Heterocyclic, aromatic, and aliphatic amines adsorbed on the anodized silver electrode, J. Electroanal. Chem. Interfacial Electrochem 84 (1977) 1.
    1. Albrecht MG, Creighton JA, Anomalously intense Raman spectra of pyridine at a silver electrode, J. Am. Chem. Soc 99 (1977) 5215.
    1. Moskovits M, Surface-enhanced spectroscopy, Rev. Mod. Phys 57 (1985) 783.
    1. Wokaun A, Gordon JP, Liao PF, Radiation damping in surface-enhanced Raman scattering, Phys. Rev. Lett 48 (1982) 957.
    1. Schatz GC, Theoretical studies of surface enhanced Raman scattering, Accounts of Chemical Research 17 (1984) 370.

LinkOut - more resources