. 2025 Jun 18:16:1567789.
doi: 10.3389/fendo.2025.1567789. eCollection 2025.

The risk of hyperuricemia assessed by estimated glucose disposal rate

Affiliations

The risk of hyperuricemia assessed by estimated glucose disposal rate

Zhaoxiang Wang et al. Front Endocrinol (Lausanne). .

Abstract

Purpose: The estimated glucose disposal rate (eGDR) is a simple and noninvasive clinical measure used to assess insulin resistance (IR), yet its potential utility as a marker for hyperuricemia risk had not been systematically evaluated. This study aimed to investigate the relationship between eGDR and hyperuricemia risk among American adults.

Methods: Data for this cross-sectional study were obtained from the 2007-2018 National Health and Nutrition Examination Survey (NHANES). Hyperuricemia was identified as a serum urate (SU) concentration of ≥7 mg/dL in males and ≥6 mg/dL in females. The relationship between eGDR and hyperuricemia risk was assessed using multivariate logistic regression and restricted cubic spline (RCS) methods, with additional subgroup and interaction analyses performed.

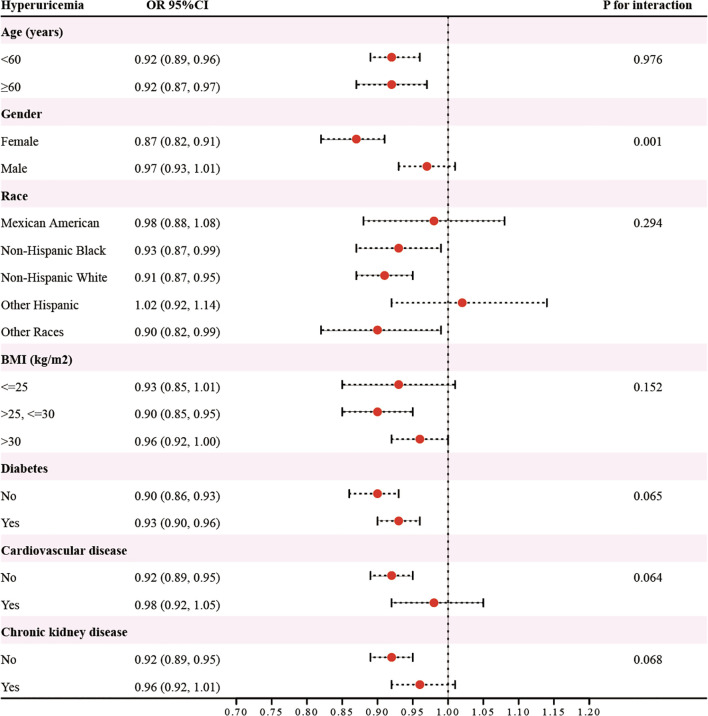
Results: With increasing eGDR values, the prevalence of hyperuricemia decreased significantly (29.93% vs. 19.11% vs. 13.20% vs. 5.03%, P <0.001). Multivariate logistic regression indicated that eGDR was independently associated with the risk of hyperuricemia after controlling for covariates including demographic, lifestyle, and clinical factors (OR=0.93, 95%CI: 0.90-0.96, P <0.001). RCS analysis further revealed a nonlinear relationship, with a turning point at eGDR 7.96 mg/kg/min. Subgroup analysis revealed a stronger inverse association between eGDR and hyperuricemia risk in females.

Conclusions: The eGDR is inversely associated with hyperuricemia and appears to be a promising epidemiological tool for evaluating the impact of IR on the risk of hyperuricemia.

Keywords: NHANES; estimated glucose disposal rate; hyperuricemia; insulin resistance; population-based study.


Conflict of interest statement

The authors declare that the research was conducted in the absence of any commercial or financial relationships that could be construed as a potential conflict of interest.

Figures

Graph depicting the association between eGDR and hyperuricemia risk. The pink line with shaded region indicates odds ratio (OR) with 95% confidence intervals, showing a nonlinear relationship. The OR peaks between eGDR values of 5 and 10, then declines. Significant P-values for overall and nonlinear trends are less than 0.001.
Figure 1
The results of RCS analysis.
Forest plot showing odds ratios (OR) and ninety-five percent confidence intervals (CI) for hyperuricemia across different demographics and health conditions. Categories include age, gender, race, BMI, diabetes, cardiovascular disease, and chronic kidney disease. Each category shows OR, CI, and P-values for interaction, with dots and lines representing point estimates and intervals. The baseline is centered at one on the x-axis, indicating no effect. Notable variations appear in gender and BMI, with significant P-values for gender.
Figure 2
The results of subgroup analysis.
Two graphs are shown. The left graph is a ROC curve displaying sensitivity versus 1-specificity for eGDR, TyG, and HOMA-IR indicators. The AUC values are 0.695, 0.650, and 0.642, respectively. The right graph is a decision curve analysis plotting standardized net benefit against the high-risk threshold, compared with cost-benefit ratios. The lines representing eGDR, TyG, and HOMA-IR are color-coded for differentiation.
Figure 3
The results of ROC and DCA analyses.

Similar articles

References

    1. Vareldzis R, Perez A, Reisin E. Hyperuricemia: an intriguing connection to metabolic syndrome, diabetes, kidney disease, and hypertension. Curr Hypertens Rep. (2024) 26:237–45. doi: 10.1007/s11906-024-01295-3 - DOI - PubMed
    1. So AK, Martinon F. Inflammation in gout: mechanisms and therapeutic targets. Nat Rev Rheumatol. (2017) 13:639–47. doi: 10.1038/nrrheum.2017.155 - DOI - PubMed
    1. Cabău G, Crișan TO, Klück V, Popp RA, Joosten LAB. Urate-induced immune programming: Consequences for gouty arthritis and hyperuricemia. Immunol Rev. (2020) 294:92–105. doi: 10.1111/imr.12833 - DOI - PMC - PubMed
    1. Li C, Hsieh MC, Chang SJ. Metabolic syndrome, diabetes, and hyperuricemia. Curr Opin Rheumatol. (2013) 25:210–6. doi: 10.1097/BOR.0b013e32835d951e - DOI - PubMed
    1. Li B, Chen L, Hu X, Tan T, Yang J, Bao W, et al. Association of serum uric acid with all-cause and cardiovascular mortality in diabetes. Diabetes Care. (2023) 46:425–33. doi: 10.2337/dc22-1339 - DOI - PubMed

LinkOut - more resources