. 2025 Jun 18:16:1574125.
doi: 10.3389/fendo.2025.1574125. eCollection 2025.

Sex-specific differences in the relationship between the atherogenic index and hypertension in middle-aged and elderly Chinese

Affiliations

Sex-specific differences in the relationship between the atherogenic index and hypertension in middle-aged and elderly Chinese

Zhengfeng Zhang et al. Front Endocrinol (Lausanne). .

Abstract

Background: Despite the already comprehensive epidemiological evidence concerning pre-hypertension, high-normal blood pressure, and hypertension, the influence of gender differences within this context remains inadequately explored. The present study endeavors to meticulously examine the specific impact of the plasma atherogenic index (AIP) on pre-hypertension and hypertension, and ascertain whether there exist significant sex-specific differences in this regard.

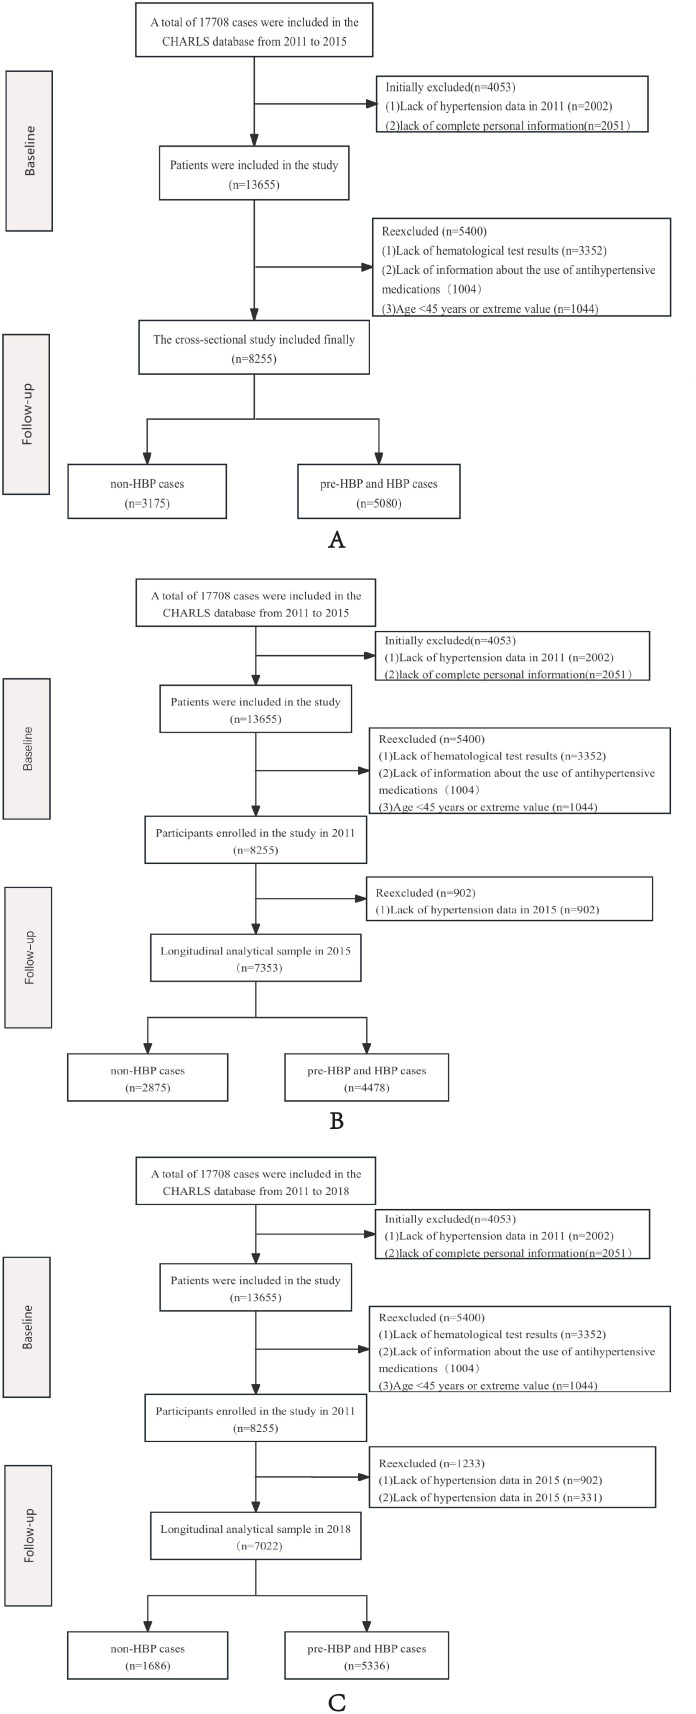
Methods: This population-based study employed a multi-wave cohort design encompassing 8255 middle-aged and elderly participants (cross-sectional phase) and longitudinal follow-ups in 2015 (n=8092) and 2018 (n=7022). Participants were stratified into normotensive (n=3175 in cross-sectional, n=2415 in 2015 longitudinal cohort study, 1868 in 2018 longitudinal cohort study) and prehypertensive/hypertensive groups (n=5080 (61.5%) in cross-sectional study, n=5677(70.2%) in longitudinal study of 2015, n=5336(76.0%) in 2018). The plasma atherogenic index=log10(triglycerides/high-density lipoprotein)[triglycerides (mg/dL)/HDL-C (mg/dL)]) was quantified enzymatically. Multivariable-adjusted logistic regression models with restricted cubic splines were implemented to evaluate nonlinear associations between AIP and blood pressure status, adjusting for age, sex, BMI, smoking, and lipid-lowering therapy. Sensitivity analyses included multiple imputation for missing covariates and sex-stratified effect modification testing.

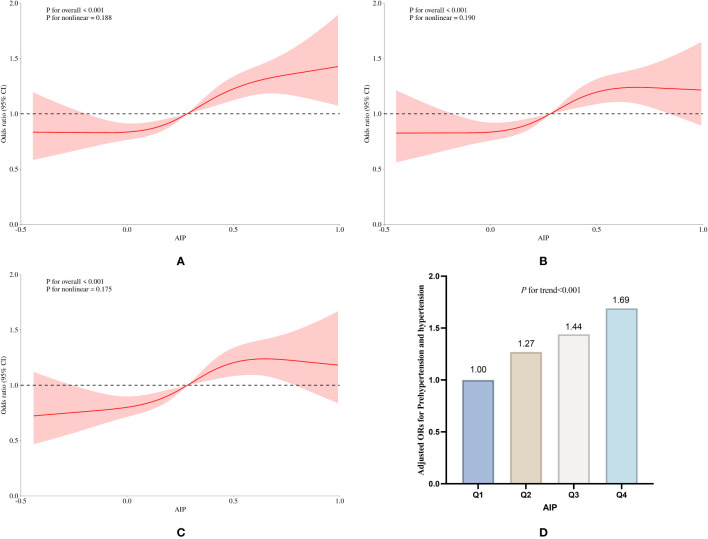
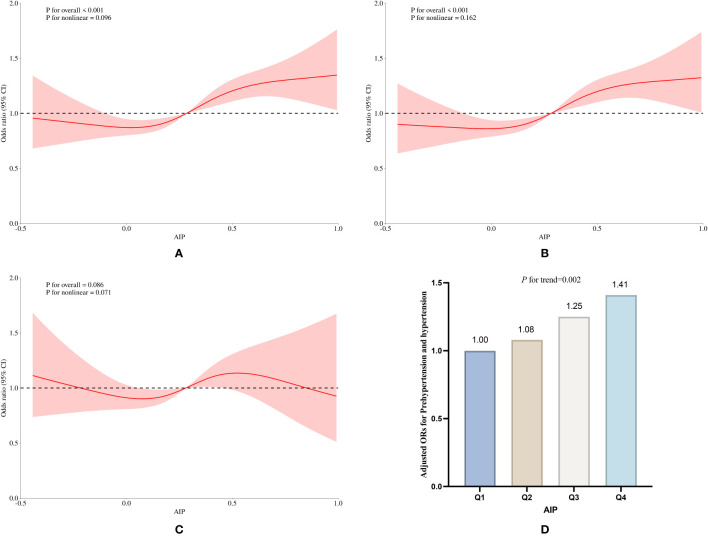
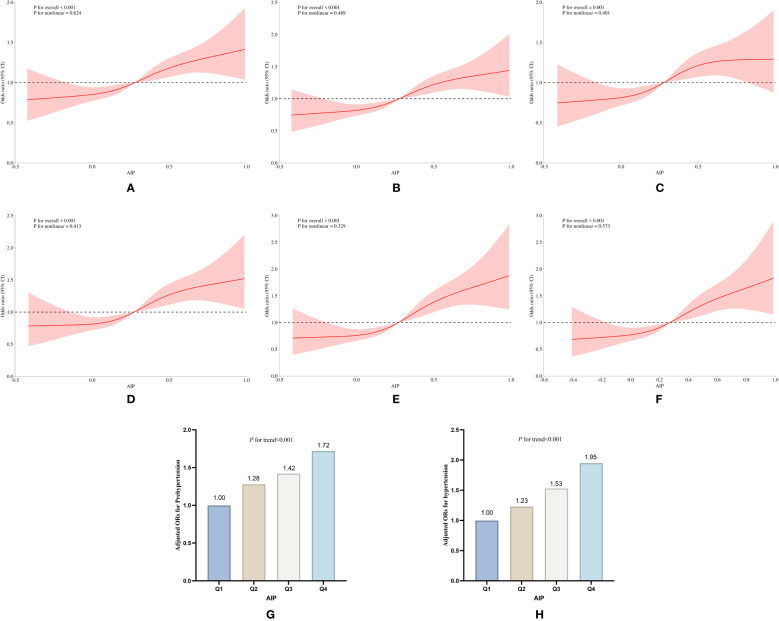
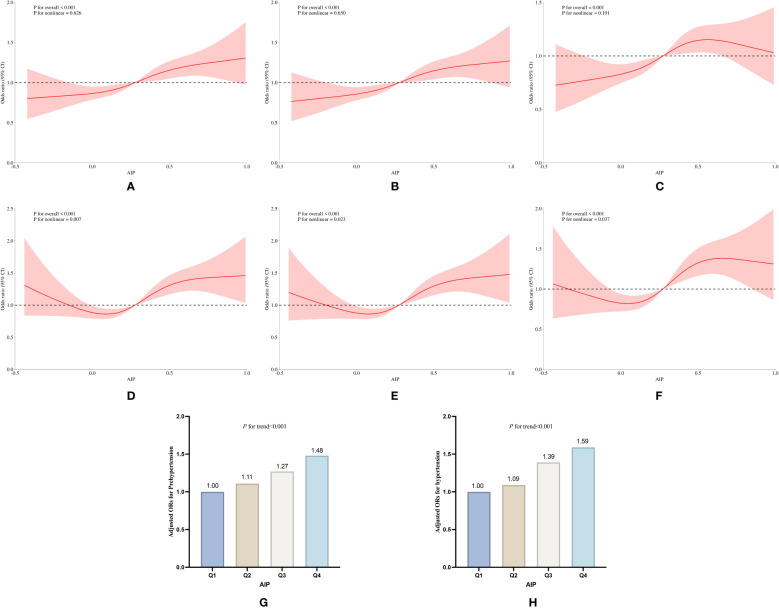
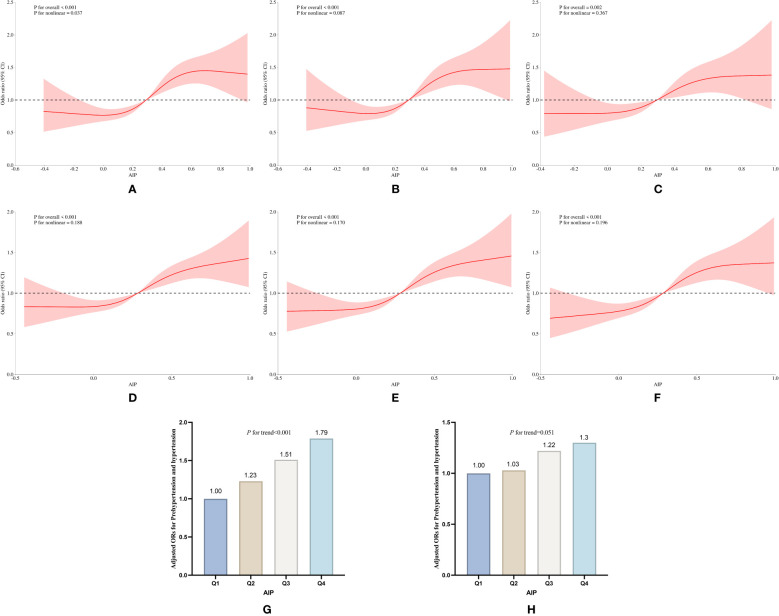
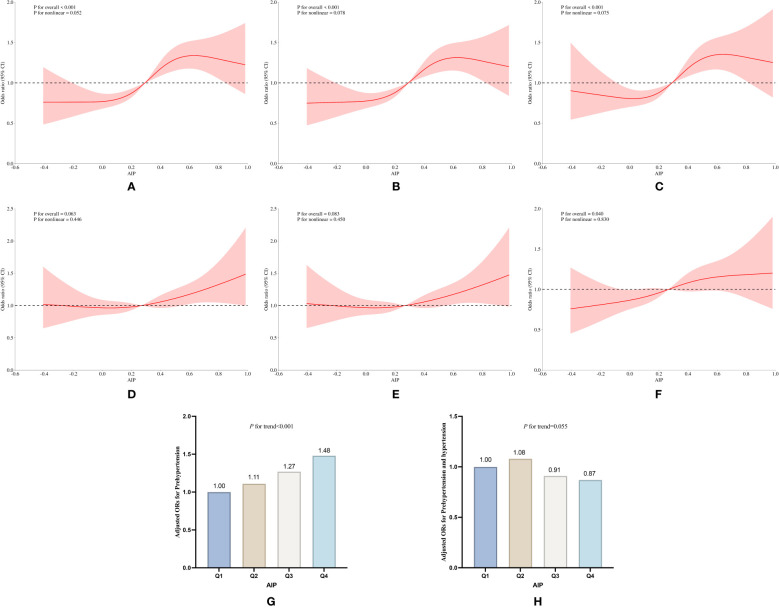
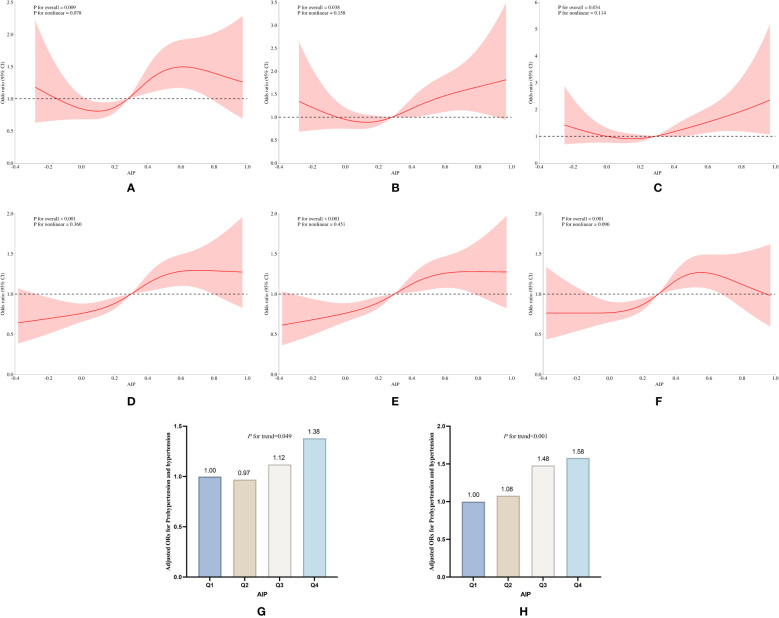
Results: This epidemiological investigation revealed population prevalences of 34.3% for pre-hypertension and 27.2% for hypertension. Both cross-sectional and longitudinal analyses demonstrated a significant positive association between AIP index and blood pressure dysregulation. Adjusted logistic regression models showed that elevated AIP corresponded to increased risks of pre-hypertension/hypertension, with cross-sectional analyses yielding an odds ratio (OR) of 1.69 (95% CI:1.38 to 2.07, P<0.001). Longitudinal cohorts of 2015 and 2018 exhibited persistent temporal trends: OR=1.38 (95% CI:1.13 to 1.67, P=0.012) in 2015 and OR=1.41 (95% CI:1.20 to 1.65, P<0.001) in 2018. Sex-stratified analyses revealed markedly stronger associations in females, where each AIP unit increase conferred a 1.79-fold cross-sectional risk elevation (OR: 1.79, 95% CI:1.35 to 2.38, P < 0.001), rising to 1.49-fold (2015 cohort: OR: 1.49, 95% CI: 1.14 to 1.95, P=0.003) and 1.64-fold (2018 cohort: OR: 1.64, 95% CI:1.31 to 2.06, P<0.001) in longitudinal assessments. Conversely, males exhibited attenuated associations (cross-sectional OR: 1.30; 95% CI:1.12 to 1.79, P=0.006; 2015 longitudinal OR: 1.26, 95% CI:1.12 to 1.66), with nonsignificant effects in the 2018 follow-up (OR: 0.87, 95% CI:0.57 to 1.31). A significant gender-AIP interaction (P<0.001) underscored sex-specific metabolic susceptibility to atherogenic lipid profiles.

Conclusion: This study identified a significant positive association between elevated atherogenic index of plasma levels and blood pressure dysregulation. Both cross-sectional and longitudinal analyses consistently demonstrated a dose-response relationship, with higher AIP levels associated with increased risk. Stratified analyses by sex revealed that the association between elevated AIP and the incidence of pre-hypertension and hypertension was significantly stronger in women.

Keywords: atherogenic index of plasma; female; hypertension; pre-hypertension; sex-specific differences.


Conflict of interest statement

The authors declare that the research was conducted in the absence of any commercial or financial relationships that could be construed as a potential conflict of interest.

Figures

Figure 1
Figure 1
The flowchart of study participants. (A) Flow chart of the cross-sectional study, (B) Flow chart of the longitudinal study in 2015, (C) Flow chart of the longitudinal study in 2018.
Figure 2
Figure 2
Association between AIP and prevalence of pre-hypertension and hypertension in the cross-sectional study. (A) RCS curves without adjustment for covariates, (B) RCS curves after adjusting for covariates such as sex, education, age, smoking and drinking status, and BM, (C) RCS curves after adjusting for covariates such as TC, LDL-C, BG, and HbA1c, the use of antihypertensive drugs and blood-lipid lowering drugs based on (B); (D) Relative odds of pre-hypertension and hypertension corresponding to quartiles of AIP.
Figure 3
Figure 3
Association between AIP and prevalence of pre-hypertension and hypertension in the longitudinal studies of 2018. (A) RCS curves without adjustment for covariates, (B) RCS curves after adjusting for covariates such as age, sex, education, age, smoking and drinking status, and BMI and income, (C) RCS curves after adjusting for covariates such as LDL_C, TC, such as TC, LDL-C, BG, and HbA1c, the use of antihypertensive drugs and blood-lipid lowering drugs based on (B); (D) Relative odds of pre-hypertension and hypertension corresponding to quartiles of AIP.
Figure 4
Figure 4
Subgroup analysis of the association of AIP with pre-hypertension and hypertension prevalence in the cross-sectional study. (A) RCS curves of AIP and pre-hypertension incidence without adjustment for covariates, (B) RCS curves of AIP and pre-hypertension incidence after adjusting for covariates such as age, sex, education, age, smoking and drinking status, and BMI, (C) RCS curves of AIP and pre-hypertension incidence after adjusting for covariates such as LDL_C, TC, blood glucose, HbA1c, the use of anti-hypertensive drugs and blood-lipid lowering drugs based on (B); (D) RCS curves of AIP and hypertension incidence without adjustment for covariates; (E) RCS curves of AIP and hypertension incidence after adjusting for covariates such as age, sex, education, age, smoking and drinking status, and BMI; (F) CS curves of AIP and pre-hypertension incidence after adjusting for covariates such as LDL_C, TC, blood glucose, HbA1c, the use of antihypertensive drugs and blood-lipid lowering drugs based on (E); (G, H) Relative odds of pre-hypertension and hypertension corresponding to quartiles of AIP.
Figure 5
Figure 5
Subgroup analysis of the association of AIP with pre-hypertension and hypertension prevalence in the Longitudinal study of 2018. (A) RCS curves of AIP and pre-hypertension incidence without adjustment for covariates, (B) RCS curves of AIP and pre-hypertension incidence after adjusting for covariates such as age, sex, education, age, smoking and drinking status, and BMI, (C) RCS curves of AIP and pre-hypertension incidence after adjusting for covariates such as LDL_C, TC, blood glucose, HbA1c, the use of anti-hypertensive drugs and blood-lipid lowering drugs based on (B); (D) RCS curves of AIP and hypertension incidence without adjustment for covariates; (E) RCS curves of AIP and hypertension incidence after adjusting for covariates such as age, sex, education, age, smoking and drinking status, and BMI; (F) CS curves of AIP and pre-hypertension incidence after adjusting for covariates such as LDL_C, TC, blood glucose, HbA1c, the use of antihypertensive drugs and blood-lipid lowering drugs based on (E); (G, H) Relative odds of pre-hypertension and hypertension corresponding to quartiles of AIP.
Figure 6
Figure 6
Subgroup analysis of the association of AIP with pre-hypertension and hypertension prevalence between sexes in the cross-sectional study. (A) RCS curves of AIP versus pre-hypertension and hypertension in females without covariate adjustment, (B) RCS curves of AIP and prevalence of pre-hypertension and hypertension in females after adjusting for age, education, age, smoking, and drinking status, and BMI, (C) RCS curves of AIP and prevalence of pre-hypertension and hypertension in females after adjusting for covariates such as LDL_C, TC, blood glucose, HbA1c, using of antihypertensive drugs and blood-lipid lowering drugs based on (B); (D) RCS curves of AIP versus pre-hypertension and hypertension in males without covariate adjustment; (E) RCS curves of AIP and prevalence of pre-hypertension and hypertension in males after adjusting for age, education, age, smoking, and drinking status, and BMI, (F) RCS curves of AIP and prevalence of pre-hypertension and hypertension in males after adjusting for covariates such as LDL_C, TC, blood glucose, HbA1c, the use of antihypertensive drugs and blood-lipid lowering drugs based (E); (G, H) Relative odds of pre-hypertension and hypertension in male and female groups corresponding to quartiles of AIP.
Figure 7
Figure 7
Subgroup analysis of the association of AIP with pre-hypertension and hypertension prevalence between the sexes in the longitudinal study of 2018. (A) RCS curves of AIP versus pre-hypertension and hypertension in females without covariate adjustment, (B) RCS curves of AIP and prevalence of pre-hypertension and hypertension in females after adjusting for age, education, age, smoking, and drinking status, and BMI, (C) RCS curves of AIP and prevalence of pre-hypertension and hypertension in females after adjusting for covariates such as LDL_C, TC, blood glucose, HbA1c, using of antihypertensive drugs and blood-lipid lowering drugs based on (B); (D) RCS curves of AIP versus pre-hypertension and hypertension in males without covariate adjustment; (E) RCS curves of AIP and prevalence of pre-hypertension and hypertension in males after adjusting for age, education, age, smoking, and drinking status, and BMI, (F) RCS curves of AIP and prevalence of pre-hypertension and hypertension in males after adjusting for covariates such as LDL_C, TC, blood glucose, HbA1c, the use of antihypertensive drugs and blood-lipid lowering drugs based (E); (G, H) Relative odds of pre-hypertension and hypertension in male and female groups corresponding to quartiles of AIP.
Figure 8
Figure 8
AIP and hypertension prevalence by menopausal status: 2018 subgroup analysis. (A) RCS curves of unadjusted AIP and pre-hypertension/hypertension prevalence in premenopausal women, (B) RCS curves of AIP and pre-hypertension/hypertension incidence after adjusting for covariates such as age, education, age, smoking and drinking status, and BMI in premenopausal women, (C) RCS curves of AIP and pre-hypertension/hypertension incidence after adjusting for covariates such as LDL_C, TC, blood glucose, HbA1c, the use of antihypertensive drugs and blood-lipid lowering drugs based on (B); (D) RCS curves of unadjusted AIP and pre-hypertension/hypertension prevalence in postmenopausal women; (E) RCS curves of AIP and pre-hypertension/hypertension incidence after adjusting for covariates such as age,education, age, smoking and drinking status, and BMI in postmenopausal women, (F) RCS curves of AIP and pre-hypertension/hypertension incidence after adjusting for covariates such as LDL_C, TC, blood glucose, HbA1c, the use of antihypertensive drugs and blood-lipid lowering drugs based on (E); (G, H) Relative odds of pre-hypertension/ hypertension corresponding to quartiles of AIP in premenopausal and postmenopausal women.
Figure 9
Figure 9
ROC curve analysis of hematological parameters for predicting pre-hypertension and hypertension in the middle-aged and elderly Chinese population. (A–I) ROC curve of TG, TC, LDL-C, AIP, BMI, HDL-C, AIP_LDL-C, AIP_TC, AIP_BMI.

Similar articles

References

    1. Zhang M, Shi Y, Zhou B, Huang Z, Zhao Z, Li CB, et al. Prevalence, awareness, treatment, and control of hypertension in China, 2004-18: findings from six rounds of a national survey. BMJ. (2023) 380:e071952. doi: 10.1136/bmj-2022-071952 - DOI - PMC - PubMed
    1. Nguyen TN, Chow CK. Global and national high blood pressure burden and control. Lancet. (2021) 398:932–3. doi: 10.1016/S0140-6736(21)01688-3 - DOI - PubMed
    1. Worldwide trends in hypertension prevalence and progress in treatment and control from 1990 to 2019: a pooled analysis of 1201 population-representative studies with 104 million participants. Lancet. (2021) 398:957–80. doi: 10.1016/S0140-6736(21)01330-1; - DOI - PMC - PubMed
    1. Zhou M, Wang H, Zeng X, Yin P, Zhu J, Chen W, et al. Mortality, morbidity, and risk factors in China and its provinces, 1990-2017: a systematic analysis for the Global Burden of Disease Study 2017. Lancet. (2019) 394:1145–58. doi: 10.1016/S0140-6736(19)30427-1 - DOI - PMC - PubMed
    1. Ventura HO, Lavie CJ. Antihypertensive therapy for prehypertension: relationship with cardiovascular outcomes. Jama-j Am Med Assoc. (2011) 305:940–1. doi: 10.1001/jama.2011.256 - DOI - PubMed

Supplementary concepts

LinkOut - more resources