. 2025;4(1):31.
doi: 10.1007/s44162-025-00094-x. Epub 2025 Jul 1.

Disruption of Lrpprc affects B cell development and proliferation in a mouse model of Leigh Syndrome French Canadian type

Collaborators, Affiliations

Disruption of Lrpprc affects B cell development and proliferation in a mouse model of Leigh Syndrome French Canadian type

Adrien Fois et al. J Rare Dis (Berlin). 2025.

Abstract

Purpose: Leigh Syndrome French Canadian (LSFC) is a rare autosomal recessive metabolic disorder characterized by severe lactic acidosis crises and early mortality. LSFC patients carry variants in the Leucine Rich Pentatricopeptide Repeat Containing (LRPPRC) nuclear gene, which lead to defects in the respiratory chain complexes and mitochondrial dysfunction. Mitochondrial respiration modulates cellular metabolic activity, which impacts many cell processes, including the differentiation and function of immune cells. The purpose of this study is to define the role of Lrpprc on immune cell function.

Methods: As genetic deletion of Lrpprc is not viable, we generated two conditional mouse models: a model for systemic deletion of Lrpprc and a knock-in (KI) model carrying the most common LSFC pathogenic variant in Quebec, NM_133259.4(LRPPRC):c.1061C > T (p.Ala354Val).

Results: We demonstrate that Lrpprc is an essential gene even in adult mice, as systemic deletion of Lrpprc leads to prominent weight loss and mortality. We also find an increase in lactate levels, a symptom of metabolic crises in LSFC. Lrpprc deletion and pathogenic variant affect various immune cell subsets, with a strong impact on B cell development and proliferation.

Conclusions: We generated a viable disease-relevant mouse model to study the role of Lrpprc in vivo and find that disruption of Lrpprc strongly impairs B cell development and proliferation.

Supplementary information: The online version contains supplementary material available at 10.1007/s44162-025-00094-x.

Keywords: B cells; Immune cells; LRPPRC; LSFC; Mitochondria; Proliferation.


Conflict of interest statement

Competing interestsThe authors declare no competing interests.

Figures

Fig. 1
Fig. 1
Validation of LSFC mouse models. a Left, immunoblotting analysis of Lrpprc from spleen cells from mice six weeks after gavage. The top band corresponds to the molecular weight of Lrpprc. Representative images of three independent experiments. Right, compilations of Lrpprc on β-actin ratio (n = 1–7). b Weight evolutions of mice six weeks after gavage compared to the day of the first gavage (n = 8–17). c Blood parameters of mice six weeks after gavage. The data were acquired from at least three independent experiments. Each dot represents data from an individual mouse and the dash depicts the mean with the standard deviation. *P < 0.05; *** P < 0.001. The post-gavage Lrpprc genotypes are indicated on the x axes
Fig. 2
Fig. 2
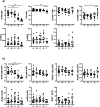
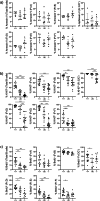
Lrpprc disruption impacts the lymphocyte pool. a Compilation of the percentage (n = 7–15) and b absolute number (n = 8–15) of spleen cells gated as detailed in supplementary Fig. 1a. The data were acquired from at least three independent experiments. Each dot represents data from an individual mouse, and the dash depicts the mean with the standard deviation. *P < 0.05; *** P < 0.001. The post-gavage Lrpprc genotypes are indicated on the x axes
Fig. 3
Fig. 3
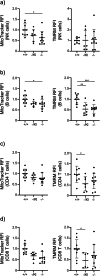
Lrpprc affects mitochondrial mass and mitochondrial membrane potential in immune cells. Left, compilation of MitoTracker MFI expression and, right, compilation of TMRM MFI expression for a NK, b B, c CD4 T, and d CD8 T cells from each mouse (n = 7–10). The data were acquired from at least three independent experiments. Each dot represents data from an individual mouse, normalized to the mean expression level in wild type mice from the same experiment. The dash depicts the mean with the standard deviation. *P < 0.05; **P < 0.01; *** P < 0.001. The post-gavage Lrpprc genotypes are indicated on the x axes
Fig. 4
Fig. 4
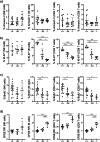
Lrpprc promotes cell proliferation. a Compilation of the percentage of apoptotic (Annexin V+ Viability Dye) NK, B, CD4, and CD8 T cells. (n = 9–11). b Compilation of the percentage of proliferating (KI-67+) NK, B, CD4, and CD8 T cells. (n = 5–7). c Compilation of the percentage of proliferating (BrdU+) NK, B, CD4, and CD8 T cells. (n = 4–13). d Compilation of CFSE RFI expression on NK, B, CD4, and CD8 T cells (n = 4–11). The data were acquired from at least three independent experiments. Each dot represents data from an individual mouse, normalized to the mean expression level in Lrpprc+/+ mice from the same experiment. The dash depicts the mean with the standard deviation. *P < 0.05; **P < 0.01; *** P < 0.001. The post-gavage Lrpprc genotypes are indicated on the x axes
Fig. 5
Fig. 5
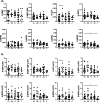
Hematopoietic precursors pool is not affected by Lrpprc deletion. a Compilation of the percentage (n = 7–19) and b absolute number (n = 6–19) of hematopoietic precursors gated as detailed in supplementary Fig. 1b. The data were acquired from at least three independent experiments. Each dot represents data from an individual mouse, and the dash depicts the mean with the standard deviation. *P < 0.05. The post-gavage Lrpprc genotypes are indicated on the x axes
Fig. 6
Fig. 6
Lrpprc did not promote cell proliferation and apoptosis of hematopoietic precursors. a Compilation of the percentage of apoptotic (Annexin V+ Viability Dye) hematopoietic precursors (n = 4–7). b Compilation of the percentage of proliferating (KI-67+) hematopoietic precursors (n = 10–12). c Compilation of the percentage of proliferating (BrdU+) hematopoietic precursors (n = 4–13). The data were acquired from at least three independent experiments. Each dot represents data from an individual mouse, and the dash depicts the mean with the standard deviation. The post-gavage Lrpprc genotypes are indicated on the x axes
Fig. 7
Fig. 7
Lrpprc disruption impacts the B cell development. a Compilation of the percentage (n = 8–33) and b absolute number (n = 8–33) of B cell precursors cell gated as detailed in supplementary Fig. 1c. The data were acquired from at least three independent experiments. Each dot represents data from an individual mouse, and the dash depicts the mean with the standard deviation. *P < 0.05; *** P < 0.001. The post-gavage Lrpprc genotypes are indicated on the x axes
Fig. 8
Fig. 8
Lrpprc promotes the proliferation of B cell precursors. a Compilation of the percentage of apoptotic (Annexin V+ Viability Dye) B cell precursors (n = 5–7). b Compilation of the percentage of proliferating (KI-67+) B cell precursors (n = 11–17). c Compilation of the percentage of proliferating (BrdU+) B cell precursors (n = 8–14). The data were acquired from at least three independent experiments. Each dot represents data from an individual mouse, and the dash depicts the mean with the standard deviation. *P < 0.05; **P < 0.01; *** P < 0.001. The post-gavage Lrpprc genotypes are indicated on the x axes
Fig. 9
Fig. 9
Lrpprc affects mitochondrial mass and mitochondrial membrane potential in B cell precursors. a Compilation of MitoTracker MFI expression for B cell precursors from each mouse strain (n = 5–7). b Compilation of TMRM MFI expression of B cell precursor from each mouse strain (n = 5–7). The data were acquired from at least three independent experiments. Each dot represents data from an individual mouse, normalized to the mean expression level in wild type mice from the same experiment. The dash depicts the mean with the standard deviation. *P < 0.05; **P < 0.01. The post-gavage Lrpprc genotypes are indicated on the x axes

References

    1. Finsterer J. Leigh and Leigh-like syndrome in children and adults. Pediatr Neurol. 2008;39(4):223–35. - PubMed
    1. Sofou K, De Coo IF, Isohanni P, Ostergaard E, Naess K, De Meirleir L, et al. A multicenter study on Leigh syndrome: disease course and predictors of survival. Orphanet J Rare Dis. 2014;9:52. - PMC - PubMed
    1. Morin C, Mitchell G, Larochelle J, Lambert M, Ogier H, Robinson BH, et al. Clinical, metabolic, and genetic aspects of cytochrome C oxidase deficiency in Saguenay-Lac-Saint-Jean. Am J Hum Genet. 1993;53(2):488–96. - PMC - PubMed
    1. Merante F, Petrova-Benedict R, MacKay N, Mitchell G, Lambert M, Morin C, et al. A biochemically distinct form of cytochrome oxidase (COX) deficiency in the Saguenay-Lac-Saint-Jean region of Quebec. Am J Hum Genet. 1993;53(2):481–7. - PMC - PubMed
    1. Debray FG, Morin C, Janvier A, Villeneuve J, Maranda B, Laframboise R, et al. LRPPRC mutations cause a phenotypically distinct form of Leigh syndrome with cytochrome c oxidase deficiency. J Med Genet. 2011;48(3):183–9. - PubMed

LinkOut - more resources