. 2025 Jun 16:30:195-206.
doi: 10.1016/j.reth.2025.06.003. eCollection 2025 Dec.

Influence of extracorporeal shockwaves on macrophage polarization in a 3D collagen matrix

Affiliations

Influence of extracorporeal shockwaves on macrophage polarization in a 3D collagen matrix

Diana Heimes et al. Regen Ther. .

Abstract

Introduction: The host's immune response determines the success of guided tissue regeneration. Extracorporeal shockwave therapy (ESWT) has been shown to reduce inflammation and improve wound healing. Nevertheless, its impact on macrophage polarization, as the first line of host defense, has not yet been elucidated. Therefore, this study aimed to investigate the effect of ESWT on macrophage polarization in a 3D collagen matrix model.

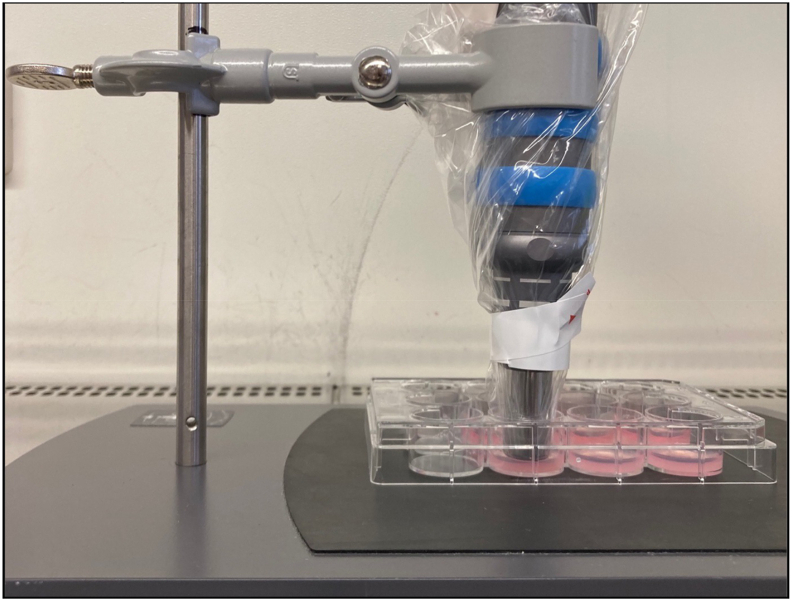
Methods: Macrophages were isolated from human donor blood and differentiated into M1 macrophages. The cells were seeded into a collagen gel, and macrophages treated with ESWT (500 impulses, energy flux density 0.12 mJ/mm2) (+ESWT) were compared to non-treated cells (-ESWT). Furthermore, macrophages treated with 20 ng/μl IL-4 and 50 ng/μl M-CSF for M2-polarization in the gel (1.) or on a 6-well cell culture plate with Upcell™ surface (2.) as well as M1 macrophages cultured on a conventional cell culture dish (3.) served as reference cultures. Flow cytometry assessed polarization into M2 macrophages by measuring the expression of CD209, CD86, CD200R, and CD163.

Results: Flow cytometry revealed no significant differences between the ESWT-treated (+ESWT) and untreated (-ESWT) macrophages for any of the markers. However, macrophages cultured in collagen gel (3) exhibited significantly higher CD200R expression rates than the other groups.

Conclusions: The lack of significant differences in macrophage polarization following ESWT in this 3D model may be attributed to the absence of cell-cell interactions and other tissue structures that are present in vivo. Since the culturing environment significantly affected the expression of M2-polarization markers, with a significantly higher expression in collagen gel compared to cell culture plates, future studies should incorporate more complex co-culture systems or in vivo models to better simulate the clinical environment. Clinical evidence suggests that ESWT can effectively promote tissue healing and regeneration, indicating that the observed results may reflect limitations in the chosen model or cell type rather than the therapy itself, warranting further investigation.

Keywords: 3D model; Collagen matrix; ESWT; Extracorporeal shockwave therapy; Macrophage polarization.


Conflict of interest statement

All authors were funded by the supporting societies.

Figures

Fig. 1
Fig. 1
Timeline of the Experimental Setup. It was divided into two separate phases: I) the isolation and differentiation of the cells, and II) the execution of the experiment itself. At the beginning of phase 2, the macrophages were harvested from their cell culture plates and subsequently analyzed by FACS; this population represents the “untreated” group. The cells were then divided into four subgroups and prepared with the corresponding medium additives. The groups “+ ESWT” and “– ESWT” were cultured in gel on a 12-well cell culture plate with both, the culture medium and the gel, supplemented with 50 ng/μl rh GM-CSF. On day 8, a single application of ESWT was performed in the “+ ESWT” subgroup. For the “Positive Control Gel”, the cells were cultured in gel on a 12-well cell culture plate, with the addition of 50 ng/μl rh M-CSF and 20 ng/μl rh IL-4 to both the gel and the culture medium. The “Positive Control Cell Culture Plate” subgroup was cultured on a 6-well cell culture plate with the addition of 50 ng/μl rh M-CSF and 20 ng/μl rh IL-4 to the culture medium. Created with BioRender. com.
Fig. 2
Fig. 2
Extracorporeal shockwave application. For this purpose, the applicator head and the handpiece were covered with a sterile disposable cover. The handpiece was clamped into a stand so that the applicator head comes into direct contact with the gel. After the removal of the medium, shockwaves were applied by placing the metal applicator of the handpiece on the collagen gel. The “+ESWT” group was treated with 500 impulses of an energy flux density of 0.12 mJ/mm2 (3 bar air pressure, 5 Hz frequency).
Fig. 3
Fig. 3
Overview of MFI values of the CD209 expression measured by flow cytometry. The MFI values of the CD209 expression are presented as a boxplot (median and interquartile range) and divided into four subgroups based on the type of treatment: “+ESWT” (n = 10), “–ESWT”(n = 10), “Untreated” (n = 9), and “Positive Control Gel” (n = 6). Individual data points are represented as dots in the bar chart. Macrophages from the same patient are consistently color-coded across all images. No statistically significant differences could be observed between the groups (“–ESWT” vs. “+ESWT”: p = 0.703; “+ESWT” vs. “Untreated”: p = 0.713; “+ESWT” vs. “Positive Control Gel”: p = 0.278; “–ESWT” vs. “Untreated”: p = 0.348; “–ESWT” vs. “Positive Control Gel”: p = 0.211; “Untreated” vs. “Positive Control Gel”: p = 0.075).
Fig. 4
Fig. 4
Overview of MFI values of CD86 expression measured by flow cytometry. The MFI values of the CD86 antibody in flow cytometry are presented as a boxplot (median and interquartile range) and divided into four subgroups based on the type of treatment: “+ESWT” (n = 10), “–ESWT“ (n = 10), “Untreated” (n = 9), and “Positive Control Gel” (n = 6). Individual data points are represented as dots in the bar chart. Macrophages from the same patient are consistently color-coded across all images. No statistically significant differences could be observed between the groups (“–ESWT” vs. “+ESWT”: p = 0.912; “+ESWT” vs. “Untreated”: p = 0.154; “+ESWT” vs. “Positive Control Gel”: p = 0.780; “–ESWT” vs. “Untreated”: p = 0.178; “–ESWT” vs. “Positive Control Gel”: p = 0.695; “Untreated” vs. “Positive Control Gel”: p = 0.060).
Fig. 5
Fig. 5
Overview of MFI values of CD200R expression measured by flow cytometry. The MFI values of the CD200R antibody in flow cytometry are presented as a boxplot (median and interquartile range) and divided into four subgroups based on the type of treatment: “+ESWT” (n = 10), “–ESWT “(n = 10), “Untreated” (n = 9), and “Positive Control Gel” (n = 6). Individual data points are represented as dots in the bar chart. Macrophages from the same patient are consistently color-coded across all images. Statistically significant differences could be observed for the following groups: “+ESWT” vs. “Untreated”: p = 0.030; “+ESWT” vs. “Positive Control Gel”: p < 0.001; “–ESWT” vs. “Untreated”: p = 0.023; “–ESWT” vs. “Positive Control Gel”: p < 0.001; “Untreated” vs. “Positive Control Gel”: p < 0.001). No significant differences could be observed between the “–ESWT” and the “+ESWT” groups (p = 0.880). ∗∗∗p < 0.001, ∗p < 0.05.
Fig. 6
Fig. 6
Overview of MFI values of CD163 expression measured by flow cytometry. The MFI values of the CD163 antibody in flow cytometry are presented as a boxplot (median and interquartile range) and divided into four subgroups based on the type of treatment: “+ESWT” (n = 10), “–ESWT “(n = 10), “Untreated” (n = 9), and “Positive Control Gel” (n = 6). Individual data points are represented as dots in the bar chart. Macrophages from the same patient are consistently color-coded across all images. No statistically significant differences could be observed between the groups (“+ESWT” vs. “–ESWT”: p = 0.919; “+ESWT” vs. “Untreated”: p = 0.933; “+ESWT” vs. “Positive Control Gel”: p = 0.624; “–ESWT” vs. “Untreated”: p = 0.862; “–ESWT” vs. “Positive Control Gel”: p = 0.565; “Untreated” vs. “Positive Control Gel”: p = 0.724).

References

    1. Fetz A.E., Radic M.Z., Bowlin G.L. Neutrophils in biomaterial-guided tissue regeneration: matrix reprogramming for angiogenesis. Tissue Eng Part B Rev. 2021;27(2):95–106. doi: 10.1089/ten.TEB.2020.0028. - DOI - PubMed
    1. Sieger D., Korzinskas T., Jung O., Stojanovic S., Wenisch S., Smeets R., et al. The addition of high doses of hyaluronic acid to a biphasic bone substitute decreases the proinflammatory tissue response. Int J Mol Sci. 2019;20(8) doi: 10.3390/ijms20081969. - DOI - PMC - PubMed
    1. Kammerer P.W., Schiegnitz E., Alshihri A., Draenert F.G., Wagner W. Modification of xenogenic bone substitute materials--effects on the early healing cascade in vitro. Clin Oral Implants Res. 2014;25(7):852–858. doi: 10.1111/clr.12153. - DOI - PubMed
    1. Kammerer P.W., Scholz M., Baudisch M., Liese J., Wegner K., Frerich B., et al. Guided bone regeneration using collagen scaffolds, growth factors, and periodontal ligament stem cells for treatment of peri-implant bone defects in vivo. Stem Cell Int. 2017;2017 doi: 10.1155/2017/3548435. - DOI - PMC - PubMed
    1. Dau M., Volprich L., Grambow E., Vollmar B., Frerich B., Al-Nawas B., et al. Collagen membranes of dermal and pericardial origin-In vivo evolvement of vascularization over time. J Biomed Mater Res. 2020;108(12):2368–2378. doi: 10.1002/jbm.a.36989. - DOI - PubMed

LinkOut - more resources