. 2025 Jun 18:16:1587860.
doi: 10.3389/fimmu.2025.1587860. eCollection 2025.

ER stress genes (COL1A1, LOXL2, VWF) predicts IKK-16 as a Candidate therapeutic target for colitis-related inflammation and fibrosis suppression

Affiliations

ER stress genes (COL1A1, LOXL2, VWF) predicts IKK-16 as a Candidate therapeutic target for colitis-related inflammation and fibrosis suppression

Ke Zhang et al. Front Immunol. .

Abstract

Introduction: The role of endoplasmic reticulum stress (ERS) in the immune-inflammatory dysregulation and intestinal fibrosis associated with ulcerative colitis (UC) remains unclear. This study aims to identify ERS-related genes involved in UC fibrosis and explore potential therapeutic targets.

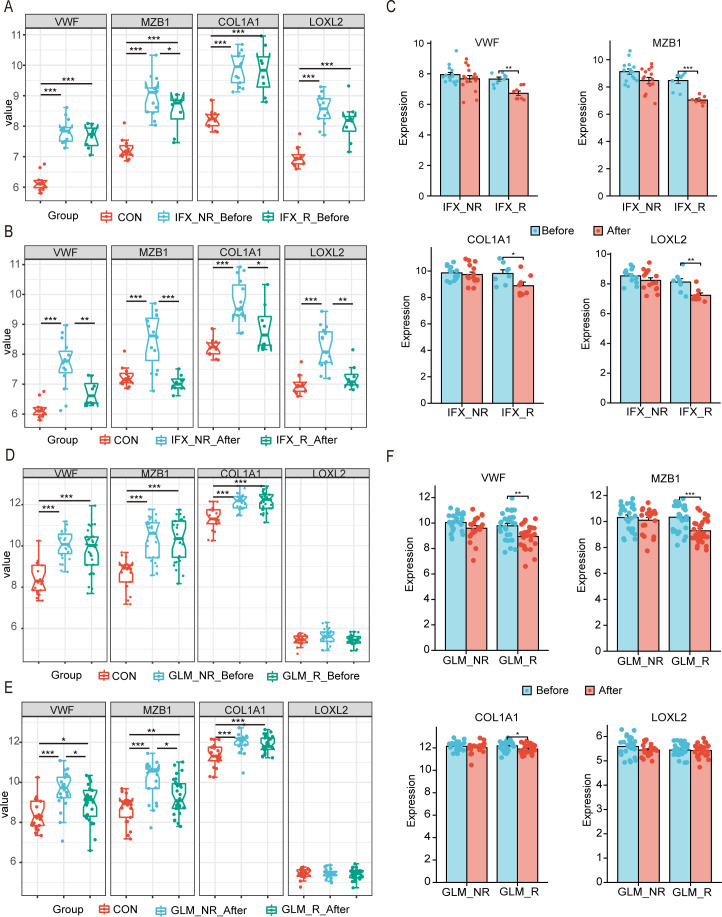
Methods: Differentially expressed ERS-related genes (DE-ERGs) were identified through comprehensive analysis of public datasets. Machine learning methods screened VWF, MZB1, COL1A1, and LOXL2 as key regulators. Immune infiltration analysis, protein-protein interaction (PPI) network analysis, and gene set variation analysis (GSVA) were performed to clarify their roles in UC fibrosis. Drug prediction was conducted using the Connectivity Map (CMap) database, supplemented by a literature review.

Results: The predicted drugs were ranked based on their binding affinities as follows: IKK-16 > Quercetin > Curcumin > Resveratrol > Budesonide > Trimebutine > Colchicine > Betamethasone > Pioglitazone > Metformin. IKK-16 showed the highest binding affinity for treating UC fibrosis. COL1A1, LOXL2, and VWF were identified as key drivers of UC intestinal fibrosis, supported by immune infiltration and PPI network analyses.

Discussion: These results suggest that ERS-related genes, particularly COL1A1, LOXL2, and VWF, may regulate UC fibrosis through interactions with immune cells. IKK-16 shows promise as a therapeutic agent. These findings provide new insights into UC pathogenesis and potential clinical treatment strategies.

Keywords: ER stress; bioinformatics analysis; immune infiltration; inflammation; intestinal fibrosis; molecular docking.


Conflict of interest statement

The authors declare that the research was conducted in the absence of any commercial or financial relationships that could be construed as a potential conflict of interest.

Figures

Figure 1
Figure 1
Flowchart of the study.
Figure 2
Figure 2
The identification and functional enrichment analysis of DEGs between the UC group and CON group in two training datasets. (A, B) Volcano plot representation of differential gene expression in GSE206285 and GSE92415. (C, D) KEGG pathway enrichment analysis of DEGs in GSE206285 and GSE92415.
Figure 3
Figure 3
Selection and identification of Hub DE-ERGs using machine learning methods. (A) The upset plot shows the overlap between ERGs and DEGs of the two training sets. (B) The bidirectional bar plot illustrates the expression trends of 100 DE-ERGs under different LogFC conditions consistent with two identical training sets. The logFC values indicated in the figure (logFC = 1, 2, 3, 5) correspond to fold changes of 2-fold, 4-fold, 8-fold, and 32-fold in expression levels, respectively. (C) LASSO coefficient profiles of the 100 DE-DEGs. Different colors are used for visual differentiation between genes. (D) Cross-validation selects the optimal tuning parameter log(λ) in LASSO regression analysis, filtering out 8 most strongly correlated DE-DEGs. (E) The Increment mean squared error method (IncMSE) and (F) gini coefficient method (IncNodePurity) in a random forest classifier yielded the following results. The importance index is on the x-axis, and the genetic variable is on the y-axis. (G) The intersection of LASSO, IncMSE, and IncNodePurity results. (H) ROC curves of hub-genes in the GSE206285 dataset. (I) ROC curves of hub-genes in the GSE92415 dataset.
Figure 4
Figure 4
The immune characteristics between the UC group and healthy controls in the GSE206285 and GSE92415 via CIBERSORT. (A, B) Stacked bar graph show the relative composition of 22 immune cell subsets in the two datasets. (C, D) Boxplots show that the difference in the proportion of immune cells between the CON and UC groups in the two datasets. Data were assessed via the method of Benjamini and Hochberg (BH). * adj. p-value < 0.05, ** adj. p-value < 0.01, *** adj. p-value < 0.001, **** adj. p-value < 0.0001, ns, no significance.
Figure 5
Figure 5
Correlation analysis of hubs with immune cells in the GSE206285 and GSE92415. (A, B) Heatmap delineating the correlation hubs with 22 immune cell types. The color scale represents Pearson correlation coefficients (Cor) ranging from –1 to 1, with red indicating positive correlation and blue indicating negative correlation. Asterisks denote statistical significance. P-values were calculated using Pearson correlation analysis and adjusted for multiple testing using the Benjamini-Hochberg method (FDR). *P < 0.05, **P< 0.01, ***P < 0.001.
Figure 6
Figure 6
External datasets validated the high expression of hub genes in patients with active UC and colonic inflammatory tissues. (A) Split violin plot revealing the expression differences in hubs between UC patients and healthy controls in the GSE36807. (B) ROC curves of hubs in the GSE36807. (C) Split violin plot revealing the expression differences in hubs between inflammatory tissues and non-inflammatory tissues in the GSE66407. (D) ROC curves of hubs in the GSE66407. (E) Split violin plot revealing the expression differences in hubs active UC and remission patients in the GSE128682. (F) ROC curves of hubs in the GSE128682. (G-I) ROC analysis based on hubs combination in GSE36807 (G), GSE66407 (H) and GSE128682 (I). *P < 0.05, ***P < 0.001.
Figure 7
Figure 7
Evaluate the impact of biologics on hub genes using drug sensitivity analysis. (A-C) The relative expression levels of hubs in the colonic mucosa of healthy controls, UC patients in not responding and responding groups before and after IFX therapy. (D-F) The relative expression levels of hubs in the colonic mucosal of healthy controls, UC patients in responding and non-responding groups before and after GLM treatment. IFX, infliximab; GLM, golimumab. *P < 0.05, **P< 0.01, ***P < 0.001.
Figure 8
Figure 8
Animal models validated the hubs related to endoplasmic reticulum stress. (A) Body weight changes (n=6), (B) Colonic length changes (n=6) between CON and UC mice. (C) mice with bloody stools and Representative H&E staining of the colon (magnification ×100, n=6), (D) The expression of TNF-α, INF-γ, IL-1β and IL-6 in the serum. (E) The mRNA expression levels of the hub genes, Vwf, Mzb1, Loxl2 and Col1a1 in UC and CON samples by RT-qPCR (n=6). Statistical analysis by two-sided Student’s t tests in (B, D) INF-γ and IL-6, the Mann-Whitney U test in (D) TNF-α, the Welch test in (D) IL-1β and (E). *P<0.05, **P<0.01, ***P<0.001. Data are show as mean ± SD.
Figure 9
Figure 9
PPI network construction and pathway enrichment analysis of fibrosis-related genes. (A) Visualization of the PPI network of hub genes (COL1A1, LOXL2, VWF, and MZB1) using STRING. (B) Reactome pathway enrichment analysis of hub genes revealed major pathways associated with extracellular matrix organization and collagen fibril crosslinking. The size of the dots represents the number of genes in each pathway, while the color indicates the FDR value. The signal strength on the x-axis reflects the significance of the pathways. (C) The extended PPI network illustrates the interactions between hub genes and classical fibrosis-related genes. Nodes represent proteins, and the edge colors indicate the type of interaction (e.g., experimental evidence, co-expression).
Figure 10
Figure 10
Correlation analysis of hub genes with fibrosis-related GSVA scores in GSE206285 and GSE92415 datasets. (A, B) Violin plots showing the distribution of GSVA scores for fibrosis-related gene sets between the CON (control) and UC (ulcerative colitis) groups in the GSE206285 (A) and GSE92415 (B) datasets. (C-F) Scatter plots depicting the correlation between fibrosis-related GSVA scores and the expression levels of COL1A1, LOXL2, VWF, and MZB1 in the GSE206285 dataset. (G-J) Scatter plots showing the relationship between hub gene expression levels and GSVA scores in the GSE92415 dataset. The x-axis represents gene expression levels, and the y-axis represents GSVA scores. Each dot corresponds to an individual sample. Sample sizes: GSE206285 - CON (n = 18), UC (n = 550); GSE92415 - CON (n = 21), UC (n = 162). The trend line indicates the direction of linear correlation, and the gray shading indicates the confidence interval for the linear fit. Spearman’s correlation coefficient (R) > 0 indicates a positive correlation, and a p-value < 0.05 denotes statistical significance.
Figure 11
Figure 11
Molecular docking analysis of small molecules with fibrosis-associated proteins. (A–D) Binding modes of the small molecule IKK-16 with fibrosis-associated proteins. (E–H) Binding modes of the small molecule Quercetin with fibrosis-associated proteins. (I, J) Binding modes of the small molecule Curcumin with COL1A1 and LOXL2.The left panels display the overall three-dimensional structures of the proteins and small molecules in the docking complex, where proteins are shown as molecular surfaces and small molecules are shown in stick representation. The right panels magnify the docking sites, showing the specific interactions between the proteins and small molecules (e.g., hydrogen bonding and hydrophobic interactions). Color scheme: green for β-sheets, orange for α-helices, and purple for random coils. Magenta boxes highlight the small molecules, and dashed lines represent hydrogen bonds or other interactions. The binding energy (in kcal/mol) indicates docking stability, with lower values representing higher stability.
Figure 12
Figure 12
Molecular docking analysis of small molecules with target proteins. (A, B) Binding modes of the small molecule Curcumin with VWF and MZB1. (C–F) Binding modes of the small molecule Resveratrol with target proteins. (G–J) Binding modes of the small molecule Budesonide with target proteins. The left panels show the overall docking sites, while the right panels zoom in on the interaction details. Color scheme: green for β-sheets, orange for α-helices, and purple for random coils. Magenta boxes indicate small molecules, and dashed lines represent hydrogen bonds or other interactions. Binding energy (kcal/mol) reflects docking stability, with lower values indicating stronger binding.

References

    1. Du L, Ha C. Epidemiology and pathogenesis of ulcerative colitis. Gastroenterol Clin North Am. (2020) 49:643–54. doi: 10.1016/j.gtc.2020.07.005 - DOI - PubMed
    1. Naseer M, Poola S, Ali S, Samiullah S, Tahan V. Prebiotics and Probiotics in Inflammatory Bowel Disease: Where are we now and where are we going? Curr Clin Pharmacol. (2020) 15:216–33. doi: 10.2174/1574884715666200312100237 - DOI - PubMed
    1. Yu W, Cheng H, Zhu B, Yan J. Network pharmacology-based validation of the efficacy of Huiyangjiuji decoction in the treatment of experimental colitis. Front Pharmacol. (2021) 12:666432. doi: 10.3389/fphar.2021.666432 - DOI - PMC - PubMed
    1. Pan Z, Lin H, Fu Y, Zeng F, Gu F, Niu G, et al. Identification of gene signatures associated with ulcerative colitis and the association with immune infiltrates in colon cancer. Front Immunol. (2023) 14:1086898. doi: 10.3389/fimmu.2023.1086898 - DOI - PMC - PubMed
    1. Oakes SA, Papa FR. The role of endoplasmic reticulum stress in human pathology. Annu Rev Pathol. (2015) 10:173–94. doi: 10.1146/annurev-pathol-012513-104649 - DOI - PMC - PubMed

MeSH terms

LinkOut - more resources