. 2025 Jun 18:16:1537876.
doi: 10.3389/fimmu.2025.1537876. eCollection 2025.

A genome-wide shRNA screen uncovers a novel potential ligand for NK cell activating receptors

Affiliations

A genome-wide shRNA screen uncovers a novel potential ligand for NK cell activating receptors

Paolo Romania et al. Front Immunol. .

Abstract

Introduction: Natural Killer (NK) cells play a key role in both innate and adaptive immune responses against viruses and tumor cells. Their function relies on the dynamic balance between activating and inhibitory signals, which are mediated by receptors that bind ligands expressed on target cells. While much is known about the function and expression patterns of NK cell activating receptors (NKARs), many of their ligands remain unidentified.

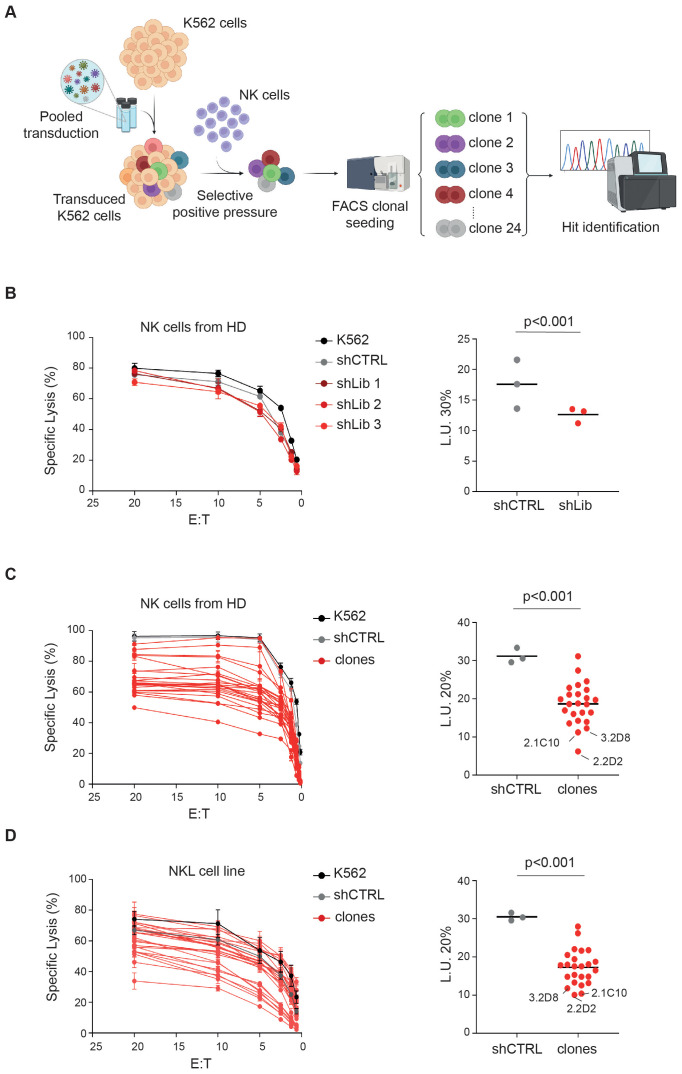
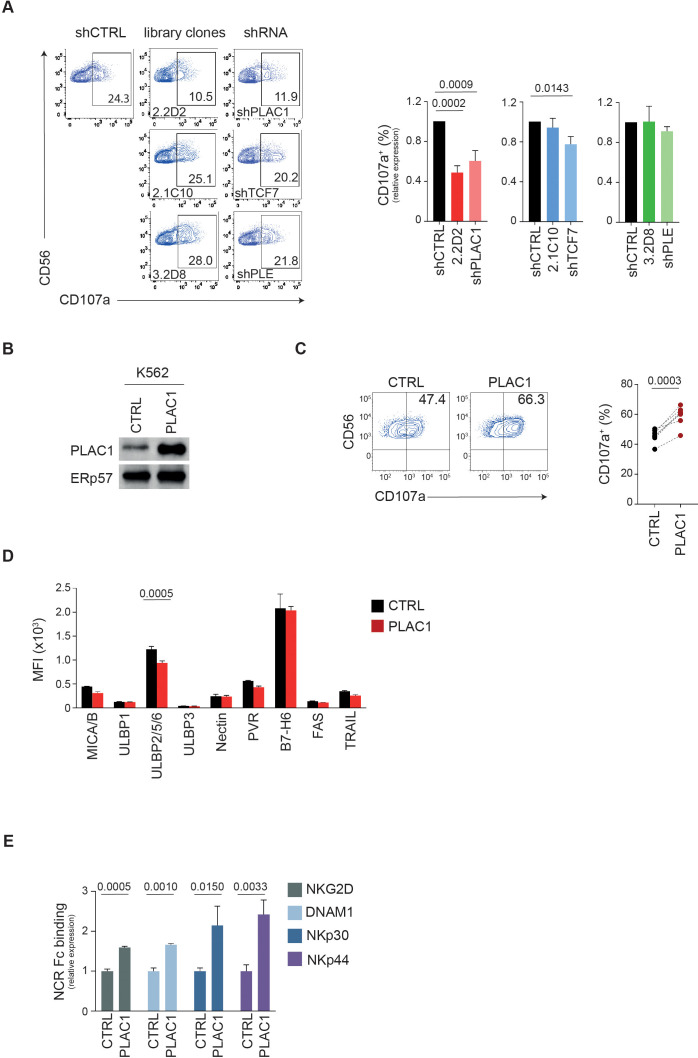
Methods: K562 cells were transduced with a shRNA library targeting 15,000 genes and co-cultured with NK cells from healthy donors. Surviving clones were tested in cytotoxicity and degranulation assays. PLAC1 was cloned from JEG3 cells in a lentiviral vector and transfected in K562 cells. PLAC1-related gene expression and survival data were obtained from the TCGA database and analyzed using R. PLAC1 and DSG2 expression in healthy tissues and NK cells was obtained from the HPA database and a GEO dataset.

Results: We identified ten candidate genes whose downregulation in K562 cells decreased NK cell-mediated cytotoxicity to levels comparable to silencing the MICA gene. The most promising candidates were functionally validated through single-target gene silencing and overexpression. Among them, the placenta-specific 1 (PLAC1) gene stood out, as its inhibition conferred the greatest protection to target cells from NK cell lysis, while overexpression of PLAC1 significantly increased NK cell degranulation. Importantly, PLAC1 was found to interact with NKAR fusion proteins, including NKG2D, DNAM1 NKp44 and NKp30, suggesting its potential involvement in NK cell function. PLAC1 is typically silent in normal tissues, with the exception of placental trophoblasts and testicular germ cells, but is markedly overexpressed in a wide range of tumors. Notably, its prognostic significance appears to be tumor-type specific, associating with either favorable or poor outcomes depending on the cancer context.

Discussion: Our study identifies PLAC1 as a novel potential ligand for NKARs, suggesting it could be a valuable target for pharmacological strategies aimed at enhancing NK cell recognition. This finding holds promise for improving the efficacy of NK cell-based immunotherapies and advancing their clinical application.

Keywords: NK cell; PLAC1; activating receptors; cancer immunotherapy; genome-wide screening; ligands; prognostic value.


Conflict of interest statement

The authors declare that the research was conducted in the absence of any commercial or financial relationships that could be construed as a potential conflict of interest.

Figures

Figure 1
Figure 1
Genome-wide screening identifies new potential ligands for activating NK cell receptors. (A) Experimental scheme as detailed in the text. (B-D) NK cells derived from HD (B, C) and NKL cell line (D) were tested as effectors at the indicated E:T ratios in a standard 51Cr-release assay using K562 cells infected with the lentiplex shRNA library that survived positive selection with NK cells, either as a polyclonal cell population (B) or as single clones (C, D). Data from a representative of three independent experiments are shown. Specific lysis was converted to L.U. 30% (B) or 20% (C, D). Dots, represent L.U. 30% or 20% of the effector/target pairs tested; horizontal bars indicate average values. P values were calculated by comparing with shCTRL and sh-bulk (B) or clones (C, D) (two-tailed paired Student t test). The scheme in A was created by BioRender.
Figure 2
Figure 2
PLAC1 regulates the activity of NK cells. (A) Representative example of degranulation by human CD3CD56+ NK cells from a HD, measured as CD107a cell-surface expression following stimulation with K562 cells transduced with the indicated library clones or specific shRNAs. The percentage of CD107a+ NK cells is indicated. A representative of three independent experiments is reported. Summary of NK cell degranulation after stimulation with the indicated target cells with 5 HDs is reported on the right (Dunett’s multiple comparisons test). (B) Immunoblotting of PLAC1 expression in K562 cells overexpressing PLAC1. (C) Representative example of degranulation by human CD3CD56+ NK cells from a HD, measured as CD107a cell-surface expression following stimulation with K562 cells overexpressing PLAC1. Summary of NK cell degranulation of 7 donors after stimulation with the indicated cells is reported on the right (two-tailed paired Student t test). (D) Expression of the indicated ligands for NKARs in control and PLAC1-overexpressing K562 cells (Šídák’s multiple comparisons test). (E) Relative intensity in NKAR-Fc protein binding on K562 overexpressing PLAC1 compared with K562-CTRL cells measured by flow cytometric analysis. Means ± SD of three independent experiments are shown (two-tailed unpaired Student t test).
Figure 3
Figure 3
PLAC1 expression has prognostic value in tumors. (A) PLAC1 gene expression in the indicated normal human tissues. (B) The expression status of PLAC1 in 33 cancer types compared to the normal counterpart. (C) Kaplan-Meier curves show the duration of overall survival of the indicated tumor patients according to the PLAC1 gene expression. Statistically significant P values are indicated. * p<0.05, ** p<0.01, *** p<0.001, **** p<0.0001.
Figure 4
Figure 4
PLAC1 correlates with the expression of NK-cell signature genes in cancer. Heatmap showing the differential expression of NK cell marker genes in the indicated tumor types. The color scale is based on z-score-scaled gene expression. The z-score distribution ranges from −2 (blue) to 2 (red). Statistically significant P values are indicated; * p<0.05, ** p<0.01.

References

    1. Quatrini L, Della Chiesa M, Sivori S, Mingari MC, Pende D, Moretta L. Human NK cells, their receptors and function. Eur J Immunol. (2021) 51:1566–79. doi: 10.1002/eji.202049028 - DOI - PMC - PubMed
    1. Lanier LL. Up on the tightrope: natural killer cell activation and inhibition. Nat Immunol. (2008) 9:495–502. doi: 10.1038/ni1581 - DOI - PMC - PubMed
    1. Biassoni R, Cantoni C, Pende D, Sivori S, Parolini S, Vitale M, et al. Human natural killer cell receptors and co-receptors. Immunol Rev. (2001) 181:203–14. doi: 10.1034/j.1600-065X.2001.1810117.x - DOI - PubMed
    1. Lanier LL. NK cell receptors. Annu Rev Immunol. (1998) 16:359–93. doi: 10.1146/annurev.immunol.16.1.359 - DOI - PubMed
    1. Zingoni A, Molfetta R, Fionda C, Soriani A, Paolini R, Cippitelli M, et al. NKG2D and its ligands: “One for all, all for one. Front Immunol. (2018) 9:476. doi: 10.3389/fimmu.2018.00476 - DOI - PMC - PubMed

LinkOut - more resources