. 2025 Jun 18:16:1570871.
doi: 10.3389/fimmu.2025.1570871. eCollection 2025.

In evolution's unending race: ancestral STING sensors in Salmo salar mediate intracellular bacterial detection and programmed cell death through evolutionarily conserved pathways

Affiliations

In evolution's unending race: ancestral STING sensors in Salmo salar mediate intracellular bacterial detection and programmed cell death through evolutionarily conserved pathways

Alejandro J Yañez et al. Front Immunol. .

Abstract

Introduction: "In evolution's unending race, survival demands continuous adaptation- to stop is to fall behind." The Stimulator of Interferon Genes (STING) pathway embodies this principle, acting as a conserved master regulator of cytosolic DNA sensing from Drosophila to salmon and humans. Although extensively characterized in mammals, its structural features and regulatory roles during intracellular bacterial infection in teleosts remain poorly defined.

Methods: We structurally characterized the ancestral STING ortholog from Atlantic salmon (Salmo salar) using AlphaFold-guided modeling to identify conserved motifs, including the cyclic dinucleotide (CDN)-binding cleft and phosphorylation regulatory sites. Molecular docking simulations were performed to evaluate the interaction of a validated human STING agonist with salmonid STING. Transcriptomic analyses were conducted in immune tissues and SHK-1 macrophage-like cells infected with Piscirickettsia salmonis to assess gene expression dynamics.

Results: Our models confirmed evolutionary conservation of key STING structural domains. Docking revealed a strong binding affinity between the human agonist and salmonid STING, supporting translational potential. Transcriptomics showed high sting1 expression in immune tissues, rapidly upregulated after infection. In SHK-1 cells, STING1, IFN-α, TNF-α, and IL-1β peaked at 4 hours post-infection (hpi), but this inflammatory burst collapsed by 5 days post-infection (dpi), despite persistent sting1 transcription, indicating functional uncoupling due to immune evasion. In vivo, prolonged DDX41-STING activation was associated with reduced pyroptosis, necroptosis, and inflammatory signaling, reflecting bacterial suppression mechanisms.

Discussion: This study positions S. salar as a high-resolution model for STING biology and introduces the Evolutionary Molecular Immunity Race (EMIR) framework, where STING orchestrates immune fate across hundreds of millions of years of vertebrate evolution, and over the last ~80 million years within the salmonid lineage.

Keywords: Atlantic salmon-pathogen interaction; STING gene; dynamics activation gene expression; evolutionary perspectives; innate immune response; structural functions.


Conflict of interest statement

The authors PB, MM, YY, and AO were employed by ADL Diagnostic Chile. The authors AY and FA were employed by Greenvolution Spa. Author AY was also employed by KeyBio Solution. The remaining authors declare that the research was conducted in the absence of any commercial or financial relationships that could be construed as a potential conflict of interest.

Figures
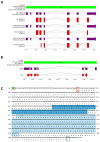
Figure 1
Figure 1
Comparative genomic organization of the sting1 gene in H. sapiens and S. salar. (A) Genomic structure of the H. sapiens sting1 locus on chromosome 5 (GRCh38.p14; NC_000005.10), displaying three transcript variants and corresponding isoforms. Exon-intron structures and alternative transcriptional start sites are shown. (B) Genomic and transcript structure of sting1 in S. salar (Ssal_v3.1; NC_059450.1), illustrating conservation and divergence relative to the human ortholog. (C) Nucleotide and amino acid sequence of S. salar sting1, highlighting the TATA box (green), transmembrane (STING-TM, blue) and C-terminal signaling domains (STING-C, light blue), start codon (red box), and stop codon (black box). Colored annotations facilitate identification of functionally relevant regions across the sequence.
Figure 2
Figure 2
Phylogenetic analysis of sting1 mRNA sequences across vertebrate lineages. unrooted phylogenetic tree reconstructed using maximum likelihood (10,000 bootstrap replicates), based on sting1 mRNA sequences from 39 vertebrate species. Taxonomic groups are color-coded: fish (blue), birds (purple), reptiles (green), mammals (red), and amphibians (yellow). Drosophila melanogaster was used as an outgroup. Bootstrap values indicate statistical support for branching. Red stars mark the positions of H. sapiens and S. salar, highlighting evolutionary proximity within their respective clades.
Figure 3
Figure 3
Comparative domain architecture and sequence conservation of STING1 across species. (A) Domain schematics showing the conserved transmembrane (STING-TM, blue) and C-terminal signaling (STING-C, light blue) domains across selected species. (B) Multiple sequence alignment of the STING-TM domain, with conservation intensity depicted (blue shading). (C) Alignment of the STING-C domain, with conservation (yellow shading) and occupancy graphs indicating sequence robustness. (D) Similarity percentage matrix comparing transmembrane and C-terminal domains across species, emphasizing evolutionary conservation and divergence patterns.
Figure 4
Figure 4
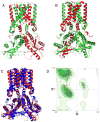
Structural alignment and quality assessment of the predicted Ssa.STING1 model. (A, B) Structural superposition of the predicted S. salar STING1 (green) and the crystallographic H. sapiens STING (red), highlighting overall architecture conservation. (C) Focused comparison of binding pocket regions between the two models. (D) Ramachandran plot analysis of Ssa.STING1 validating stereochemical quality, with a high percentage of residues in favored conformational spaces.
Figure 5
Figure 5
Molecular docking of HB3089 with STING proteins. (A) Front view of the molecular docking between the HB3089 agonist (yellow sticks) and the crystallographic structure of H. sapiens STING (red), highlighting the ligand’s placement in the native binding pocket. (B) Molecular docking results of the same HB3089 ligand against the S. salar STING1 model (green), obtained using AlphaFold 3, illustrating the ligand bound in an analogous region. The comparison between both docking setups shows that, while the ligand occupies a similar spatial location, differences in binding affinity values (-10.2 kcal/mol for H. sapiens vs. -6.6 kcal/mol for S. salar) suggest evolutionary variations in the binding pocket that may influence the stability and recognition of the agonist.
Figure 6
Figure 6
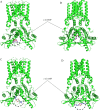
Molecular docking of c-di-GMP and c-di-AMP with STING proteins. (A) Frontal view of the molecular docking between c-di-GMP and the crystallographic structure of H sapiens STING (green), showing the ligand positioned in the native binding pocket. (B) Molecular docking of the same c-di-GMP ligand with the S. salar STING1 model (green), obtained using AlphaFold 3, highlighting the ligand’s location in the analogous binding region. These results illustrate the conservation of the binding site between both species, as well as differences in ligand affinity. (C) Frontal view of the molecular docking between c-di-AMP and the crystallographic structure of H. sapiens STING (green), demonstrating the ligand’s placement in the native binding pocket. (D) Molecular docking of the same c-di-AMP ligand with the S. salar STING1 model (green), obtained using AlphaFold 3, highlighting the ligand’s position in the analogous binding site. These representations illustrate the similarity in ligand location between both species.
Figure 7
Figure 7
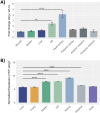
Sting gene expression in different healthy tissues of S. salar assessed by (A) RT-qPCR and (B) RNA-seq. The RT-qPCR expression data were normalized to elongation factor-1α (elf-1α) levels, with the spleen serving as the control tissue. The RNA-seq of control condition of S. salar, retrieved from public databases using the SRA Toolkit. Sample data in triplicate for each tissue, normalized data by VST. Statistical with One-way ANOVA, and post-hoc with Tukey pairwise comparison. Values are presented as mean ± SE, with statistical significance indicated by asterisks: (**) p < 0.01; (****) p < 0.0001.
Figure 8
Figure 8
Kinetics of gene expression in the Ssa.sting1 from 0 (control) to 24 hpi in SHK-1 cells infected with P. salmonis. Gene expression levels were normalized to elongation factor-1α (elf-1a) using qRT-PCR. Data are presented as mean ± SE, with statistical significance indicated by asterisks: (*) p < 0.05; (**) p < 0.01; (***) p < 0.001 compared to control (non-infected SHK-1 cells).
Figure 9
Figure 9
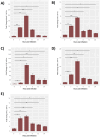
Gene expression kinetics of the innate immune response from 0 (control) to 24 hpi in SHK-1 cells Infected with P. salmonis. Gene expression levels of (A) ddx41, (B) irf3, (C) il-1β, (D) tnf-α and (E) ifn-γ were assessed via RT-qPCR. Expression was normalized to elongation factor-1α (elf-1α) using qRT-PCR. Data are presented as mean ± SE, with statistical significance indicated by asterisks: (*) p < 0.05; (**) p < 0.01; (***) p < 0.001 compared to control (non-infected SHK-1 cells).
Figure 10
Figure 10
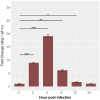
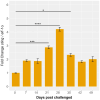
Ssa.sting1 expression during cohabitant challenge of S. salar with P. salmonis. The cohabiting (naive) group exhibited mortalities beginning at 28 days post-infection (dpi), reaching 70% by 49 dpi. Gene expression levels of sting were normalized to elf-1α levels. Values are presented as mean ± SE, with statistical significance indicated by asterisks: (*) p < 0.05; (***) p < 0.001; (****) p < 0.0001 compared to the uninfected S. salar control.
Figure 11
Figure 11
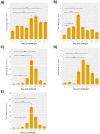
Evaluation of the innate response during cohabitant challenge of S. salar with P. salmonis. The cohabiting (naive) group exhibited mortalities beginning at 28 days post-challenge (dpc), reaching 70% by 49 dpc. Gene expression levels of (A) ddx41, (B) irf3, (C) ifnγ, (D) il-1β and (E) tnf-α were normalized to elongation factor-1α (elf-1a) levels. Results are presented as mean ± SE, with statistical significance indicated by asterisks: (*) p < 0.05; (**) p < 0.01; (***) p < 0.001; (****) p < 0.0001 compared to the uninfected S. salar control.
Figure 12
Figure 12
The EMIR model conceptualizes STING as an evolutionary immune decision node governed by context and coevolution. Upon activation by cytosolic DNA or cyclic dinucleotides, STING translocates from the endoplasmic reticulum to the Golgi, where it recruits and activates TBK1, which in turn phosphorylates IRF3 to drive type I interferon production and cytokine release. Simultaneously, STING may engage regulated cell death pathways—including apoptosis, necroptosis, pyroptosis, and PANoptosis—when immune equilibrium fails. EMIR (Evolutionary Molecular Immunity Race) redefines STING as a dynamic integrator of immune signaling and cellular fate, shaped by 400 million years of host–pathogen arms races.

Similar articles

References

    1. Zhu LY, Nie L, Zhu G, Xiang LX, Shao JZ. Advances in research of fish immune-relevant genes: a comparative overview of innate and adaptive immunity in teleosts. Dev Comp Immunol. (2013) . 39:39–62. doi: 10.1016/j.dci.2012.04.001 - DOI - PubMed
    1. Takeuchi O, Akira S. Pattern recognition receptors and inflammation. Cell. (2010) 140:805–20. doi: 10.1016/j.cell.2010.01.022 - DOI - PubMed
    1. Marinho FV, Benmerzoug S, Oliveira SC, Ryffel B, Quesniaux VFJ. The emerging roles of STING in bacterial infections. Trends Microbiol. (2017) 25:906–18. doi: 10.1016/j.tim.2017.05.008 - DOI - PMC - PubMed
    1. Kawai T, Akira S. The role of pattern-recognition receptors in innate immunity: update on Toll-like receptors. Nat Immunol. (2010) 11:373–84. doi: 10.1038/ni.1863 - DOI - PubMed
    1. Chen Q, Sun L, Chen Z. Regulation and function of the cGAS–STING pathway of cytosolic DNA sensing. Nat Immunol. (2016) 17:1142–9. doi: 10.1038/ni.3558 - DOI - PubMed

LinkOut - more resources