

Identification and validation of a KRAS-macrophage-associated gene signature as prognostic biomarkers and potential therapeutic targets in melanoma
- PMID: 40607411
- PMCID: PMC12213886
- DOI: 10.3389/fimmu.2025.1566432
Identification and validation of a KRAS-macrophage-associated gene signature as prognostic biomarkers and potential therapeutic targets in melanoma
Abstract
Introduction: Skin cutaneous melanoma (SKCM) is a highly aggressive form of cancer with poor prognosis, characterized by significant molecular and immune heterogeneity. The activation of KRAS signaling pathways is implicated in melanoma progression, yet its role in shaping the tumor microenvironment, particularly in macrophage infiltration, remains poorly understood.
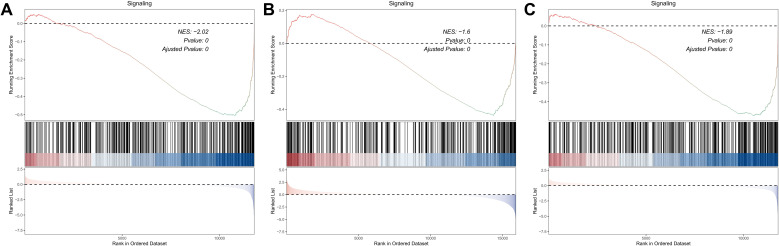
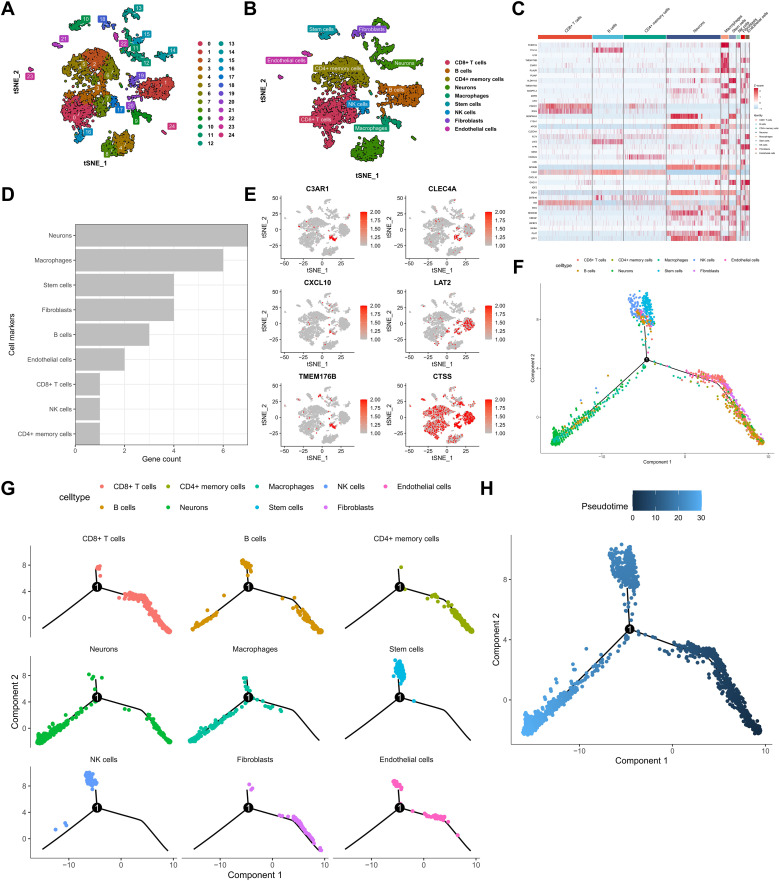
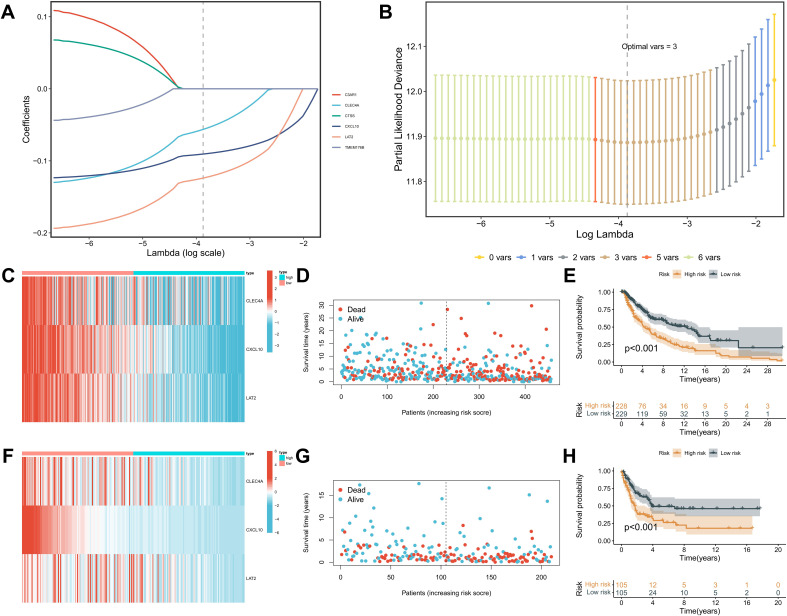
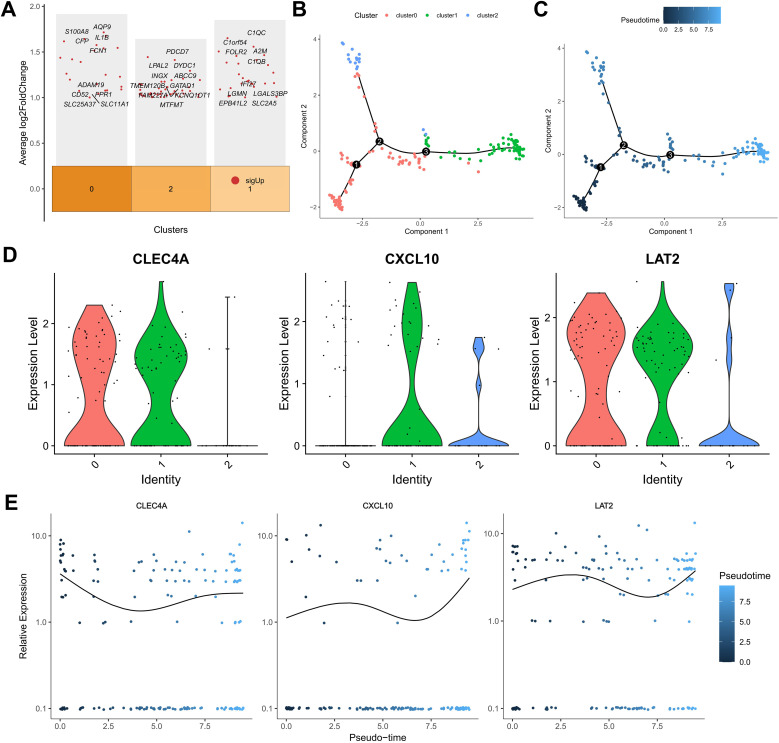
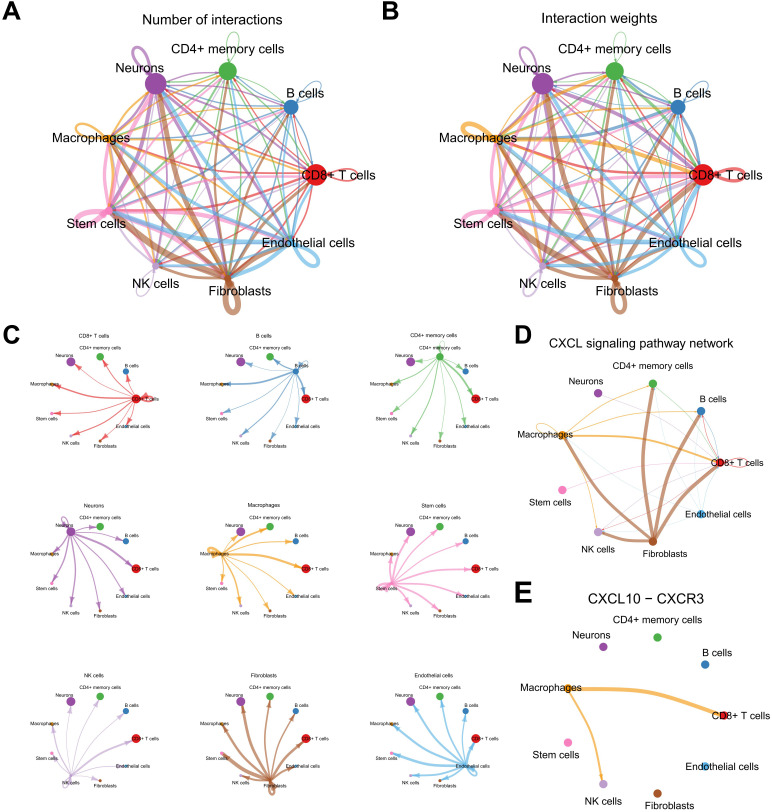
Methods: A comprehensive multi-platform approach was employed, analyzing gene expression data from the Gene Expression Omnibus (GEO) and The Cancer Genome Atlas (TCGA) databases. Gene set enrichment analysis (GSEA) was utilized to characterize the molecular pathways associated with KRAS signaling. Single-cell RNA sequencing (scRNA-seq) was leveraged to investigate the cellular heterogeneity within the SKCM tumor microenvironment, and macrophage populations were categorized using the Monocle2 algorithm. A KRAS-Macrophage Prognostic Associated Gene (KMPAG) signature was developed by integrating these findings, followed by validation using a least absolute shrinkage and selection operator (LASSO) regression model. The prognostic value of the KMPAG signature was assessed through its correlation with clinical outcomes, immune cell infiltration patterns, response to therapy, drug sensitivity, and miRNA-gene regulatory interactions. Cell-cell communication within the SKCM microenvironment was explored using the "CellChat" tool. Experimental validation of gene expression was performed via immunohistochemistry (IHC) and functional assays in gene-modified melanoma cell lines.
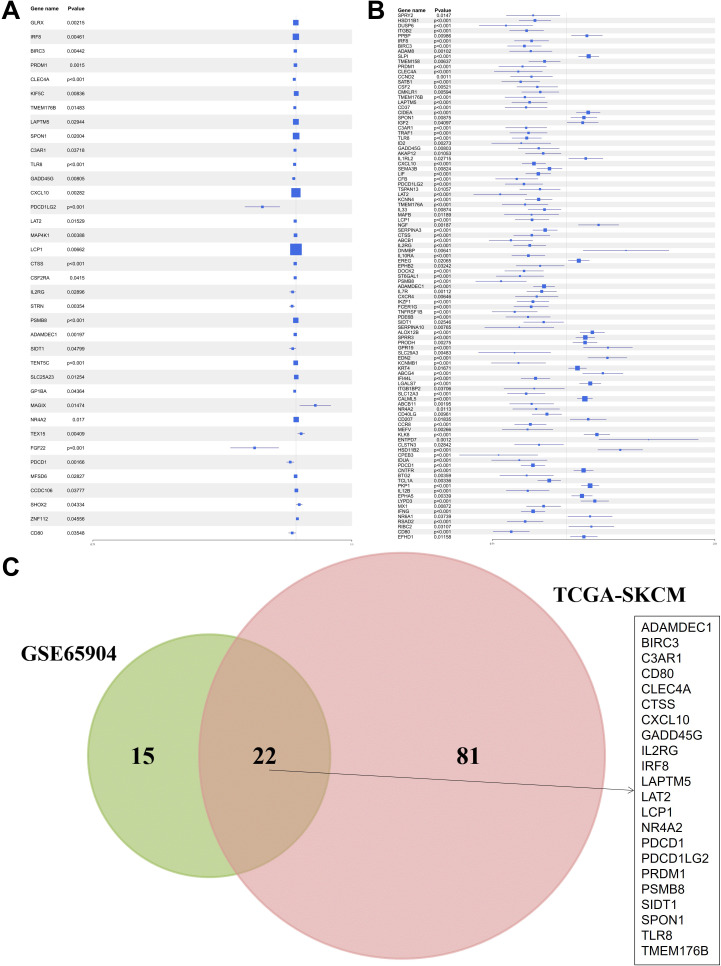
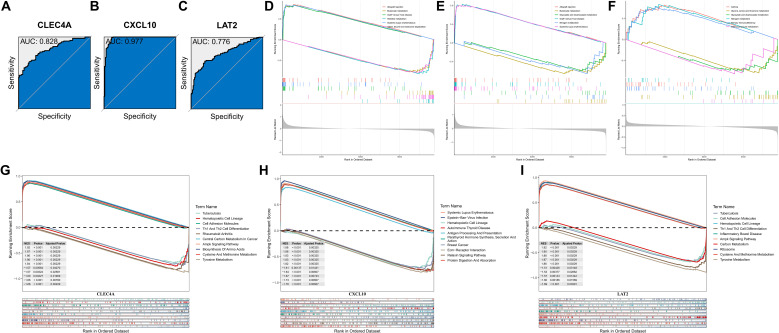
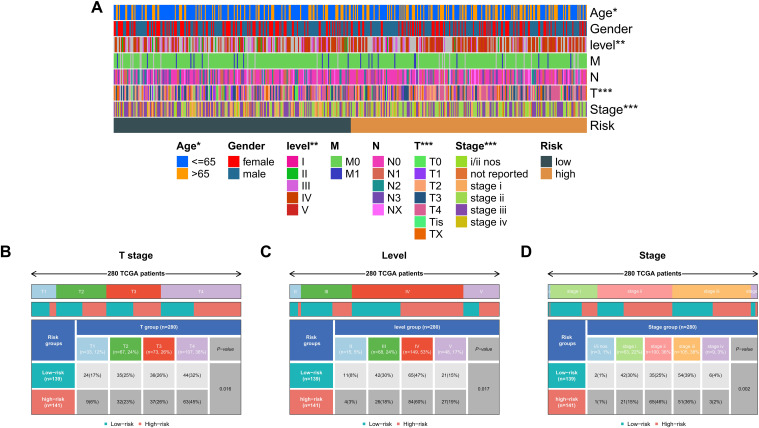
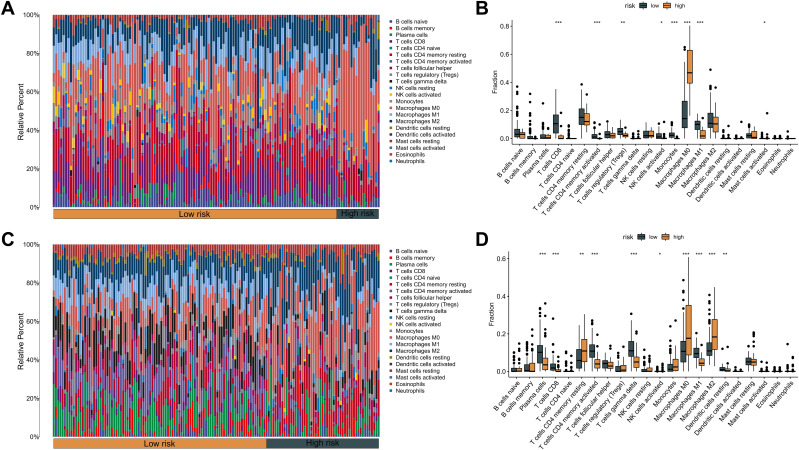
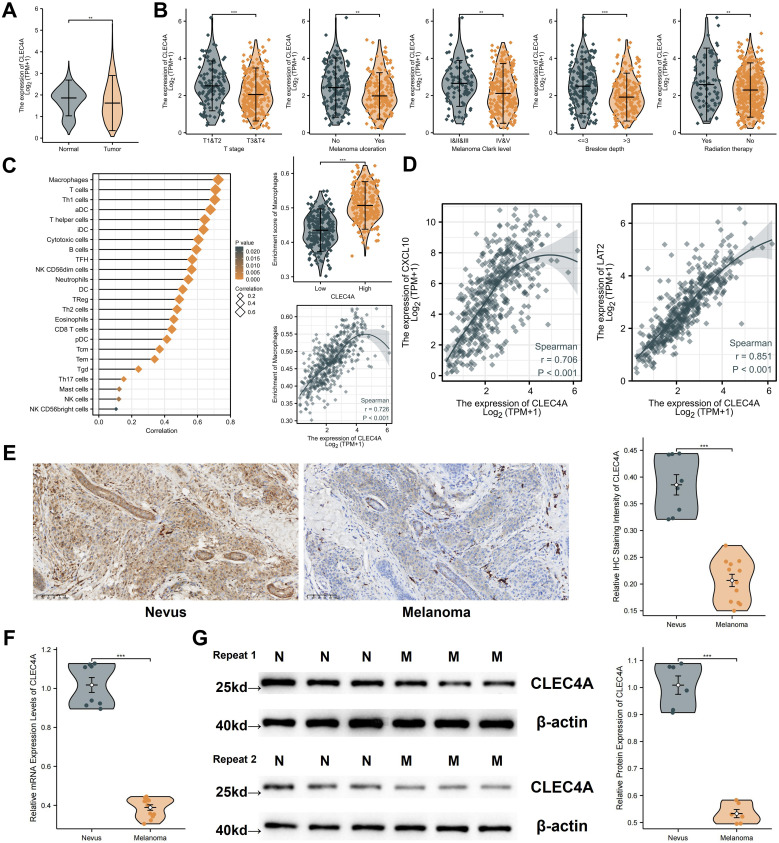
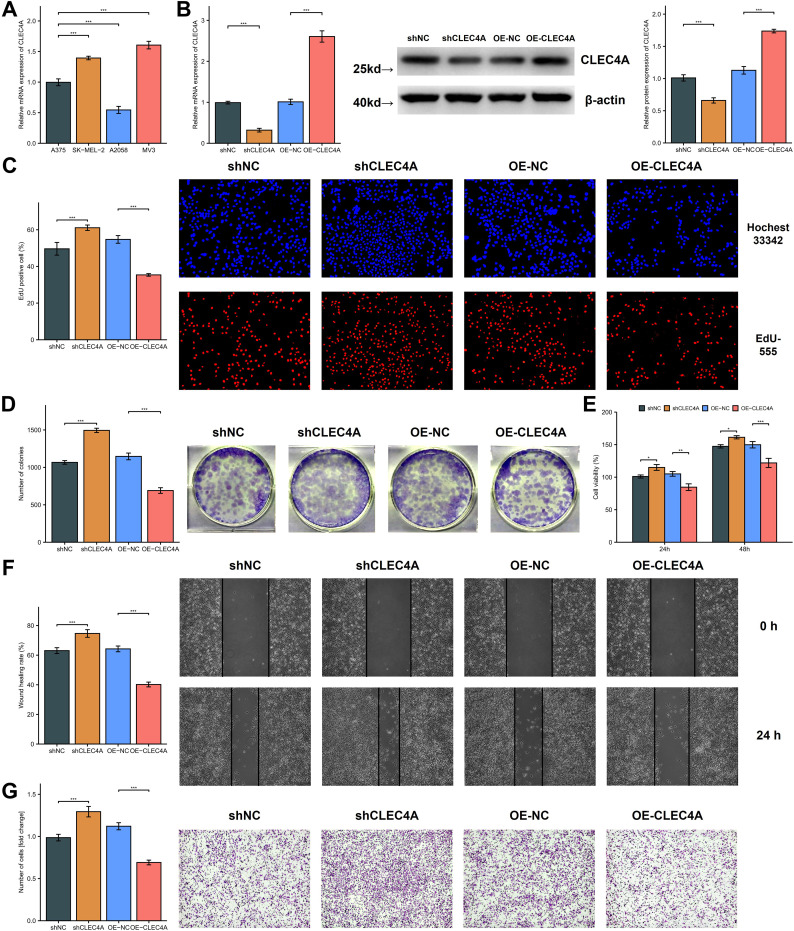
Results: Twenty-two genes involved in KRAS signaling were identified as critical for patient survival. Single-cell analysis revealed nine distinct cell populations within the SKCM microenvironment, leading to the construction of the KMPAG risk model, which incorporated three key genes-CLEC4A, CXCL10, and LAT2. This signature effectively reclassified macrophage subsets, offering improved diagnostic and prognostic capabilities. Furthermore, the KMPAG signature correlated with a range of clinical parameters, including immune infiltration levels, tumor stage, and therapy response. The model also provided insights into the immune landscape of SKCM, facilitating the prediction of responses to immunotherapy. Functional assays demonstrated that downregulation of CLEC4A significantly promoted melanoma cell proliferation, migration, and invasion.
Conclusion: This study highlights the importance of KRAS signaling and macrophage infiltration in melanoma prognosis. The KMPAG gene signature presents a novel prognostic tool, offering insights into personalized treatment strategies and predictive biomarkers for immunotherapy in SKCM. Further exploration of CLEC4A's role in melanoma progression may provide new therapeutic avenues for targeted intervention.
Keywords: KRAS signaling; immune microenvironment; macrophage infiltration; melanoma; prognostic biomarker; single-cell RNA sequencing.
Copyright © 2025 Cai, Lin, Ke, Yu, Chen, Ni, Liu, Shan and Wang.
Conflict of interest statement
The authors declare that the research was conducted in the absence of any commercial or financial relationships that could be construed as a potential conflict of interest.
Figures
Similar articles
-
Construction and validation of a lipid metabolism-related genes prognostic signature for skin cutaneous melanoma.Biochem Biophys Res Commun. 2025 Aug 15;775:152115. doi: 10.1016/j.bbrc.2025.152115. Epub 2025 May 29. Biochem Biophys Res Commun. 2025. PMID: 40460484
-
Integrative lactylation and tumor microenvironment signature as prognostic and therapeutic biomarkers in skin cutaneous melanoma.J Cancer Res Clin Oncol. 2023 Dec;149(20):17897-17919. doi: 10.1007/s00432-023-05483-7. Epub 2023 Nov 13. J Cancer Res Clin Oncol. 2023. PMID: 37955686 Free PMC article.
-
Combined signature of G protein-coupled receptors and tumor microenvironment provides a prognostic and therapeutic biomarker for skin cutaneous melanoma.J Cancer Res Clin Oncol. 2023 Dec;149(20):18135-18160. doi: 10.1007/s00432-023-05486-4. Epub 2023 Nov 25. J Cancer Res Clin Oncol. 2023. PMID: 38006451 Free PMC article.
-
Cost-effectiveness of using prognostic information to select women with breast cancer for adjuvant systemic therapy.Health Technol Assess. 2006 Sep;10(34):iii-iv, ix-xi, 1-204. doi: 10.3310/hta10340. Health Technol Assess. 2006. PMID: 16959170
-
Immunohistochemistry as a reliable method for detection of BRAF-V600E mutation in melanoma: a systematic review and meta-analysis of current published literature.J Surg Res. 2016 Jun 15;203(2):407-15. doi: 10.1016/j.jss.2016.04.029. Epub 2016 Apr 23. J Surg Res. 2016. PMID: 27363650
References
MeSH terms
Substances
LinkOut - more resources
Full Text Sources
Medical
Miscellaneous