. 2025 Jun 18:16:1578444.
doi: 10.3389/fimmu.2025.1578444. eCollection 2025.

Colorectal cancer-infiltrating NK cell landscape analysis unravels tissue-resident PD-1+ NK cells in microsatellite instability tumors

Affiliations

Colorectal cancer-infiltrating NK cell landscape analysis unravels tissue-resident PD-1+ NK cells in microsatellite instability tumors

Valentina Obino et al. Front Immunol. .

Abstract

Background: Natural killer (NK) cells are innate lymphocytes endowed with potent cytotoxic activity. The presence of tumor-associated NK cells has been correlated with better prognosis in several solid tumors including colorectal cancer (CRC). This malignant disease is the second cause of cancer death worldwide and is in urgent need for novel approaches to improve current immunotherapies. Since CRC microenvironment can induce NK cell dysfunction and hinder cancer control, understanding tumor-associated NK cell features is mandatory to fully unlock their immunotherapeutic potential.

Purpose: Our study aims at elucidating the molecular and functional characteristics of tumor-associated NK cells in CRC focusing on the expression of immune checkpoints that critically regulate NK cell function. We performed an in-depth cytofluorimetric analysis of tumor-associated NK cells obtained by tissue dissociation of samples derived from 80 CRC patients comparing tumor with matched tumor-free tissue and peripheral blood, stratifying patients by tumor stage or MSI/MSS condition. Tumor tissue was also analyzed by immunohistochemistry.

Results: NK cells expressing immune checkpoints (i.e., KIR, NKG2A and TIM-3) were significantly enriched in tumor compared to tumor-free tissue, and an increase in PD-1+ NK cells was observed in tumors compared to peripheral blood and tumor-free tissue, indicating TME-induced modulation. Notably, tumor-associated PD-1+ NK cells characterized MSI rather than MSS CRC. In addition, tumor-associated NK cells also expressed tissue residency markers (CD103 and/or CD49a) and displayed a distinct profile also including the PD-1+ NK cell subset in MSI CRC, possibly representing NK cells recruited from circulation, retained in tumors, and reconfigured by TME signals. Importantly, tissue resident NK cells adequately expressed activating NK receptors and cytotoxic molecules.

Conclusions: These results suggest, together with an increased PD-L1 expression on MSI tumor cells, that the efficacy of immunotherapies in MSI CRC based on PD-1/PD-L1 blockade could also rely on a superior anti-tumor potential of PD-1+ NK cells. Conversely, MSS CRC, in which tumor-associated PD-1+ NK cells are scarce, could benefit more from immunotherapies blocking NKG2A and/or KIRs. Thus, novel approaches based on NK cell features related to CRC type, fully exploiting circulating and resident NK cell anti-tumor activity, could be key to next-generation therapies.

Keywords: colorectal cancer; human NK cells; immune checkpoints; microsatellite status; tissue-residency markers.


Conflict of interest statement

The authors declare that the research was conducted in the absence of any commercial or financial relationships that could be construed as a potential conflict of interest. The author(s) declared that they were an editorial board member of Frontiers, at the time of submission. This had no impact on the peer review process and the final decision.

Figures
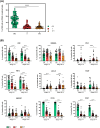
Figure 1
Figure 1
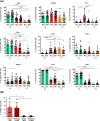
NK cell abundance and heterogeneity in peripheral blood, tumor and tumor-free tissues from CRC patients. (A) The frequency of NK cells among CD45+ lymphoid cells derived from peripheral blood (PB, green circles), tumor (T, red squares), and tumor-free tissue (TFT, orange triangles) of CRC patients is depicted as mean±SD (PB/T n=80, TFT n=58). Statistical significance calculated by Kruskal-Wallis test is indicated. (****p<0.0001). (B) The frequency of peripheral blood (PB, green), tumor (T, red) and tumor-free tissue (TFT, orange) -derived NK cells expressing the indicated surface receptors is shown stratifying CRC patients by tumor stage (I-II and III-IV). Histogram bars represent mean±SD of each surface marker and individual values are indicated by the respective symbols (PB= circles, T=squares, TFT=triangles). Comparisons were performed between different compartments (PB vs T vs TFT) within the same tumor stage through Kruskal-Wallis test followed by Dunn’s test for multiple comparisons, and in the same compartment between stage I-II and III-IV CRC patients by multiple Mann-Whitney test with Holm-Šídák test (stage I-II PB/T n=38, TFT n=20 and stage III-IV PB/T n=30 TFT n=13). Statistical significance calculated by the corresponding test is indicated (*p<0.05; **p<0.01; ***p<0.001; ****p<0.0001).
Figure 2
Figure 2
Tumor-associated PD1+ NK cells enrichment marks MSI CRC patients. (A) The frequency of peripheral blood (PB, green), tumor (T, red) and tumor-free tissue (TFT orange) -derived NK cells expressing the indicated surface receptors is depicted, stratifying CRC patients according to their MMR status, indicated as MSI or MSS (PB/T-MSI n=18; TFT-MSI n=8; PB/T-MSS n=50; TFT-MSS n=25). Histogram bars represent mean±SD of each surface marker and individual values are depicted by the respective symbols (PB=circles, T=squares, TFT=triangles). Expression differences were evaluated by Kruskal-Wallis test followed by Dunn’s test for comparisons between different compartments (PB vs T vs TFT) within the same MMR status group (MSI/MSS) and by multiple Mann-Whitney test with Holm-Šídák test for comparisons between MSI and MSS patients within the same compartment. Statistical significance is indicated (*p<0.05; **p<0.01; ***p<0.001; ****p<0.0001). (B) PD-1 expression on primary tumor-NK cells (light red) with respect to NK cells isolated from metastatic lymph nodes (dark red) of MSI (full and empty circles, n=5) and MSS (full and empty squares, n=3) -CRC patients is shown as mean±SD. Statistical significance computed by Mann-Whitney test is indicated (*p<0.05).
Figure 3
Figure 3
Differential surface signature of tumor-associated trNK cells vs non-trNK cells in MSI vs MSS CRC patients. (A) Frequencies of tissue-resident (trNK, purple) and non-tissue resident NK cells (non-trNK, petroleum blue) within the tumor compartment of each MSI (n=16) and MSS (n=52) CRC patient are reported. Vertical bars represent mean±SD. Statistical significance evaluated by Mann-Whitney test is indicated (*p<0.05). (B) The frequency of tumor-associated trNK (purple) and non-trNK cells (petroleum blue) in MSI and MSS-CRC patients expressing the indicated cell surface markers is shown (trNK MSI n=15, non-trNK MSI n=12, trNK MSS n=34, non-trNK MSS n=34). Histogram bars represent mean±SD of each surface receptor and single values are indicated by the respective symbols (trNK=circles, non-trNK=squares). Data were analyzed by Mann-Whitney test either between trNK and non-trNK cells within the same MMR status group (MSI/MSS) or between MSI and MSS patients within the same NK cell subset (trNK/non-trNK). Statistical significance is indicated (*p<0.05; **p<0.01; ***p<0.001; ****p<0.0001).
Figure 4
Figure 4
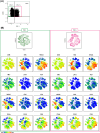
MSI tumor-associated PD-1+ NK cells are tissue resident NK cells co-expressing immune checkpoints. (A) PD-1 expression on tumor-associated NK cells derived from a representative MSI CRC patient is shown indicating the gating strategy to select PD1+ (purple box) and PD-1 (green box) NK cells used for t-SNE analysis. (B) t-SNE was generated from an equal number of PD-1+ and PD-1 tumor-associated NK cells derived from MSI CRC patients (n=3). The relative spatial distribution of PD1+ (purple) and PD-1 (green) NK cells is shown separately in the maps. t-SNE representation of different surface markers on PD-1+ (right) and PD-1 (left) tumor-associated NK cells from MSI CRC patients is depicted below. In both PD-1+ and PD-1 t-SNE maps, the dotted lines identify a fraction of NK cells co-expressing different ICs, NKG2A, KIRs and TIM-3, also characterized by the expression of the tissue residency markers CD49a, CD103 and CD69.
Figure 5
Figure 5
PD-1+/─ tumor-associated trNK cells from MSI/MSS CRC patients express activating receptors and display cytotoxic potential. (A) Surface expression of NK activating receptors (actR) (NKp44, NKp30, NKp46, DNAM-1, NKG2D, CD16) and intracellular expression of granzyme B (Grz B) and perforin (intra) were evaluated in tumor-associated PD-1+ (purple bars, circles) and PD-1 (green bars, squares) trNK cells from MSI CRC patients, in comparison to PD-1 trNK cells from MSS CRC patients (white bars, triangles) (actR MSI n=4, actR MSS n=7, intra MSI n=7, intra MSS n=7). Histogram bars represent mean±SD and single sample values are indicated by the corresponding symbol. No statistical significance was found. (B) A degranulation assay of tumor-associated PD-1+ (purple box) and PD-1 (upper green box) trNK cells from a representative MSI CRC patient and of PD-1 trNK cells (lower green box) from a representative MSS CRC patient is shown. Patients’ NK cells were cultured alone (negative control) or co-cultured with the FcγR+ P815 murine cell line for 3 hours (E:T ratio 1:1), in presence or absence of a mAb targeting CD16 (aCD16) or of a combination of aCD16 and a mAb targeting PD-1 (aPD-1). Percentages of degranulating CD107a+ NK cells are reported in the upper right quadrant for each condition. The CD107a marker was positioned according to the respective isotype control (not shown).
Figure 6
Figure 6
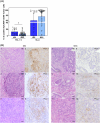
PD-L1/2 and HLA-I expression on tumor cells in MSI vs MSS CRC patients. (A) Surface expression of PDL-1/2 and HLA-I on EpCAM+CD90 tumor cells, derived from CRC patients stratified by MMR status (MSI n=14, blue, circles; MSS n=30, light blue, squares), was investigated by cytofluorimetric analyses. Histogram bars represent mean±SD and single values are depicted. Statistical significance calculated with Mann-Whitney test is indicated (* p<0.05). (B) Tumor tissue sections from six representative CRC patients, stained with anti-PD-L1 by IHC, are depicted. 1–6 show sections from MSI CRC patients, 7–12 show sections from MSS CRC patients (1, 3, 5, 7, 9, 11 panels show HE staining; 2, 4, 6, 8, 10, 12 show anti-PD-L1 IHC staining). Scale bars are 50 µm. Magnification: 20X HE, hematoxylin-eosin staining; IHC, immunohistochemistry.
Figure 7
Figure 7
Strategies to enhance tumor-associated NK cell function against MSI/MSS colorectal cancer. Strategies aimed at reducing the suppressive effect exerted by interactions of immune checkpoints expressed on NK cells with their ligands on tumor cells or at triggering the antitumor potential of NK cells could be combined differently depending on the characteristics of NK cells in different CRC type, to achieve the best immunotherapeutic effect. Based on our observations, the antitumor efficacy of tumor-associated NK cells can be potentiated through: i) IC blockade via anti-NKG2A(Monalizumab), anti-KIRs (Lirilumab) and anti-PD-1/PD-L1 (Nivolumab/Durvalumab) mAbs in MSI CRC; ii) IC blockade via anti-NKG2A (Monalizumab) and anti-KIRs (Lirilumab) mAbs in MSS CRC; iii) ADCC triggering strategies via trifunctional NK cell engagers (TriKE) targeting CD16 and NKp46 on NK cells and a tumor-associated antigen (such as EGFR) on tumor cells, regardless MSI/MSS status. Created in BioRender. Della chiesa, M. (2025) https://BioRender.com/yxsy628.

References

    1. Nersesian S, Schwartz SL, Grantham SR, MacLean LK, Lee SN, Pugh-Toole M, et al. NK cell infiltration is associated with improved overall survival in solid cancers: A systematic review and meta-analysis. Transl Oncol. (2021) 14:100930. doi: 10.1016/j.tranon.2020.100930 - DOI - PMC - PubMed
    1. Pietra G, Vitale C, Pende D, Bertaina A, Moretta F, Falco M, et al. Human natural killer cells: news in the therapy of solid tumors and high-risk leukemias. Cancer Immunol Immunother. (2016) 65:465–76. doi: 10.1007/s00262-015-1744-y - DOI - PMC - PubMed
    1. Freud AG, Mundy-Bosse BL, Yu J, Caligiuri MA. The broad spectrum of human natural killer cell diversity. Immunity. (2017) 47:820–33. doi: 10.1016/j.immuni.2017.10.008 - DOI - PMC - PubMed
    1. Quatrini L, Della Chiesa M, Sivori S, Mingari MC, Pende D, Moretta L. Human NK cells, their receptors and function. Eur J Immunol. (2021) 51:1566–79. doi: 10.1002/eji.202049028 - DOI - PMC - PubMed
    1. Spits H, Bernink JH, Lanier L. NK cells and type 1 innate lymphoid cells: partners in host defense. Nat Immunol. (2016) 17:758–64. doi: 10.1038/ni.3482 - DOI - PubMed

MeSH terms

Substances