

P-glycoprotein expression skews mitochondrial dye measurements in T cells
- PMID: 40607427
- PMCID: PMC12213397
- DOI: 10.3389/fimmu.2025.1560104
P-glycoprotein expression skews mitochondrial dye measurements in T cells
Abstract
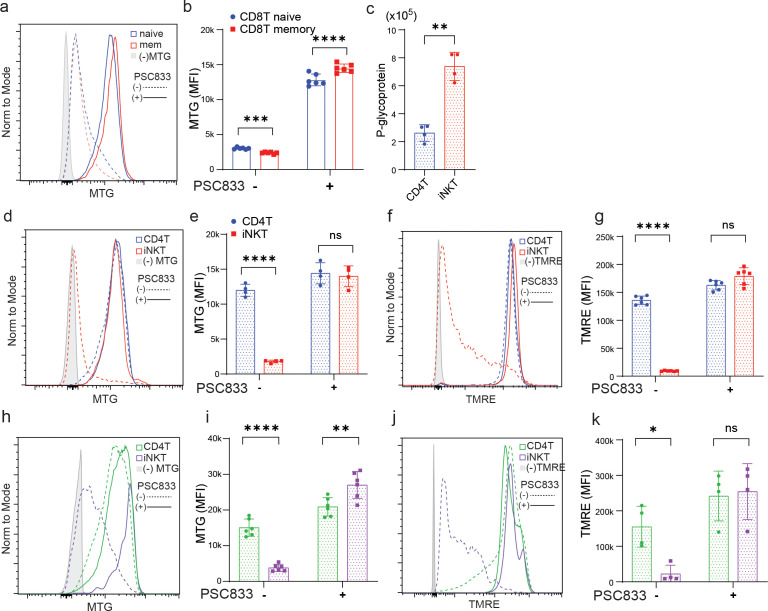
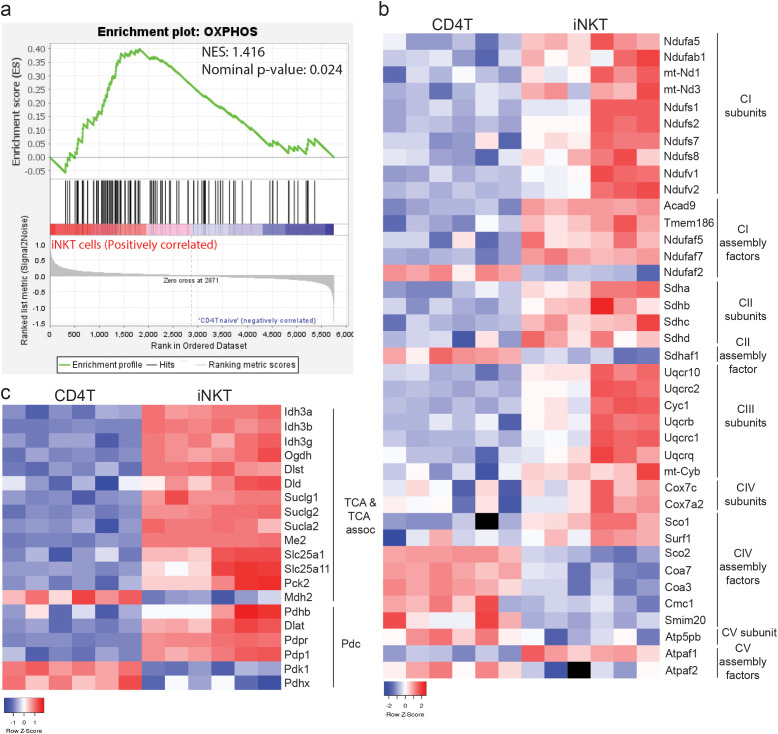
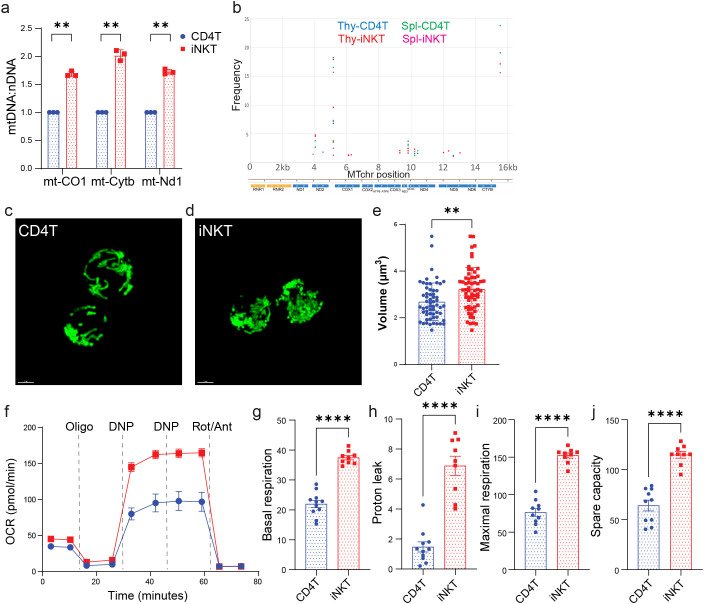
Assays to monitor metabolic parameters of immune cells at a single cell level provide efficient means to study immunometabolism. We show here that staining intensity of mitochondria targeting probes in T cells is dramatically influenced by P-glycoprotein/P-gp expression, a xenobiotic efflux pump that extrudes these fluorescent dyes. Discrepancies between MitoTracker Green FM/MTG signals and multiple dye-independent measurements are seen in CD4 T and CD8 T cell subsets and are corrected by P-gp inhibition (PSC833) during MTG staining. We further investigate invariant Natural Killer T (iNKT) cells, which express the highest level of P-glycoprotein among T cells. Using mtDNA abundance, mitochondrial volume, respiration and proteomics, we establish that iNKT cells have higher mitochondrial content and activity than CD4 T cells, opposite to what MTG signals reveal. A similar phenomenon is also seen in human PBMCs, and with TMRE, a dye indicator of mitochondrial membrane potential. Collectively, these data argue that P-glycoprotein expression is a significant confounding factor when analyzing T cells using mitochondrial specific dyes. Complementary methods are necessary to reliably assess mitochondrial features in T cells.
Keywords: P-glycolprotein; T cells; TMRE; mitochondria; mitotracker; oxidative phosphorilation.
Copyright © 2025 Sok, Cheng, Strucinska, Popescu, Wu, Ke, Kiosses, Stanford, Freeman, Matsuzaki, Lewis and Zhao.
Conflict of interest statement
The authors declare that the research was conducted in the absence of any commercial or financial relationships that could be construed as a potential conflict of interest.
Figures
Similar articles
-
Behavioral interventions to reduce risk for sexual transmission of HIV among men who have sex with men.Cochrane Database Syst Rev. 2008 Jul 16;(3):CD001230. doi: 10.1002/14651858.CD001230.pub2. Cochrane Database Syst Rev. 2008. PMID: 18646068
-
Comparison of Two Modern Survival Prediction Tools, SORG-MLA and METSSS, in Patients With Symptomatic Long-bone Metastases Who Underwent Local Treatment With Surgery Followed by Radiotherapy and With Radiotherapy Alone.Clin Orthop Relat Res. 2024 Dec 1;482(12):2193-2208. doi: 10.1097/CORR.0000000000003185. Epub 2024 Jul 23. Clin Orthop Relat Res. 2024. PMID: 39051924
-
Maternal and neonatal outcomes of elective induction of labor.Evid Rep Technol Assess (Full Rep). 2009 Mar;(176):1-257. Evid Rep Technol Assess (Full Rep). 2009. PMID: 19408970 Free PMC article.
-
The Black Book of Psychotropic Dosing and Monitoring.Psychopharmacol Bull. 2024 Jul 8;54(3):8-59. Psychopharmacol Bull. 2024. PMID: 38993656 Free PMC article. Review.
-
The extra-islet pancreas supports autoimmunity in human type 1 diabetes.Elife. 2025 Apr 15;13:RP100535. doi: 10.7554/eLife.100535. Elife. 2025. PMID: 40232951 Free PMC article.
References
-
- Presley AD, Fuller KM, Arriaga EA. MitoTracker Green labeling of mitochondrial proteins and their subsequent analysis by capillary electrophoresis with laser-induced fluorescence detection. J Chromatogr B Analyt Technol BioMed Life Sci. (2003) 793:141–50. doi: 10.1016/S1570-0232(03)00371-4 - DOI - PubMed
-
- Keij JF, Bell-Prince C, Steinkamp JA. Staining of mitochondrial membranes with 10-nonyl acridine orange, MitoFluor Green, and MitoTracker Green is affected by mitochondrial membrane potential altering drugs. Cytometry. (2000) 39:203–10. doi: 10.1002/(SICI)1097-0320(20000301)39:3<203::AID-CYTO5>3.0.CO;2-Z - DOI - PubMed
-
- Jacobson J, Duchen MR, Heales SJ. Intracellular distribution of the fluorescent dye nonyl acridine orange responds to the mitochondrial membrane potential: implications for assays of cardiolipin and mitochondrial mass. J Neurochem. (2002) 82:224–33. doi: 10.1046/j.1471-4159.2002.00945.x - DOI - PubMed
MeSH terms
Substances
Grants and funding
LinkOut - more resources
Full Text Sources
Research Materials
Miscellaneous