. 2025 Jul 15;19(27):24972-24984.
doi: 10.1021/acsnano.5c04293. Epub 2025 Jul 3.

Chemical Composition and Backbone Modifications Define Deformability of Nucleic Acid Nanoparticles

Affiliations

Chemical Composition and Backbone Modifications Define Deformability of Nucleic Acid Nanoparticles

Laxmi Pandey et al. ACS Nano. .

Abstract

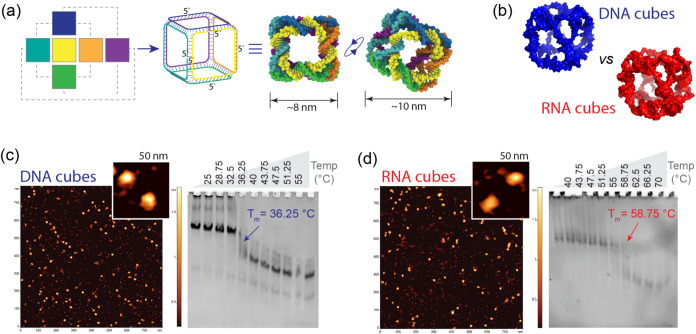
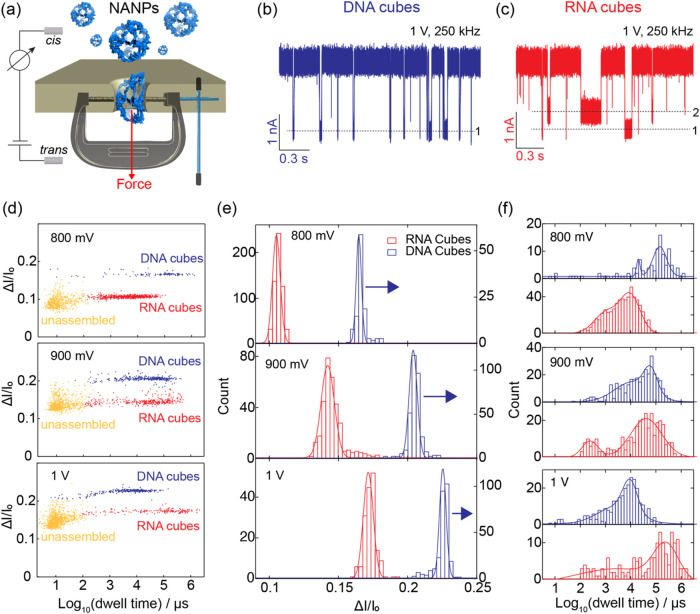
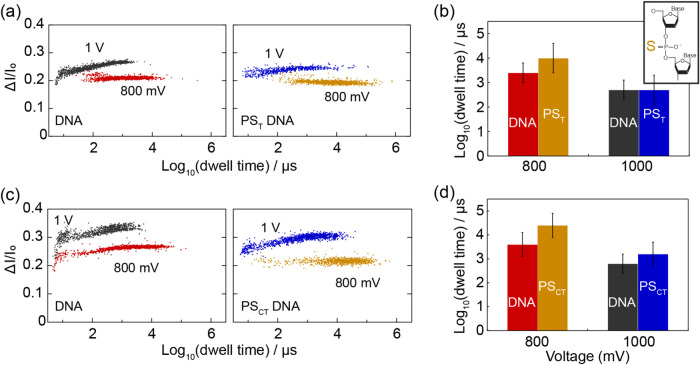
Nucleic acid nanoparticles (NANPs), composed of short oligonucleotides assembled into specific architectures, are emerging as a programmable platform for the regulated drug delivery of various therapeutic agents. Here, we use a nanopore "clamp" to investigate the mechanical properties of six-stranded RNA and DNA-based NANPs with the connectivity of a cube of sizes below 10 nm. When electrophoretically forced through solid-state nanopores that are smaller than the cubes, deformation of the NANPs generates prolonged electrical signatures whose durations depend on the mechanical deformability of the structures. All-atom MD simulations further reveal differences in the mechanical flexibility of DNA, RNA, modified RNA, and hybrid DNA/RNA cubes, supporting these findings at the molecular level. While DNA cubes deform and translocate through the pore, analogous RNA cubes are too stiff and cannot squeeze through at a comparable voltage, despite having the same sequence and overall shape as the DNA cubes. Further, we find that hybrid RNA/DNA cubes exhibit intermediate mechanical deformability to pure DNA or RNA cubes, indicating an additive effect of the RNA content on nanocube stiffness. Finally, different chemical modifications introduced to the strands can be used to fine-tune the mechanical properties of the NANPs.

Keywords: MD simulations; flexibility; nucleic acid nanoparticles; solid-state nanopore; translocation.


Figures

1
1
DNA and RNA cubes formation and corresponding thermal stability. (a) Representative cartoon and 3D model of a DNA cube, with each strand shown in a different color. (b) 3D models of DNA and RNA cubes. (c, d) AFM images and temperature gradient gel image for DNA and RNA cubes used in this study.
2
2
Structural features of DNA and RNA cubes from all-atom MD. Snapshots of the (a) DNA cube, (b) RNA cube, and (c) modified RNA cube at different time intervals during the molecular dynamics (MD) simulation. The black backbone in (c) indicates the presence of a methyl modification in the backbone of uracil and cytosine nucleotides. (d) Root-mean-square deviation (RMSD), (e) radius of gyration, and (f) % of broken base pairs of DNA cube (blue), RNA cube (red), and modified RNA cube (black). The percentage of broken base pairs is smoothed using a moving average over a 0.5 ns window. (g–i) Principal component analysis (PCA) of DNA, RNA, and modified RNA cubes over the 1.9 μs simulation. Arrows superimposed with cube structures (see inset in (g) as an example) along each axis represent the physical representation of the components; in this case, shear along different directions. Only 25% of the arrows are shown for clarity. (j) Schematic representation of the cube faces (viewers angle). The white circles indicate the locations of the 5′ and 3′ ends of the nucleic strands. Since there are six such strands, there are six such locations (one is not shown). (k) Interfacial distance between opposite faces of DNA cube (left), RNA cube (middle), and modified RNA cube (right). (l) Schematic representation of the four measured diagonal distances. (m) Diagonal distance between opposite corners of DNA cube (left), RNA cube (middle), and modified RNA cube (right). The interfacial and diagonal distances are smoothed using a moving average over a 0.5 ns window.
3
3
Comparative analysis of the DNA and RNA cubes with a solid-state nanopore. (a) Schematic of a nanopore experiment in which deformation of NANPs is achieved by an electrophoretic force (red arrow) pulling the nanocubes through a pore constriction, which acts as a clamp to “squeeze” the cube. (b) Current trace for DNA cube at 1 V, (c) current trace of mixture of DNA cubes (200 pM) and RNA cubes (1.4 nM) at 800 mV and 1 V, (d) scatter plot of mixture of cubes at different voltages, where GMM clustering was applied to separate unassembled (yellow markers), RNA cubes (red markers), and DNA cubes (blue markers), (e) histogram of fractional current blockade at different voltage (left axis is for RNA cubes, right axis is for DNA cubes), and (f) histogram of log10(Dwell time (μs)) (shown in red for RNA cubes, and shown in blue for DNA cubes) at different voltage. Fractional current blockade distribution was fitted to Gaussian distribution, whereas the dwell time distribution was fitted to multi-Gaussian distribution (solid lines). Buffer: 0.2 M KCl, 10 mM HEPES, 2 mM MgCl2, pH 7.5. Data was acquired at 4.17 MHz and filtered at 250 kHz. The pore size used in this experiment was ∼9.5 nm.
4
4
Comparison of DNA cubes and hybrid RNA:DNA cubes with a solid-state nanopore. (a) Representative cartoons and current vs time traces for DNA cubes and Hybrid RNA:DNA cubes. (b) Fractional current blockade vs dwell time scatter plots of RNA cubes and DNA cubes. (c) Dwell time distributions for the DNA and hybrid cubes at 1 V applied voltage. The concentration of each cube was 2.1 nM. Buffer: 0.2 M KCl, 10 mM HEPES, 2 mM MgCl2, pH 7.5. Data was acquired at 4.17 MHz and filtered at 250 kHz. The pore size used in this experiment was ∼9.3 nm. (d) MD snapshots of hybrid cube at various intervals during the 1.6 μs simulation. (e) Principal component analysis (PCA) of hybrid cube over the 1.6 μs simulation. Arrows superimposed with cube structures along each axis represent the physical representation of the components, in this case, shear along different directions. Only 25% of the arrows are shown for clarity. (f) (Top to bottom) RMSD, radius of gyration, percentage of broken base pairs, and interfacial and diagonal distances of the hybrid cube. For schematic representation of interfacial and diagonal labels, refer to Figure j, l, respectively.
5
5
Effect of 2′OMe modification on the flexibility of the RNA cube. Comparison of representative current vs time trace at V = 500 mV (a), fractional current blockade vs dwell time scatter plots (b), and dwell time histograms (c) of DNA cubes, 2′OMe RNA cube, and DNA cubes. Pore size used in this experiment was ∼11.3 nm. The concentration of each cube was 4.2 nM. Buffer: 0.2 M KCl, 10 mM HEPES, and 2 mM MgCl2, pH 7.5. Current data was acquired at 4.17 MHz and low-pass filtered at 250 kHz.
6
6
Effect of phosphorothioate modification on the flexibility of the DNA cube. Scatter plots (red representing 800 mV and black representing 1 V for DNA, and orange representing 800 mV and blue representing 1 V for PST DNA) (a) and a box plot (b) for the DNA cube and PST DNA cube at 800 and 1 V, analyzed separately using one pore. The concentration of each cube was 4.2 nM. Scatter plots (red representing 800 mV and black representing 1 V for DNA, and orange representing 800 mV and blue representing 1 V for PSCT DNA) (c) and a box plot (d) for DNA cube and PSCT DNA cube at 800 and 1 V, analyzed separately using a second pore. In (b) and (d), each bar represents the mean, and the error bar represents the standard deviation in the dwell time distribution corresponding to complete assemblies. The concentration of each cube was 2.1 nM. Both pores were smaller in size than the size of hydrodynamic diameter of cubes. Buffer: 0.2 M KCl, 10 mM HEPES, 2 mM MgCl2, pH 7.5. Data was acquired at 4.17 MHz and filtered at 250 kHz.

Similar articles

References

    1. Cherf G. M., Lieberman K. R., Rashid H., Lam C. E., Karplus K., Akeson M.. Automated forward and reverse ratcheting of DNA in a nanopore at 5-Å precision. Nat. Biotechnol. 2012;30(4):344–348. doi: 10.1038/nbt.2147. - DOI - PMC - PubMed
    1. Manrao E. A., Derrington I. M., Laszlo A. H., Langford K. W., Hopper M. K., Gillgren N., Pavlenok M., Niederweis M., Gundlach J. H.. Reading DNA at single-nucleotide resolution with a mutant MspA nanopore and phi29 DNA polymerase. Nat. Biotechnol. 2012;30(4):349–353. doi: 10.1038/nbt.2171. - DOI - PMC - PubMed
    1. Wanunu M., Morrison W., Rabin Y., Grosberg A. Y., Meller A.. Electrostatic focusing of unlabelled DNA into nanoscale pores using a salt gradient. Nat. Nanotechnol. 2010;5(2):160–165. doi: 10.1038/nnano.2009.379. - DOI - PMC - PubMed
    1. Sutherland T. C., Long Y.-T., Stefureac R.-I., Bediako-Amoa I., Kraatz H.-B., Lee J. S.. Structure of Peptides Investigated by Nanopore Analysis. Nano Lett. 2004;4(7):1273–1277. doi: 10.1021/nl049413e. - DOI
    1. Yu L., Kang X., Li F., Mehrafrooz B., Makhamreh A., Fallahi A., Foster J. C., Aksimentiev A., Chen M., Wanunu M.. Unidirectional single-file transport of full-length proteins through a nanopore. Nat. Biotechnol. 2023;41:1130. doi: 10.1038/s41587-022-01598-3. - DOI - PMC - PubMed

LinkOut - more resources