

Flagellum-driven motility enhances Pseudomonas aeruginosa biofilm formation by altering cell orientation
- PMID: 40607807
- PMCID: PMC12285247
- DOI: 10.1128/aem.00821-25
Flagellum-driven motility enhances Pseudomonas aeruginosa biofilm formation by altering cell orientation
Abstract
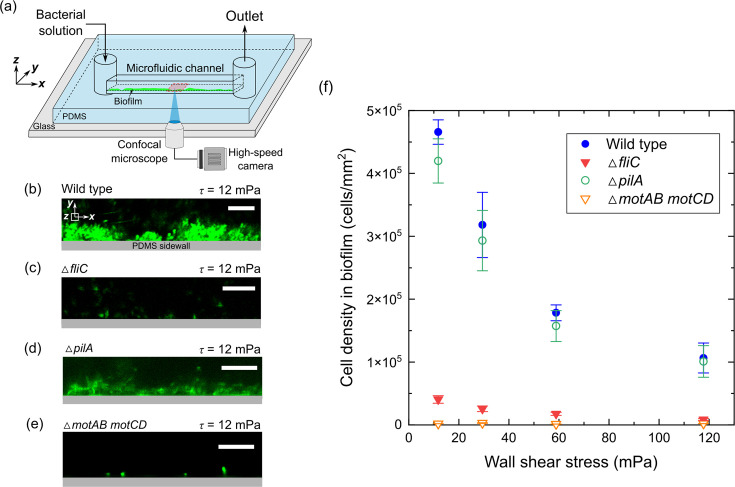
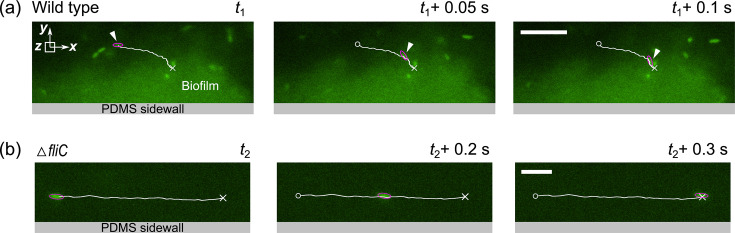
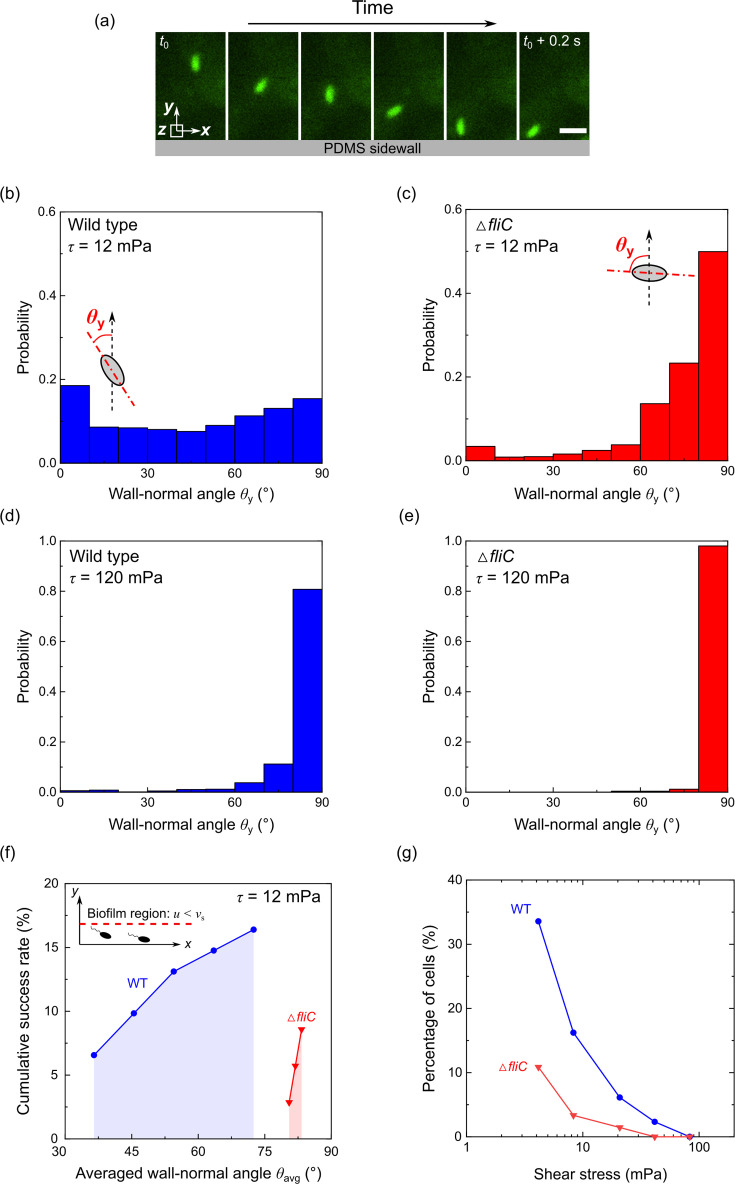
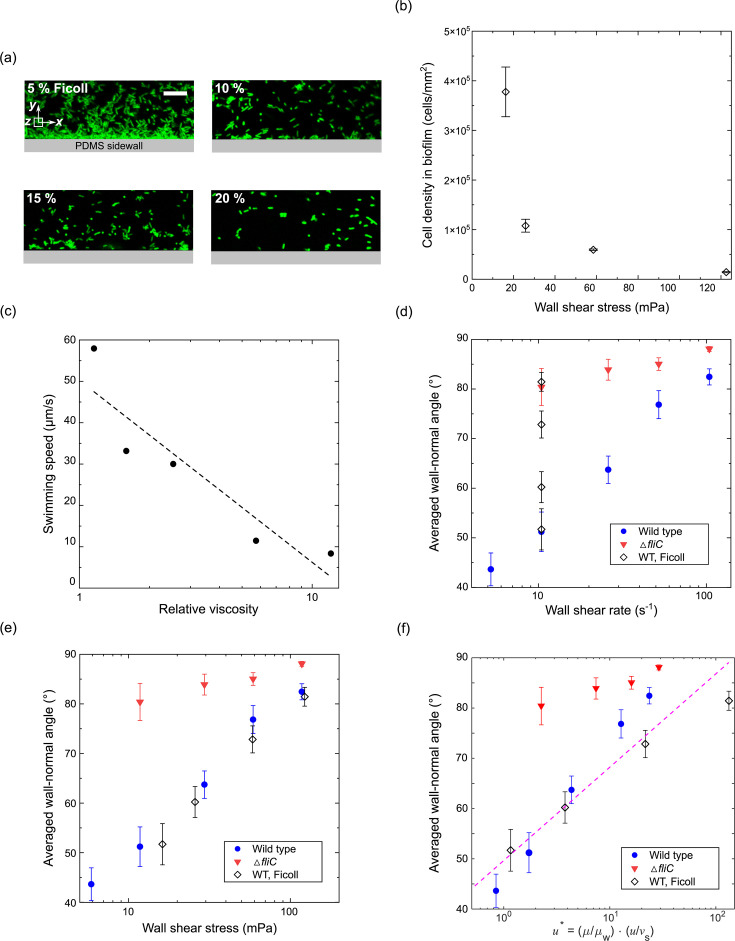
Bacterial motility plays a crucial role in biofilm development, yet the underlying mechanism remains not fully understood. Here, we demonstrate that the flagellum-driven motility of Pseudomonas aeruginosa enhances biofilm formation by altering the orientation of bacterial cells, an effect controlled by shear stress rather than shear rate. By tracking wild-type P. aeruginosa and its non-motile mutants in a microfluidic channel, we demonstrate that while non-motile cells align with the flow, many motile cells can orient toward the channel sidewalls, enhancing cell surface attachment and increasing biofilm cell density by up to 10-fold. Experiments with varying fluid viscosities further demonstrate that bacterial swimming speed decreases with increasing fluid viscosity, and the cell orientation scales with the shear stress rather than shear rate. Our results provide a quantitative framework to predict the role of motility in the orientation and biofilm development under different flow conditions and viscosities.IMPORTANCEBiofilms are ubiquitous in rivers, water pipes, and medical devices, impacting the environment and human health. While bacterial motility plays a crucial role in biofilm development, a mechanistic understanding remains limited, hindering our ability to predict and control biofilms. Here, we reveal how the motility of Pseudomonas aeruginosa, a common pathogen, influences biofilm formation through systematically controlled microfluidic experiments with confocal and high-speed microscopy. We demonstrate that the orientation of bacterial cells is controlled by shear stress. While non-motile cells primarily align with the flow, many motile cells overcome the fluid shear forces and reorient toward the channel sidewalls, increasing biofilm cell density by up to 10-fold. Our findings provide insights into how bacterial transition from free-swimming to surface-attached states under varying flow conditions, emphasizing the role of cell orientation in biofilm establishment. These results enhance our understanding of bacterial behavior in flow environments, informing strategies for biofilm management and control.
Keywords: Pseudomonas aeruginosa; biofilms; cell motility; fluid flow; shear.
Conflict of interest statement
The authors declare no conflict of interest.
Figures
Similar articles
-
Genetic analysis of flagellar-mediated surface sensing by Pseudomonas aeruginosa PA14.J Bacteriol. 2025 Jul 24;207(7):e0052024. doi: 10.1128/jb.00520-24. Epub 2025 Jun 5. J Bacteriol. 2025. PMID: 40470954 Free PMC article.
-
Non-disruptive matrix turnover is a conserved feature of biofilm aggregate growth in paradigm pathogenic species.mBio. 2025 Mar 12;16(3):e0393524. doi: 10.1128/mbio.03935-24. Epub 2025 Feb 21. mBio. 2025. PMID: 39982068 Free PMC article.
-
PrtA-mediated flagellar turnover is essential for robust biofilm development in Serratia marcescens.Appl Environ Microbiol. 2025 Aug 21:e0126125. doi: 10.1128/aem.01261-25. Online ahead of print. Appl Environ Microbiol. 2025. PMID: 40838731
-
Standard versus biofilm antimicrobial susceptibility testing to guide antibiotic therapy in cystic fibrosis.Cochrane Database Syst Rev. 2015 Mar 5;(3):CD009528. doi: 10.1002/14651858.CD009528.pub3. Cochrane Database Syst Rev. 2015. Update in: Cochrane Database Syst Rev. 2017 Oct 05;10:CD009528. doi: 10.1002/14651858.CD009528.pub4. PMID: 25741986 Updated.
-
Standard versus biofilm antimicrobial susceptibility testing to guide antibiotic therapy in cystic fibrosis.Cochrane Database Syst Rev. 2017 Oct 5;10(10):CD009528. doi: 10.1002/14651858.CD009528.pub4. Cochrane Database Syst Rev. 2017. Update in: Cochrane Database Syst Rev. 2020 Jun 10;6:CD009528. doi: 10.1002/14651858.CD009528.pub5. PMID: 28981972 Free PMC article. Updated.
References
-
- de Carvalho C. 2018. Marine biofilms: a successful microbial strategy with economic implications. Front Mar Sci 5:126. doi: 10.3389/fmars.2018.00126 - DOI
-
- Shen Y, Huang C, Monroy GL, Janjaroen D, Derlon N, Lin J, Espinosa-Marzal R, Morgenroth E, Boppart SA, Ashbolt NJ, Liu W-T, Nguyen TH. 2016. Response of simulated drinking water biofilm mechanical and structural properties to long-term disinfectant exposure. Environ Sci Technol 50:1779–1787. doi: 10.1021/acs.est.5b04653 - DOI - PMC - PubMed
MeSH terms
Grants and funding
LinkOut - more resources
Full Text Sources
