. 2025 Jul 22;10(7):e0028825.
doi: 10.1128/msystems.00288-25. Epub 2025 Jul 3.

Weissella cibaria suppresses colitis-associated colorectal cancer by modulating the gut microbiota-bile acid-FXR axis

Affiliations

Weissella cibaria suppresses colitis-associated colorectal cancer by modulating the gut microbiota-bile acid-FXR axis

Qiuyao Hao et al. mSystems. .

Abstract

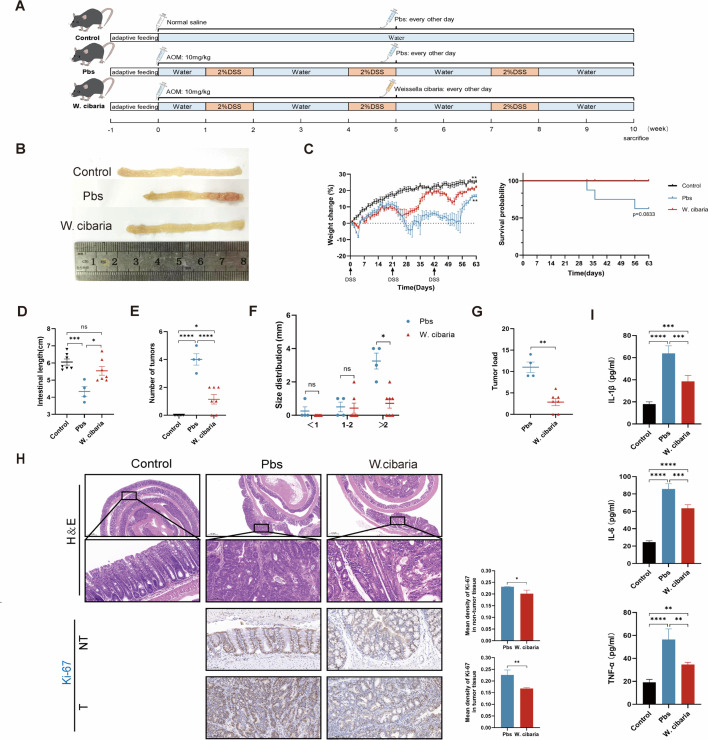
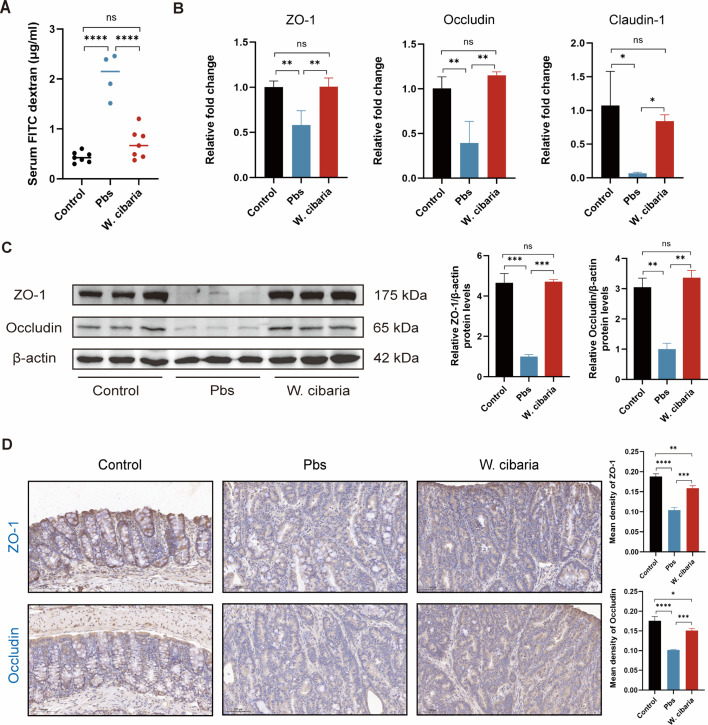
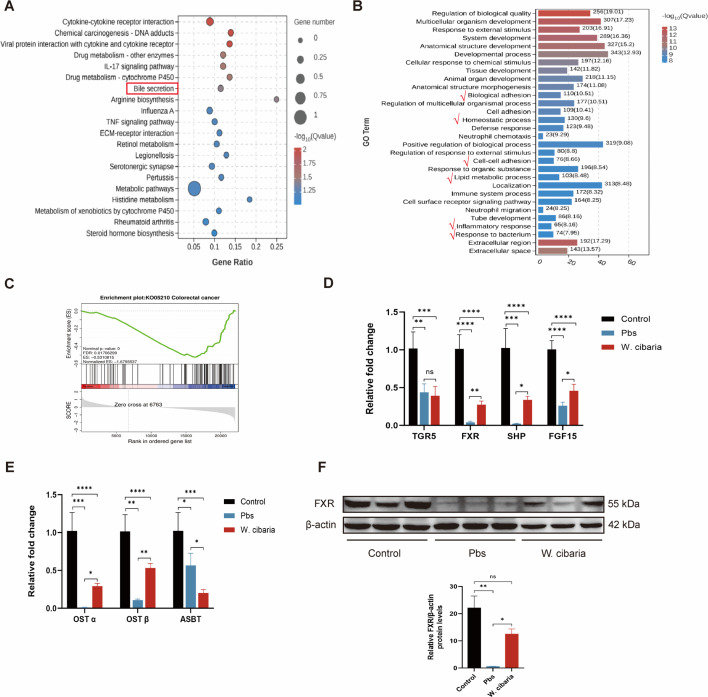
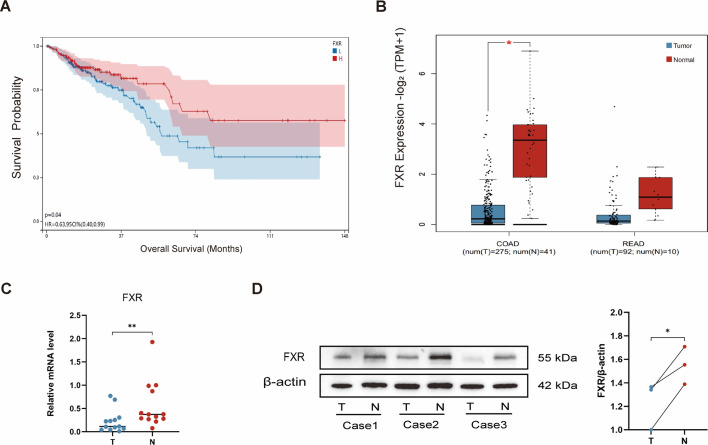
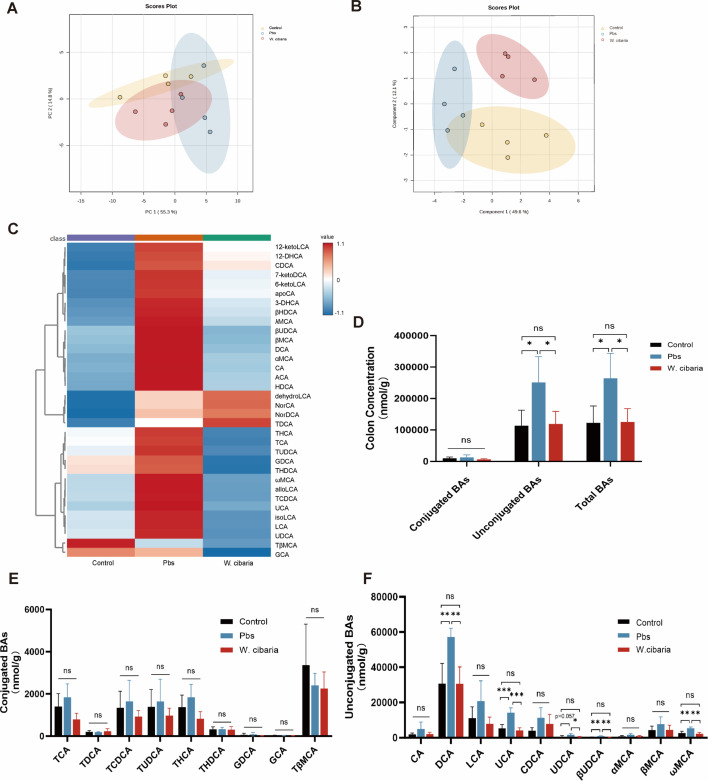
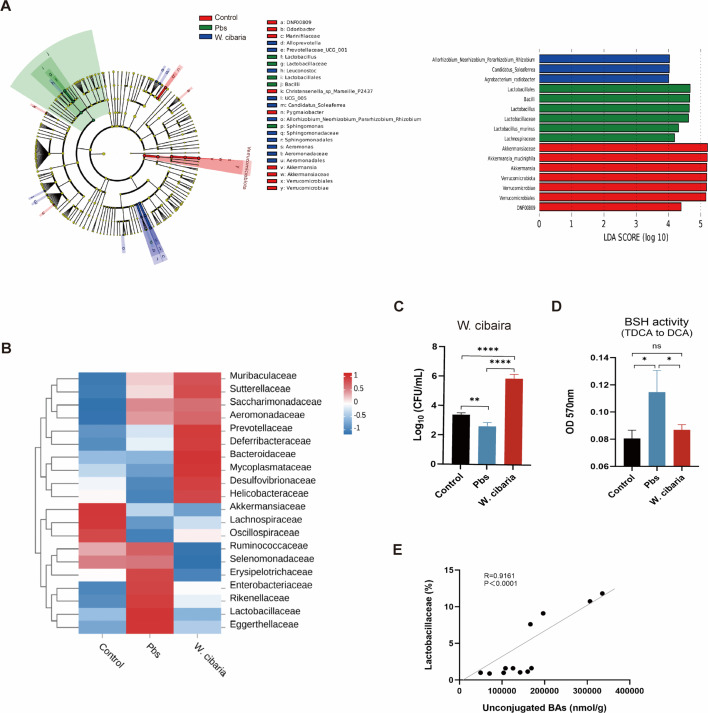
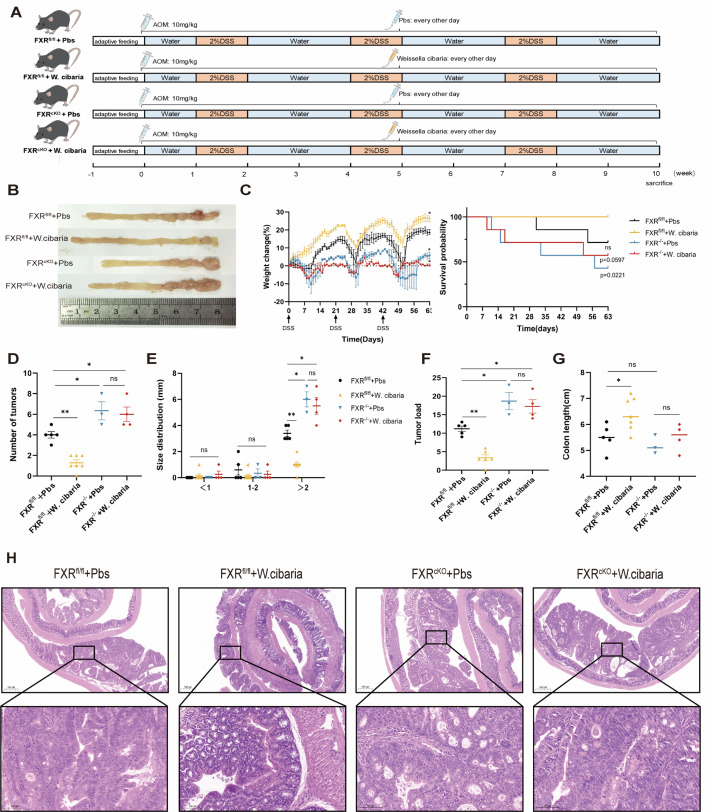
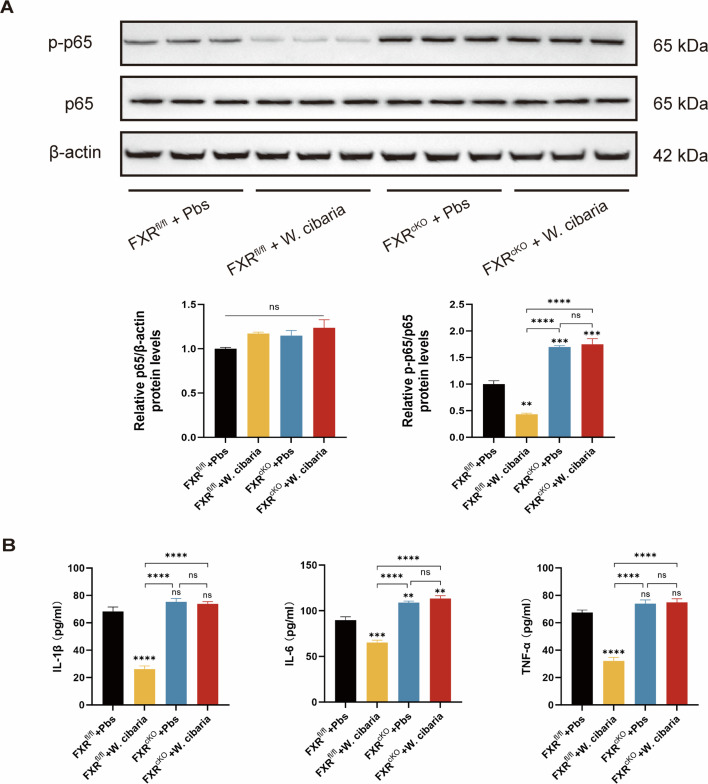
Gut microbiota dysbiosis critically contributes to colitis-associated colorectal cancer (CAC) pathogenesis, positioning microbial modulation as a promising therapeutic strategy. Weissella cibaria (W. cibaria) is an emerging probiotic with potential cancer-inhibiting effects. This study investigates the anti-tumorigenic potential of W. cibaria in an azoxymethane/dextran sulfate sodium-induced CAC murine model. Mice were orally administered W. cibaria every 2 days from the beginning of the model construction until the end of the experiment. The study demonstrated significant changes in the gut microbiota of CAC mice, with a significant increase in the relative abundance of Lactobacillaceae. Supplementation with W. cibaria restored the intestinal barrier and significantly reduced the relative abundance of Lactobacillaceae in the gut microbiota. The changes in the gut microbiota reduced bile salt hydrolase activity and unconjugated bile acid (BA), reversing tumorigenesis in CAC mice. Changes in intestinal BA after W. cibaria supplementation upregulated farnesoid X receptor (FXR) expression in the intestine of CAC mice and inhibited the nuclear factor kappa-B pathway. Our findings establish that W. cibaria mitigates CAC progression through the gut microbiota-BA-FXR axis, providing mechanistic evidence for its probiotic application in CAC prevention and therapy.IMPORTANCEChronic gut inflammation driven by microbiota dysbiosis is a pivotal contributor to colitis-associated colorectal cancer (CAC) pathogenesis. Emerging evidence highlights Weissella cibaria (W. cibaria) as a promising anti-colorectal cancer agent (Y. Du, L. Liu, W. Yan, Y. Li, et al., Sci Rep 13:21117, 2023, https://doi.org/10.1038/s41598-023-47943-7; S. Ahmed, S. Singh, V. Singh, K. D. Roberts, et al., Microorganisms 10:2427, 2022, https://doi.org/10.3390/microorganisms10122427), yet its role in CAC remains unexplored. To address this gap, we investigated the inhibitory effects of W. cibaria on CAC development in vivo and elucidated its underlying mechanisms. Our results demonstrated that oral administration of W. cibaria significantly reshaped gut microbial communities and activated bile acid (BA)-related metabolic pathways. Subsequent mechanistic studies revealed that microbiota remodeling by W. cibaria altered intestinal BA composition, particularly activating the farnesoid X receptor (FXR). FXR activation mediated by these BA shifts was identified as a critical suppressor of tumorigenesis, establishing W. cibaria as a novel probiotic capable of attenuating CAC progression. Collectively, this study uncovers a protective axis linking W. cibaria-driven microbiota modulation, BA metabolism change, and FXR-dependent tumor suppression, providing experimental evidence for probiotic-based CAC intervention strategies.

Keywords: FXR; Weissella cibaria; bile acid; colitis-associated colorectal cancer; gut microbiota.


Conflict of interest statement

The authors declare no conflict of interest.

Figures

Fig 1
Fig 1
W. cibaria inhibits the development of CAC (n = 4–7). (A) Animal experiment protocol (n = 7). (B) Macroscopic view of the colon. (C) Percentage change in body weight for each group of mice based on initial body weight (first feeding of 2% DSS water) and overall survival time of mice. (D) Intestinal length. (E through G) Tumor number, tumor size distribution, and tumor load in the colon of mice (tumor load values were calculated using the formulas provided in Materials and Methods and tumor size distribution data from panel F). (H) Representative mouse intestinal H&E staining images (scale bar = 500 and 100 µm) and Ki67 immunohistochemistry plots and bars of mice. (I) ELISA was performed to measure IL-1β, IL-6, and TNF-α expression levels in colon tissues (n = 4). Data are expressed as mean ± SEM. For comparisons between two groups, two-tailed unpaired Student’s t-tests were used. For multi-group comparisons, one-way ANOVA followed by Tukey’s post hoc test was applied. *P < 0.05; **P < 0.01; ***P < 0.001; ****P < 0.0001; ns, not significant.
Fig 2
Fig 2
W. cibaria restores the intestinal barrier in CAC mice. (A) FITC-dextran concentration (μg/mL) in mice serum . (B) The relative fold change in ZO-1, Occludin, and Claudin-1 expression by qPCR analysis (n = 3). (C) The protein expression of ZO-1 and Occludin in colon tissues. (D) Representative immunohistochemical plots and bar graphs of mouse intestinal tight junction proteins ZO-1 and Occludin for each group (scale bar = 100 µm). Data are expressed as the mean ± SEM. For comparisons between two groups, two-tailed unpaired Student’s t-tests were used. For multi-group comparisons, one-way ANOVA followed by Tukey’s post hoc test was applied. *P < 0.05; **P < 0.01; ***P < 0.001; ****P < 0.0001; ns, not significant.
Fig 3
Fig 3
W. cibaria activates FXR in the gut (n = 4). (A) Results of KEGG enrichment analysis of differential genes in RNA sequencing analysis (RNA-seq). (B) Results of GO enrichment analysis of differential genes in RNA-seq. (C) Results of GSEA enrichment analysis of the gene set of colorectal cancer. (D) The relative fold change in TGR5, FXR, SHP, and FGF15 expression by qPCR analysis. (E) The relative fold change in OST α, OST β, and ASBT expression by qPCR analysis. (F) The protein expression of FXR in colon tissues. Data are expressed as mean ± SEM. For multi-group comparisons, one-way ANOVA followed by Tukey’s post hoc test was applied. *P < 0.05; **P < 0.01; ***P < 0.001; ****P < 0.0001; ns, not significant.
Fig 4
Fig 4
Intestinal FXR expression profile is important in colorectal cancer. (A) The relationship between overall survival time and FXR expression in CRC patients. (B) Comparison of FXR expression in tumor tissue and normal tissue of patients with COAD and READ. Blue box plot represents T (tumor); red box plot represents N (normal). (C) Relative mRNA expression of FXR in tumor tissue (T) and normal tissue (N) of CRC patients (n = 13). (D) The protein expression of FXR in tumor tissue (T) and normal tissue (N) of CRC patients. Data are expressed as the mean ± SEM. For comparisons between two groups, two-tailed unpaired Student’s t-tests were used. *P < 0.05; **P < 0.01; ***P < 0.001; ****P < 0.0001; ns, not significant.
Fig 5
Fig 5
W. cibaria activates FXR by altering bile acid composition. (A) PCA score plot of the colonic BA profiles. (B) PLSDA score plot of the colonic BA profiles. (C) Clustering heat map of BAs. (D) Quantification of BAs in the colonic contents. (E) Changes in the concentration of conjugated BAs in the colonic contents. (F) Changes in the concentration of unconjugated BAs in the colonic contents. Data are expressed as mean ± SEM. For multi-group comparisons, one-way ANOVA followed by Tukey’s post hoc test was applied. *P < 0.05; **P < 0.01; ***P < 0.001; ****P < 0.0001; ns, not significant.
Fig 6
Fig 6
W. cibaria alters the gut microbiota of CAC mice (n = 4). (A) LEfSe cladogram representing taxon enrichment and discriminative microbial biomarkers (LDA score of >3.5, P<0.05). (B) Heatmap of abundance of the top 10 most abundant taxa at the family level. (C) Quantification of W. cibaria in colonic contents by qPCR. (D) Comparison of BSH enzyme activity in colonic contents. (E) The correlation between unconjugated BA level and Lactobacillaceae abundance was analyzed using Spearman’s correlation. Data are expressed as the mean ± SEM. For multi-group comparisons, one-way ANOVA followed by Tukey’s post hoc test was applied. *P < 0.05; **P < 0.01; ***P < 0.001; ****P < 0.0001; ns, not significant.
Fig 7
Fig 7
FXR of the colon plays a crucial role in ameliorating tumorigenesis in CAC mice by W. cibaria . (A) Animal experiment protocol (n = 7). (B) Macroscopic view of the mouse colon. (C) Percentage change in body weight for each group of mice based on initial body weight (first feeding of 2% DSS water) and overall survival time of mice. (D through F) Tumor number, tumor size distribution, and tumor load in the colon of mice (tumor load values were calculated using the formulas provided in Materials and Methods and tumor size distribution data from panel E). (G) Intestinal length. (H) Representative mouse intestinal H&E staining images (scale bar = 500 and 100 µm). The asterisks or ns directly labeled on the scatterplot are significance analyses of differences between the latter groups compared with the first group (FXRfl/fl + Pbs group). Data are expressed as mean ± SEM. For multi-group comparisons, one-way ANOVA followed by Tukey’s post hoc test was applied. *P < 0.05; **P < 0.01; ***P < 0.001; ****P < 0.0001; ns, not significant.
Fig 8
Fig 8
The important role of FXR in NF-κB and inflammatory factors in colon tissues. (A) The protein expression of p-p65 and p65 in colon tissues. (B) ELISA was performed to measure IL-1β, IL-6, and TNF-α expression levels in colon tissues. The asterisks or ns labeled directly on the bar charts are the significance analyses of the differences between the latter groups compared to the first group (FXRfl/fl + Pbs group). Data are expressed as the mean ± SEM. For multi-group comparisons, one-way ANOVA followed by Tukey’s post hoc test was applied. *P < 0.05; **P < 0.01; ***P < 0.001; ****P < 0.0001; ns, not significant.

Similar articles

References

    1. Morgan E, Arnold M, Gini A, Lorenzoni V, Cabasag CJ, Laversanne M, Vignat J, Ferlay J, Murphy N, Bray F. 2023. Global burden of colorectal cancer in 2020 and 2040: incidence and mortality estimates from GLOBOCAN. Gut 72:338–344. doi: 10.1136/gutjnl-2022-327736 - DOI - PubMed
    1. Nardone OM, Zammarchi I, Santacroce G, Ghosh S, Iacucci M. 2023. Inflammation-driven colorectal cancer associated with colitis: from pathogenesis to changing therapy. Cancers (Basel) 15:2389. doi: 10.3390/cancers15082389 - DOI - PMC - PubMed
    1. Wong SH, Zhao L, Zhang X, Nakatsu G, Han J, Xu W, Xiao X, Kwong TNY, Tsoi H, Wu WKK, Zeng B, Chan FKL, Sung JJY, Wei H, Yu J. 2017. Gavage of fecal samples from patients with colorectal cancer promotes intestinal carcinogenesis in germ-free and conventional mice. Gastroenterology 153:1621–1633. doi: 10.1053/j.gastro.2017.08.022 - DOI - PubMed
    1. Grivennikov SI. 2013. Inflammation and colorectal cancer: colitis-associated neoplasia. Semin Immunopathol 35:229–244. doi: 10.1007/s00281-012-0352-6 - DOI - PMC - PubMed
    1. Kang M, Martin A. 2017. Microbiome and colorectal cancer: unraveling host-microbiota interactions in colitis-associated colorectal cancer development. Semin Immunol 32:3–13. doi: 10.1016/j.smim.2017.04.003 - DOI - PubMed

LinkOut - more resources