. 2025 Jul 3:13:RP99752.
doi: 10.7554/eLife.99752.

Heterogeneous efflux pump expression underpins phenotypic resistance to antimicrobial peptides

Affiliations

Heterogeneous efflux pump expression underpins phenotypic resistance to antimicrobial peptides

Ka Kiu Lee et al. Elife. .

Abstract

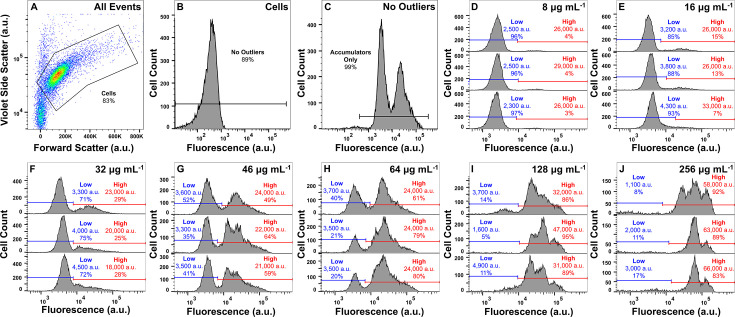
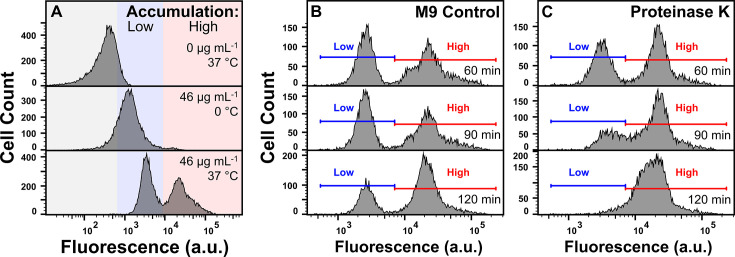
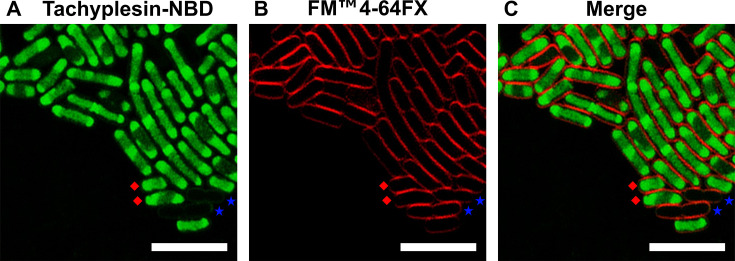
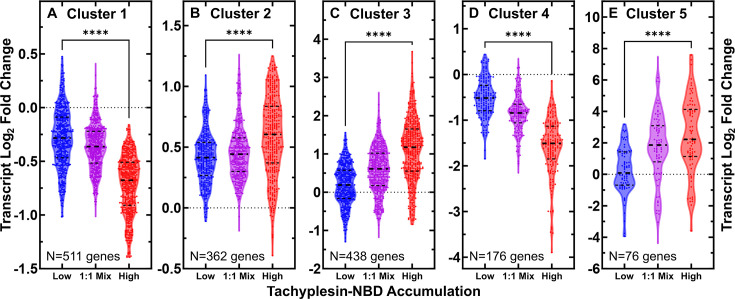
Antimicrobial resistance threatens the viability of modern medical interventions. There is a dire need to develop novel approaches to counter resistance mechanisms employed by starved or slow-growing pathogens that are refractory to conventional antimicrobial therapies. Antimicrobial peptides have been advocated as potential therapeutic solutions due to the low levels of genetic resistance observed in bacteria against these compounds. However, here we show that subpopulations of stationary phase Escherichia coli and Pseudomonas aeruginosa survive tachyplesin treatment without acquiring genetic mutations. These phenotypic variants display enhanced efflux activity to limit intracellular peptide accumulation. Differential regulation of genes involved in outer membrane vesicle secretion, membrane modification, and protease activity was also observed between phenotypically resistant and susceptible cells. We discovered that the formation of these phenotypic variants could be prevented by administering tachyplesin in combination with sertraline, a clinically used antidepressant, suggesting a novel approach for combatting antimicrobial-refractory stationary phase bacteria.

Keywords: E. coli; antibiotic accumulation; antibiotics; antimicrobial peptides; antimicrobial resistance; efflux pump inhibitors; efflux pumps; gene expression; heterogeneity; infectious disease; membrane transport; microbiology; microfluidics; physics of living systems; stationary phase; transcriptomics.


Conflict of interest statement

KL, UŁ, GT, MM, BZ, WP, AV, JW, AB, RY, PO, AF, AJ, Sv, PC, MB, BH, KT, SP No competing interests declared, BI is affiliated with PIPA LLC

Figures

Figure 1.
Figure 1.. Tachyplesin accumulates heterogeneously within clonal E. coli and P. aeruginosa populations.
(A) Tachyplesin-nitrobenzoxadiazole (NBD) accumulation in stationary phase E. coli BW25113 treated with increasing concentrations of tachyplesin-NBD for 60 min (0, 8, 16, 32, 46, 64, 128, and 256 μg mL–1 or 0.0, 3.2, 6.3, 12.7, 18.2, 25.4, 50.7, and 101.5 μM). Shaded regions show low (blue) and high (red) tachyplesin-NBD accumulation within an isogenic E. coli BW25113 population. Each histogram reports 10,000 recorded events and is a representative example of accumulation data from three independent biological replicates (Figure 1—figure supplement 1). (B) Tachyplesin-NBD accumulation in nine stationary phase E. coli clinical isolates treated with 46 μg mL–1 (18.2 μM) tachyplesin-NBD for 60 min. Accumulation data for E. coli BW25113 is reproduced from panel A. (C) Heatmap showing the presence of antimicrobial resistance (AMR) genes and phylogenetic data of the clinical isolates. Corresponding gene products and the antimicrobials these genes confer resistance to are reported in Figure 1—source data 2. (D–F) Tachyplesin-NBD accumulation in P. aeruginosa (D), K. pneumoniae (E), and S. aureus (F) treated with 0 or 46 μg mL–1 (0 or 18.2 μM) tachyplesin-NBD for 60 min. Each histogram in each panel shows a representative example of accumulation data from three independent biological replicates. (G) Representative fluorescence images depicting low and high tachyplesin-NBD accumulators within an E. coli BW25113 population. Bacteria were continuously exposed to 46 μg mL–1 (18.2 μM) tachyplesin-NBD for 60 min in a microfluidic mother machine device. Blue stars and red diamonds indicate low and high accumulators, respectively. Scale bar: 3 μm. (H, I) Representative fluorescence images of individual low (H) and high (I) tachyplesin-NBD accumulators, respectively. Blue and red lines show a 2.2 μm-long cross-sectional line used for measuring fluorescence profile values in J and K, with the origin on the left side. (J, K) Normalised median (solid line), lower and upper quartiles (dotted lines) of fluorescence profile values of E. coli BW25113 cells plotted against the distance along the left side origin of a 2.2-μm-long straight line in low (J) and high (K) tachyplesin-NBD accumulators, respectively. Phenotype assignment was further verified via propidium iodide staining (see Figure 2G). Inset: each dot represents the corresponding membrane-to-cell centre fluorescence ratio measured at the points indicated in H and I, dashed lines indicate the median and quartiles of each distribution. Statistical significance was assessed using an unpaired nonparametric Mann-Whitney U test with a two-tailed p-value and confidence level at 95%. ****p<0.0001. Data were collected from three independent biological replicates.
Figure 1—figure supplement 1.
Figure 1—figure supplement 1.. Gating strategy and dose-dependent response to tachyplesin-nitrobenzoxadiazole (NBD) treatment.
(A–C) Gating strategy for all flow cytometric assays. Bacteria were gated and separated from cellular debris using forward scatter and violet side scatter (A). Background noise was then further separated based on cellular autofluorescence measured on the fluorescein isothiocyanate (FITC)-A channel for cells not treated with fluorescent peptides (B). An additional gate on the FITC-A channel was then used for cells treated with fluorescent peptides to further separate background noise (C). (D–J) Median fluorescence and proportion of low (blue) and high (red) tachyplesin-NBD accumulators within E. coli BW25113 stationary phase populations treated with 8 μg mL–1 (3.2 μM) (D), 16 μg mL–1 (6.3 μM) (E), 32 μg mL–1 (12.7 μM) (F), 46 μg mL–1 (18.2 μM) (G), 64 μg mL–1 (25.4 μM) (H), 128 μg mL–1 (50.7 μM) (I), or 256 μg mL–1 (101.5 μM) (J) tachyplesin-NBD in M9 at 37 °C for 60 min. Each of the three graphs in each panel shows data for 10,000 events collected from an independent biological replicate. The horizontal lines in each graph represent the manual gating applied.
Figure 1—figure supplement 2.
Figure 1—figure supplement 2.. Tachyplesin-nitrobenzoxadiazole (NBD) accumulation in stationary and exponential phase E. coli BW25113.
Stationary (A) and exponential (B) phase E. coli BW25113 were treated with 46 μg mL–1 (18.2 μM) tachyplesin-NBD in M9 at 37 °C for 60 min and single-cell fluorescence was measured via flow cytometry. The blue and red horizontal lines in each graph represent the gating applied and the median fluorescence and proportion of cells in the corresponding gate are reported within each graph. Each of the three graphs in each panel shows data collected from an independent biological replicate.
Figure 1—figure supplement 3.
Figure 1—figure supplement 3.. Dose-dependent response to arenicin-nitrobenzoxadiazole (NBD), polymyxin-B-NBD, and octapeptin-NBD treatment.
(A–C) Stationary phase E. coli BW25113 was treated with 0, 8, 16, 32, 46, or 64 μg mL–1 of arenicin-NBD (0.0, 2.8, 5.7, 11.3, 16.3, 22.7, 45.4, or 90.7 μM) (A), polymyxin-B-NBD (0.0, 7.0, 13.9, 27.9, 40.0, 55.7, 111.4, or 222.8 μM) (B), and octapeptin-NBD (0.0, 6.1, 12.3, 24.5, 35.3, 49.1, 98.2, or 196.3 μM) (C) in M9 at 37 °C for 60 min. Data are representative of data collected from three biological replicates.
Figure 1—figure supplement 4.
Figure 1—figure supplement 4.. Impact of environmental temperature and proteinase K on tachyplesin-nitrobenzoxadiazole (NBD) accumulation.
(A) Stationary phase E. coli BW25113 were treated with 0 or 46 μg mL–1 (0 or 18.2 μM) tachyplesin-NBD in M9 at 37 °C or on ice for 60 min. Each panel shows data representative of three independent biological replicates. (B, C) Stationary phase E. coli BW25113 were treated with 46 μg mL–1 (18.2 μM) tachyplesin-NBD in M9 at 37 °C for 60 min. Cells were washed and then incubated in either M9 (B) or 20 μg mL–1 (0.7 μΜ) proteinase K in M9 (C) at 37 °C for 120 min. Each panel shows data representative of three independent biological replicates.
Figure 1—figure supplement 5.
Figure 1—figure supplement 5.. Distribution of single-cell tachyplesin-nitrobenzoxadiazole (NBD) accumulation in the microfluidic mother machine.
Distribution of tachyplesin-NBD accumulation in stationary phase E. coli BW25113 treated with 46 μg mL–1 (18.2 μM) tachyplesin-NBD in M9 at 37 °C for 60 min then washed with M9 at 37 °C for 60 min in the microfluidic mother machine.
Figure 1—figure supplement 6.
Figure 1—figure supplement 6.. Representative live-cell confocal microscopy images of E. coli treated with tachyplesin-nitrobenzoxadiazole (NBD) and FM 4–64 FX.
Exponential phase E. coli ATCC 25922 were treated with 16 μg mL–1 (6.3 μM) tachyplesin-NBD at 37 °C for 30 min, followed by staining with 5 μg mL–1 (6.3 μM) FM 4–64 FX, a membrane-specific dye on ice. The samples were then visualised using confocal microscopy. (A) Image showing tachyplesin-NBD fluorescence (green), indicating antimicrobial peptides (AMP) accumulation in the cells. (B) Image showing FM 4–64 FX fluorescence (red), highlighting the bacterial cell membrane. (C) Merged images from panels A and B, showing the intracellular accumulation of tachyplesin-NBD. Blue stars and red diamonds indicate representative low and high accumulators, respectively. Scale bars represent 5 μm. Data were collected from three independent biological replicates.
Figure 1—figure supplement 7.
Figure 1—figure supplement 7.. Comparison of cell sizes between low and high tachyplesin-nitrobenzoxadiazole (NBD) accumulators.
(A, B) Distribution of forward scatter (A) and violet side scatter (B) of low (blue) and high (red) accumulators after treatment with 46 μg mL–1 (18.2 μM) tachyplesin-NBD in M9 at 37 °C for 60 min. Corresponding medians reported in each graph. Each histogram in each panel shows data collected from an independent biological replicate. (C) Distribution of cell lengths of low and high tachyplesin-NBD accumulators measured by using the microfluidics-based microscopy platform. Stationary phase E. coli was treated with 46 μg mL–1 (18.2 μM) tachyplesin-NBD in M9 at 37 °C for 60 min, then washed with M9 at 37 °C for 60 min in the microfluidic mother machine. Classification of low and high tachyplesin-NBD accumulators was further validated by propidium iodide staining (see Figure 2G). Statistical significance was assessed using an unpaired two-tailed nonparametric Mann-Whitney U test. p-value: ***p=0.0002. Data were collected from three independent biological replicates.
Figure 2.
Figure 2.. Intracellular tachyplesin accumulation is essential for its antimicrobial efficacy.
(A, B) Fluorescence and side scatter values of individual E. coli treated with M9 at 37 °C for 60 min (A) and 46 μg mL–1 (18.2 μM) tachyplesin-nitrobenzoxadiazole (NBD) in M9 at 37 °C for 60 min (B). The black rectangles show the gates used to sort approximately one million untreated control cells, low and high tachyplesin-NBD accumulators for subsequent analysis. Data collected from four independent biological replicates. (C) Survival fraction of cells sorted through the untreated control, low, and high tachyplesin-NBD accumulator gates presented in A and B. Bars and error bars represent the mean and standard deviation of data obtained from four biological replicates, each comprising three technical replicates. Statistical significance was assessed using an ordinary one-way ANOVA with Tukey’s multiple comparisons test and confidence level at 95%. ****p<0.0001, ns: p>0.05. (D–F) Representative microscopic images depicting brightfield (D), tachyplesin-NBD fluorescence (E), and propidium iodide (PI) fluorescence (F) after exposure to 46 μg mL–1 (18.2 μM) tachyplesin-NBD in M9 for 60 min, followed by a M9 wash for 60 min, then 30 µM PI staining for 15 min at 37 °C in the microfluidic mother machine. Blue stars and red diamonds indicate low and high accumulators, respectively. Scale bar indicates 2.5 μm. The left part of (E) is reproduced from part of Figure 1G. (G) Correlation between tachyplesin-NBD and PI fluorescence of N=371 individual E. coli cells collected from three independent biological replicates. The purple dashed line shows a nonlinear regression (semi-log) of the data (r2=0.70). (H) Correlation between the proportion of low accumulators as a percentage of the whole bacterial population measured via flow cytometry and survival fraction measured via colony-forming unit assays. Symbols and error bars represent the mean and standard deviation of three independent biological replicates, each comprising three technical replicates. Tachyplesin-NBD treatment concentration indicated by colour gradient. Some error bars are masked by the data points. The purple dashed line illustrates a linear regression of the data (r2=0.98, p-value <0.0001).
Figure 2—figure supplement 1.
Figure 2—figure supplement 1.. Fluorescence-activated cell sorting of untreated cells, low and high tachyplesin-nitrobenzoxadiazole (NBD) accumulators.
(A) Gating on side scatter width against side scatter height was applied on all events to separate single cells from cell aggregates. (B–H) Representative plots of fluorescence and side scatter of: M9 only (B); individual E. coli incubated in M9 at 37 °C for 60 min (C); post-sort analysis of E. coli sorted through control gate in C (D); individual E. coli incubated in 46 μg mL–1 (18.2 μM) tachyplesin-NBD at 37 °C for 60 min (E); post-sort analysis of E. coli sorted through the low gate in E (F); post-sort analysis of a 1:1 mixture of E. coli sorted through the low and high gates in E (G); post-sort analysis of E. coli sorted through the high gate in E (H). Data were collected from four independent biological replicates.
Figure 3.
Figure 3.. Biological processes associated with low tachyplesin accumulation.
(A, B) Log2 fold changes in transcript reads of genes in low and high tachyplesin-nitrobenzoxadiazole (NBD) accumulators (blue and red violin plots, respectively) relative to untreated stationary phase E. coli bacteria in cluster 2 (A) and cluster 4 (B). Each dot represents a single gene, dashed lines indicate the median and quartiles of each distribution. Dotted lines represent a log2 fold change of 0. Statistical significance was tested using a paired two-tailed Wilcoxon nonparametric test (due to non-normally distributed data) with a two-tailed p-value and confidence level at 95%. ****p-value <0.0001. The full list of genes belonging to each cluster is reported in Figure 3—source data 2 and the violin plots of log2 fold changes for all clusters are shown in Figure 3—figure supplement 2. Data were collected from four independent biological replicates, then pooled for analysis. (C, D) Corresponding gene ontology enrichment plots of biological processes enriched in cluster 2 (C) and 4 (D). Each dot represents a biological process with its size indicating the number of genes associated with each process and the colour indicating the false discovery rate (FDR). The lines and their thickness represent the abundance of mutual genes present within the connected biological processes. The enrichment plot for cluster 5 is not shown as only one biological process, ‘response to biotic stimulus,’ was enriched. Full details about each process are reported in Figure 3—source data 3. (E) Relative abundance of lipid classes (PG, phosphatidylglycerol; FA, fatty acids; PE, phosphatidylethanolamine; LPE, lysophosphatidylethanolamine) in untreated bacteria and bacteria treated with 46 µg mL–1 (18.2 μM) tachyplesin-NBD for 60 min.
Figure 3—figure supplement 1.
Figure 3—figure supplement 1.. Principal component analysis of transcriptomes.
Cells were analysed after 60 min treatment in M9 only (black) or 46 μg mL–1 (18.2 μM) tachyplesin-nitrobenzoxadiazole (NBD), then sorted for low (blue) and high (red) accumulators, and 1:1 mix (purple) accumulators (generated by a 1:1 mixture of low and high accumulators). Circles, squares, diamonds, and triangles indicate four separate biological replicates.
Figure 3—figure supplement 2.
Figure 3—figure supplement 2.. Clustering of differentially regulated genes in low, 1:1 mix, and high accumulators of tachyplesin-nitrobenzoxadiazole (NBD).
(A–E) Log2 fold changes in transcript reads of genes in cluster 1 (A), 2 (B), 3 (C), 4 (D), and 5 (E) in low (blue), 1:1 mix (purple), and high (red) tachyplesin-NBD accumulators relative to the control treatment. Each point represents a single gene, dashed lines indicate the median and quartiles of each distribution. Dotted lines represent a log2 fold change of 0. Statistical significance was tested using a paired Wilcoxon nonparametric test (due to non-normally distributed data) with a two-tailed p-value and confidence level at 95%. ****p<0.0001. The full list of genes belonging to each cluster is reported in Figure 3—source data 2. Data were collected from four independent biological replicates.
Figure 3—figure supplement 3.
Figure 3—figure supplement 3.. Clustering of lipidomes of low and high accumulators of tachyplesin-nitrobenzoxadiazole (NBD).
Orthogonal partial least squares-discriminant analysis of the lipidomes measured for bacteria treated in M9 only (black) or sorted low (blue) or high (red) accumulators after 46 μg mL–1 (18.2 μM) tachyplesin-NBD treatment for 60 min. Circles, squares, and diamonds indicate three separate biological replicates.
Figure 3—figure supplement 4.
Figure 3—figure supplement 4.. Inferred transcription factor (TF) activity for the ten TFs with highest inferred activity in low and high tachyplesin-nitrobenzoxadiazole (NBD) accumulators.
TF activity reported as normalised enrichment scores (NES), for low and high accumulators (blue and red bars, respectively). Activity was inferred using Figure 3—source data 2 and a full list of TFs and the genes they regulate within each cluster is reported in Figure 3—source data 4.
Figure 4.
Figure 4.. Low accumulators of tachyplesin-NBD display enhanced efflux activity.
(A) Distribution of tachyplesin-nitrobenzoxadiazole (NBD) accumulation in stationary phase E. coli BW25113 over 240 min of treatment with 46 μg mL–1 (18.2 μM) tachyplesin-NBD in M9 at 37 °C. (B) Tachyplesin-NBD accumulation in E. coli BW25113 single or double gene-deletion mutants lacking efflux components or regulators of efflux components. Stationary phase populations of each mutant were treated with 46 μg mL–1 (18.2 μM) tachyplesin-NBD at 37 °C for 60 min and single-cell fluorescence was measured via flow cytometry. (C, D) Efflux of tachyplesin-NBD over 240 min, after an initial 15 min preloading with 46 μg mL–1 (18.2 μM) tachyplesin-NBD in M9 then washed and transferred into either M9 (C), or sertraline (30 μg mL–1 or 98 μM) (D). The top histograms of panels B-D are reproduced from the 10 min histogram of panel A. Histograms in panels A-D are representative of three independent biological replicates and report 10,000 events. (E, F) Correlation of tachyplesin-NBD and PI fluorescence of individual stationary phase E. coli BW25113 cells measured in the microfluidic mother machine after 60 min of 46 μg mL–1 (18.2 μM) tachyplesin-NBD treatment (N=108) (E), or 46 μg mL–1 (18.2 μM) tachyplesin-NBD cotreatment with 30 μg mL–1 (98 μM) sertraline (N=108) (F). Purple dashed lines show nonlinear (semi-log) regressions (r2=0.74 and 0.38, respectively). (G) Survival fraction of stationary phase E. coli BW25113 over 240 min treatment with tachyplesin-1 (46 μg mL–1 or 20.3 μM, magenta squares), sertraline (30 μg mL–1 or 98 μM, green circles), tachyplesin-1 (46 μg mL–1 or 20.3 μM) cotreatment with sertraline (30 μg mL–1 or 98 μM) (purple triangles), or incubation in M9 (black diamonds). Symbols and error bars indicate the mean and standard deviation of measurements performed in three independent biological replicates comprising three technical replicates each. Some error bars are masked behind the symbols.
Figure 4—figure supplement 1.
Figure 4—figure supplement 1.. Ethidium bromide efflux in the presence and absence of unlabelled tachyplesin-1.
E. coli cells were pre-loaded with ethidium bromide (EtBr) by adding 100 μg mL–1 (254 μM) EtBr to a stationary phase culture 90 min before reaching 17 hr incubation at 37 °C and 200 rpm. Cells were then washed to remove extracellular EtBr before resuspending in either M9 (A) or 46 μg mL–1 (20.3 μM) unlabelled tachyplesin. Single-cell EtBr fluorescence was then measured via flow cytometry over 120 min. Histograms are representative of three independent biological replicates.
Figure 4—figure supplement 2.
Figure 4—figure supplement 2.. Impact of efflux component and transcription factor deletion on tachyplesin-nitrobenzoxadiazole (NBD) accumulation.
Tachyplesin-NBD accumulation in E. coli BW25113 single or double gene-deletion mutants lacking either efflux components or regulators of efflux components or the transcription factors reported in Figure 3—figure supplement 4. Stationary phase populations of each mutant were treated with 46 μg mL–1 (18.2 μM) tachyplesin-NBD at 37 °C for 60 min and single-cell fluorescence was measured via flow cytometry. Histograms are representative of three independent biological replicates.
Figure 4—figure supplement 3.
Figure 4—figure supplement 3.. Tachyplesin-nitrobenzoxadiazole (NBD) efflux in the presence of different efflux pump inhibitors.
(A–I) Temporal dependence of the distribution of tachyplesin-NBD accumulation in stationary phase E. coli treated in 46 μg mL–1 (18.2 μM) tachyplesin-NBD in M9 for 15 min, then washed to remove extracellular tachyplesin-NBD and transferred into M9 (A), CCCP (50 μg mL–1 or 244 μM) (B), sertraline (30 μg mL–1 or 98 μM) (C), verapamil (50 μg mL–1 or 110 μM) (D), berberine (250 μg mL–1 or 743 μΜ) (E), baicalein (25 μg mL–1 or 93 μM) (F), phenylalanine-arginine beta-naphthylamide (PAβN; 20 μg mL–1 or 53 μM) (G), reserpine (20 μg mL–1 or 33 μM) (H) and 1-(1-naphthylmethyl)piperazine (NMP; 100 μg mL–1 or 442 μM) (I). Each distribution is representative of three independent biological replicates.
Figure 4—figure supplement 4.
Figure 4—figure supplement 4.. Differences in metabolic activity of low and high tachyplesin-nitrobenzoxadiazole (NBD) accumulators.
Stationary phase E. coli BW25113 were treated with 46 μg mL–1 (18.2 μM) tachyplesin-NBD in carbon-free M9 at 37 °C for 60 min. Cells were washed and then incubated in 1 μM resazurin and 50 μM CCCP in carbon-free M9 at 37 °C for 15 min. Single-cell fluorescence of resorufin and tachyplesin-NBD fluorescence was measured simultaneously with flow cytometry. (A) Single-cell resorufin fluorescence in all cells. The blue (low) and red (high) horizontal lines in each graph represent the gating applied and the median resorufin fluorescence of cells in the corresponding gate is reported within each gate. (B) Single-cell tachyplesin-NBD fluorescence measured in all cells (top panel); cells measured with low resorufin fluorescence (middle panel, showing cells only within the low resorufin gate in panel A); cells measured with high resorufin fluorescence (bottom panel, showing cells only within the high resorufin gate in panel A).
Figure 5.
Figure 5.. Impact of nutritional environment and growth phase on tachyplesin-nitrobenzoxadiazole (NBD) accumulation and efficacy.
(A, B) Temporal dependence of the distribution of tachyplesin-NBD accumulation in stationary phase E. coli in M9 supplemented with 0.4% glucose and 0.2% casamino acids (A) and exponential phase E. coli in M9 only (B) treated with 46 μg mL–1 (18.2 μM) tachyplesin-NBD. Each distribution is representative of three independent biological replicates. (C) Survival fraction of untreated stationary phase E. coli in M9 only (black diamonds), and bacteria treated with 46 μg mL–1 (18.2 μM) tachyplesin-NBD over 240 min in stationary phase E. coli in M9 only (green circles), stationary phase E. coli treated in M9 supplemented with 0.4% glucose and 0.2% casamino acids (purple triangles), exponential phase E. coli treated in M9 only (magenta squares). Symbols and error bars indicate the mean and standard deviation of three biological replicates measured from three technical replicates each. Some error bars are masked behind the symbols.
Figure 5—figure supplement 1.
Figure 5—figure supplement 1.. Impact of the bacterial phase of growth on cell size.
(A, B) Histograms showing the forward scatter (A) and side scatter (B) of high tachyplesin-nitrobenzoxadiazole (NBD) accumulators in stationary (blue) and exponential (red) phase cells after treatment in 46 μg mL–1 (18.2 μM) tachyplesin-NBD in M9 at 37 °C for 60 min with the corresponding median values reported for each distribution. Each distribution is representative of three independent biological replicates.

Update of

  • doi: 10.1101/2024.04.22.590445
  • doi: 10.7554/eLife.99752.1
  • doi: 10.7554/eLife.99752.2
  • doi: 10.7554/eLife.99752.3

Similar articles

References

    1. Ahmad M, Aduru SV, Smith RP, Zhao Z, Lopatkin AJ. The role of bacterial metabolism in antimicrobial resistance. Nature Reviews. Microbiology. 2025;23:439–454. doi: 10.1038/s41579-025-01155-0. - DOI - PMC - PubMed
    1. Allison KR, Brynildsen MP, Collins JJ. Metabolite-enabled eradication of bacterial persisters by aminoglycosides. Nature. 2011;473:216–220. doi: 10.1038/nature10069. - DOI - PMC - PubMed
    1. AlMatar M, Albarri O, Makky EA, Köksal F. Efflux pump inhibitors: new updates. Pharmacological Reports. 2021;73:1–16. doi: 10.1007/s43440-020-00160-9. - DOI - PubMed
    1. Alvarez MJ, Shen Y, Giorgi FM, Lachmann A, Ding BB, Ye BH, Califano A. Functional characterization of somatic mutations in cancer using network-based inference of protein activity. Nature Genetics. 2016;48:838–847. doi: 10.1038/ng.3593. - DOI - PMC - PubMed
    1. Andersson DI, Nicoloff H, Hjort K. Mechanisms and clinical relevance of bacterial heteroresistance. Nature Reviews. Microbiology. 2019;17:479–496. doi: 10.1038/s41579-019-0218-1. - DOI - PubMed

MeSH terms