. 2025 Aug 4;224(8):e202407209.
doi: 10.1083/jcb.202407209. Epub 2025 Jul 3.

Sphingolipid synthesis maintains nuclear membrane integrity and genome stability during cell division

Affiliations

Sphingolipid synthesis maintains nuclear membrane integrity and genome stability during cell division

Sunyoung Hwang et al. J Cell Biol. .

Abstract

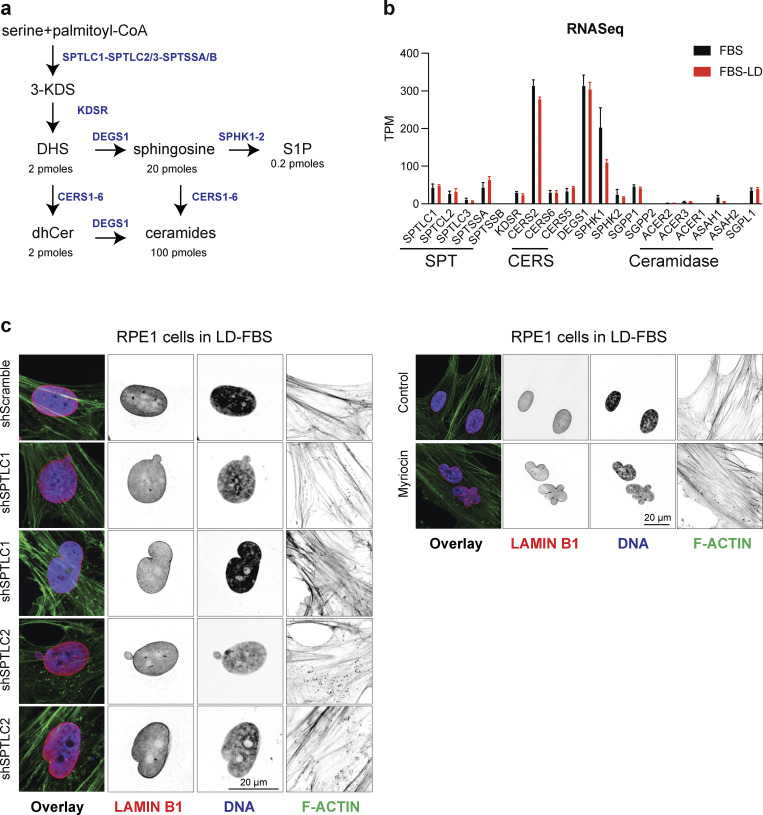
Lipid synthesis must be precisely regulated to support membrane growth and organelle biogenesis during cell division, yet little is known about how this process is coordinated with other cell cycle events. Here, we show that de novo synthesis of sphingolipids during the S and G2 phases of the cell cycle is essential to increasing nuclear membranes. Indeed, the products of serine palmitoyltransferase (SPT), long-chain bases, localize to the nucleus and are integral components of nuclear membranes in yeast and human cells. Importantly, inhibition of SPT fails to induce cell cycle arrest, causing nuclear membrane collapse and loss of viability in yeast cells. In human cells, this causes abnormal nuclear morphology and genomic instability, evidenced by the increased incidence of nuclear blebs, micronuclei, anaphase bridges, and multipolar mitosis. These results indicate that dysregulated cell division under low sphingolipid availability can drive several disease-associated phenotypes, including aberrant nuclear morphologies and genomic instability.


Conflict of interest statement

Disclosures: The authors declare no competing interests exist.

Figures

Figure S1.
Figure S1.
Synthesis of LCBs determines nuclear shape and volume in yeast. (a) De novo synthesis pathways of the three major classes of structural lipids in human and yeast cells are conserved. (b) De novo synthesis pathway of sphingolipids in yeast and human. DHS and PHS are the main LCB in yeast. DHS and Sph are the main LCB in human. (c) Strategies to target sphingolipid levels in yeast cells. (d) LCB and ceramide levels in yeast cells. Data are obtained from Hwang et al. (2019). Error bars represent the standard deviations (n = 3). *P < 1e-4, one-way ANOVA. NS, P > 0.05. (e) Relative doubling time is not affected upon deleting LCB4 or LAG1. Error bars represent standard deviations (n = 3). NS, P > 0.05, one-way ANOVA test.
Figure 1.
Figure 1.
Levels of LCBs determine nuclear shape and volume in yeast. (a) De novo synthesis pathway of sphingolipids in yeast. See Fig. S1 b for a more detailed description of the pathway. Genes targeted in our experiments are highlighted in blue. SPT, serine palmitoyltransferase; SphK, sphingosine kinase (LCB4); CerS, ceramide synthase (LAG1); LCBs, long-chain bases; LCB-P, LCB-1-phosphate. (b) Live-cell microscopy of yeast cells expressing Heh1-GFP. DIC, differential interference contrast. Scale bar, 5 µm. (c) Area of nuclei of WT yeast and cells harboring the tsc3∆ (n > 100 cells). *P < 1 e-4, unpaired t test. (d) Representative electron microscopy image of WT yeast and TSC3 deletion (tsc3∆). NE contour labeled with a white dotted line for visualization. Scale bars, 400 nm. (e) Live-cell microscopy of yeast cells expressing Heh1-GFP harboring the lcb4∆ or lag1∆. Scale bar, 5 µm. Changes in the levels of LCBs relative to WT cells in these strains are shown below (data from Hwang et al. [2019]). (f) Area of isolated nuclei of WT yeast and cells harboring the lcb4∆ or lag1∆. Box plots of quantification of nuclear areas (n = 200 cells). *P < 1 e-4, one-way ANOVA test. (g) Coulter counter profiles of purified yeast nuclei (n = 10,000). (h) Coulter counter profiles of yeast cells (n = 10,000). (i) Model of how changing the levels of LCBs affects the nucleus.
Figure 2.
Figure 2.
Inhibition of SPT disrupts nuclear membrane integrity and causes lethality in yeast. (a) Live-cell microscopy of yeast cells expressing Heh1-GFP treated with 5 µM myriocin or 10 µM cerulenin for the indicated times. DIC, differential interference contrast. Scale bar, 5 µm. (b) Quantification of the nuclear phenotype of yeast cells treated with 5 µM myriocin or 10 µM cerulenin (n = 200 cells) at indicated times. (c) Representative images of CFU assay of yeast cells following treatment with 5 µM myriocin or 10 µM cerulenin at 0 or 4 h. Scale bar, 1 cm. (d) Percentage of viable cells quantified by CFU of 200 cells (n = 3). Error bars represent the standard deviation. *P < 1 e-4, one-way ANOVA test. NS, P > 0.05. (e) Growth curves of yeast cells quantified with a Coulter counter at indicated time points. *P < 1 e-5, paired t test. (f) HPLC-MS/MS analysis of LCBs and ceramides in yeast cells treated with 5 µM myriocin or 10 µM cerulenin at indicated times. Columns represent experiments, and rows represent lipid species. Log2 ratios of the relative lipid levels in comparison with untreated cells are shown. Cer, ceramide; dh, dihydro; DHS, dihydrosphingosine; PHS, phytosphingosine. (g and h) Plots of the total lipid classes as a function of time of the lipidome data presented in Fig. 2 f.CFU, colony-forming unit; HPLC-MS/MS, high-performance liquid chromatography–tandem mass spectrometry.
Figure 3.
Figure 3.
Gene expression analysis in response to SPT inhibition. (a) Gene expression analysis of yeast cells treated with 5 µM myriocin for 0, 60, or 180 min grown in batch culture. Experiments (columns), genes (rows), and log2 ratios relative to untreated controls (time 0 min) are ordered by chromosome position. Upregulated genes are shown in yellow, downregulated genes are in blue, and genes that do not change are in black. (b) Percentage of transcripts that show a 1.4-fold change in levels relative to untreated controls in 0, 60, or 180 min. Relative levels of LCB, ceramides, and viability at each time point are shown below. Pearson’s correlation coefficient r is shown. (c) Hierarchical clustering of the gene expression data presented in Fig. 2 b.
Figure 4.
Figure 4.
LCB synthesis takes place upon entry into the cell cycle. (a) DNA content of yeast cells (n = 30,000) after release from a pheromone-induced G1 arrest without or with myriocin (2.5 µM) at indicated time points. The asterisk denotes the beginning of the S phase. (b) Western blot analysis of mitotic Clb2 levels after release from G1 arrest. The PSTAIR antibody was used as a loading control. Relative levels of Clb2 quantified with ImageJ are shown under the western mages. The percentage of budded cells quantified by visual inspection of DIC images are shown below (n = 200). (c) HPLC-MS/MS analysis of LCB and ceramides in yeast cells harvested at indicated time points after release from a G1 arrest. Log2 ratios of the lipid levels relative to time 0 min are shown. Columns represent experiments, and rows represent lipid species. Cer, ceramide; dh, dihydro; DHS, dihydrosphingosine; PHS, phytosphingosine. (d) Plots of the total lipid classes as a function of time of the lipidome data presented in Fig. 2 c. *P < 1 e-40, paired t test comparison with time 0 min. (e and f) Live-cell microscopy of yeast cells expressing Heh1-GFP 120 min after the release from the G1 arrest in the minimal media without (e) or with (f) 2.5 µM myriocin. Scale bar, 2 µm. Mother cells show a shmoo from the G1 arrest and are labeled M. Daughter cells are labeled D. (g) Live-cell microscopy of yeast cells expressing Heh1-GFP 100 min after the release before anaphase from the G1 arrest in minimal media with 2.5 µM myriocin shows no defects. (h) Live-cell microscopy of yeast cells expressing Heh1-GFP 120 min after the release before anaphase from the G1 arrest in minimal media with 10 µM cerulenin. (i) Western blot analysis of mitotic Clb2 levels after release from G1 arrest in the presence of 10 µM cerulenin. The PSTAIR antibody was used as a loading control. Relative levels of Clb2 quantified with ImageJ are shown. HPLC-MS/MS, high-performance liquid chromatography–tandem mass spectrometry. Source data are available for this figure: SourceData F4.
Figure 5.
Figure 5.
LCBs are integral components of the nuclear membrane in human cells. (a) Chemical structure of the fluorescent probes used in our studies. DHS, dihydrosphingosine; Cer, ceramide; NBD, nitrobenzoxadiazole. (b) Live-cell microscopy of HeLa cells expressing mCherry-Farnesyl-5 (red, plasma membrane) and incubated with 1 µM DHS-NBD (green) for 20 min. Scale bar in the left image, 10 µm, and in zoomed images, scale bar, 2 µm. NE indicates NE. Fluorescence intensity across the white dotted lines is shown below. (c) Live-cell microscopy of HeLa cells expressing mCherry-Farnesyl-5 and incubated with 1 µM C18-Cer-NBD (green) for 20 min. Scale bar in the left image, 10 µm; in zoomed images, scale bar, 2 µm. PM, plasma membrane. Fluorescence intensity across the white dotted lines is shown below. (d–g) Live-cell microscopy of HeLa cells incubated with 1 µM DHS-NBD (green) for 20 min. In d, cells express Sec61-mCherry (NE and ER); in e, cells express mCherry-Golgi-7 (Golgi apparatus); in f, cells express LAMP1-mCherry (lysosome); and in g, cell express mCherry-mito-7 (mitochondria). Scale bar in the left image, 10 µm; in zoomed images, scale bar, 2 µm. Fluorescence intensity across the white dotted lines is shown below. (h) DIC images of a T cell and purified nucleus. Scale bar, 2 µm. (i) Western blot analysis of the different organelle markers in whole-cell extracts and isolated nuclei from T cells. (j and k) HPLC-MS/MS analysis of ceramides (j) and LCBs (k) of primary T cells and isolated nuclei from the T cells. Error bars represent standard deviations (n = 3 independent samples from human blood, >106 cells or nuclei analyzed per sample). *P < 1e-4, unpaired t test. NS, P value >0.05. HPLC-MS/MS, high-performance liquid chromatography–tandem mass spectrometry. Source data are available for this figure: SourceData F5.
Figure S2.
Figure S2.
LCBs are integral components of the nuclear membrane in human cells. (a–c) Live-cell microscopy of HeLa cells expressing mCherry-Farnesyl-5 (red, plasma membrane) incubated for 20 min with 1 µM Sph-NBD (a), S1P-NBD (b), or C6-ceramide-NBD (c). Scale bar, 5 µm. Scale bar in zoomed images, 1 µm.
Figure 6.
Figure 6.
Inhibition of SPT disrupts nuclear morphology in human cells. (a) De novo synthesis pathway of sphingolipids in humans. See Fig. S1 b for a more detailed description of the pathway. Chemicals used in our experiments are highlighted in red: Myr, myriocin; Fum B1, fumonisin B1. SPTC1 and SPTLC2 are the main subunits of SPT; LCBs, long-chain bases; CerS, ceramide synthase. (b) Representative immunofluorescence images of RPE-1 cells upon knockdown of scramble sequence (Control), SPTLC1, or SPTLC2. Green, anti-alpha-tubulin; purple, Hoechst 33342 (DNA); and red, anti-lamin B1. Scale bar, 5 µm. Some images are also shown in Fig. S4 c. (c) Representative images of cells treated with 5 µM myriocin or 10 µM fumonisin B1. Immunofluorescence markers as in b. Scale bar, 5 µm. Some images are also shown in Fig. S4 c. (d) Percentage of the nuclear phenotype of RPE-1 cells. Cells were treated with 5 µM myriocin or 10 µM fumonisin B1 (n = 200 cells). Abnormal refers to irregular nuclear shape relative to normal round nuclei. (e) Circularity (ImageJ) of 200 nuclei for each condition. *P < 1e-4, one-way ANOVA. (f) Representative images of RPE-1 cells in lipid-depleted media treated with 250 nM Torin, 10 µM TOFA, 10 µM cerulenin, 40 µM C75, or 1 µM lovastatin cells for 24 h. Blue, Hoechst 33342 (DNA); green, anti-lamin B1 (NE). Scale bar, 5 µm. (g) Circularity (ImageJ) of 200 nuclei for each condition in Fig. 5 f. *P < 1e-4, one-way ANOVA. (h) FACS profiles of cells in each condition in Fig. 5 f.
Figure S3.
Figure S3.
Inhibition of SPT disrupts nuclear morphology in human cells. (a) Western blot of SPT subunits in RPE-1 upon their knockdown for 48 h. (b) Cell proliferation of RPE-1 upon knockdown of SPTLC1 or SPTLC2. Error bars represent standard deviations (n = 3). *P < 1e-4, one-way ANOVA. (c) FACS profiles of cells stained with BrdU upon knockdown of SPTLC1 or SPTLC2. (d) Schematic of target enzymes by the different drugs used in our experiments. (e) Representative images of RPE-1 cells in media containing 10% FBS in the presence of 250 nM Torin, 10 µM TOFA, 10 µM cerulenin, 40 µM C75, or 1 µM lovastatin. Blue, Hoechst 33342 (DNA); green, anti-lamin B1 (NE). Scale bar, 5 µm. (f) Circularity of 200 nuclei for each condition in Fig. S3 e. (g) FACS profiles of cells in each condition in Fig. S3 e. Source data are available for this figure: SourceData FS3.
Figure 7.
Figure 7.
LCBs are synthesized during S and G2 phases in human cells. (a) HPLC-MS/MS analysis of LCBs and ceramides of RPE-1 cell culture in 10% FBS. Error bars represent the standard deviation (n = 3 biological replicates, >106 cells analyzed in each experiment). (b) Representative images of RPE-1 cells in 10% FBS (Asynchronous, Asyn) or arrested in G1 with 2 µM palbociclib, in the S phase with 2 µM thymidine, or in late G2 with 10 µM RO-3306. Blue, Hoechst 33342 (DNA); and green, anti-lamin B1. Scale bar, 5 µm. FACS profiles are shown below. (c) Area of nuclei of RPE-1 cells (n = 200) as in b. The averaged calculated radius is shown below. *P < 1e-4, one-way ANOVA. (d) HPLC-MS/MS analysis of LCBs and ceramides in RPE-1 arrested as in b. Columns represent experiments (n = 3 biological replicates, >106 cells analyzed in each experiment), and rows represent lipid species. Cer, ceramide; dh, dihydro; DHS, dihydrosphingosine; Sph, sphingosine. (e) Average log2 ratios of the lipid levels in G1- or G2-arrested cells are shown. Error bars represent standard deviations (n = 3 biological replicates). (f) Representative images of RPE-1 cells in LD-FBS (Asynchronous, Asyn) or arrested in G1 with 2 µM palbociclib, in the S phase with 2 µM thymidine, or in late G2 with 10 µM RO-3306. Blue, Hoechst 33342 (DNA); and green, anti-lamin B1. Scale bar, 5 µm. FACS profiles are shown below. (g) Area of nuclei of RPE-1 cells (n = 200 nuclei) as in f. The averaged calculated radius is shown below. Nuclei with abnormal morphology are not included in G2 arrest. *P < 1e-4, one-way ANOVA. (h) Percentage of cells with abnormal nuclear morphology. Error bars represent the standard deviation of 3 biological replicates (each replicate, n >100 cells). *P < 1e-4, unpaired t test. (i) HPLC-MS/MS analysis of LCBs and ceramides in RPE-1 arrested as in f. Log2 ratios of the lipid levels relative to asynchronous cells are shown. Columns represent experiments, and rows represent lipid species. Cer, ceramide; dh, dihydro; DHS, dihydrosphingosine; Sph, sphingosine. Scale bar, 5 µm. (j) Quantification of total LCBs and ceramides in G1- or G2-arrested RPE-1 cells in LD-FBS. Error bars represent the standard deviations (n = 3 biological replicates). (k) Representative images of RPE-1 cells in lipid-depleted media arrested in G2 in the presence of 1 µM Sph. Blue, Hoechst 33342 (DNA); and green, anti-lamin B1. Scale bar, 5 µm. (l) Percentage of cells with abnormal nuclear morphology. Error bars represent the standard deviation of three independent biological replicates (each replicate, n > 100 cells). Cells were arrested in G2 alone or with 1 µM DHS, 1 µM Sph, or 1 µM ceramide. *P < 1e-4, one-way ANOVA. HPLC-MS/MS, high-performance liquid chromatography–tandem mass spectrometry.
Figure S4.
Figure S4.
LCBs are synthesized during S and G2 phases in human cells. (a) Sphingolipid synthesis pathway in human cells showing the levels of lipid molecules measured by mass spectroscopy in 106 cells. (b) Gene expression of the enzymes involved in de novo synthesis of sphingolipids in RPE-1 cells. (c) Representative immunofluorescence images of RPE-1 cells upon knockdown of scramble sequence (Control), SPTLC1, or SPTLC2. Green, phalloidin staining of f-actin; purple, Hoechst 33342 (DNA); and red anti-lamin B1.
Figure 8.
Figure 8.
Abnormal nuclear morphology upon SPT inhibition arises following cell division. (a) Proliferation of RPE-1 cells in the medium with 10% FBS or LD-FBS without or with 5 µM myriocin for 48 h. Cell numbers were quantified with a Coulter counter. Error bars represent the standard deviation (n = 3 biological replicates). NS, P > 0.05. (b) Transcriptome profile of RPE-1 cell culture in 10% FBS or LD-FBS. The number of genes upregulated in LD-FBS compared with FBS media includes every enzyme in the cholesterol biosynthesis pathway. (c) Transcriptome profile of RPE-1 cells cultured in LD-FBS without and with 5 µM myriocin for 24 h. No significant enrichment of gene ontology terms found in the genes up- or downregulated. (d) Time lapse of live-cell microscopy images of RPE-1 expressing GFP-histone H2B in LD-FBS. Scale bar = 10 µm. (e) Time lapse of live-cell microscopy images of RPE-1 expressing GFP-histone H2B in LD-FBS in the presence of 5 µM myriocin for 20 h. Scale bar = 10 µm. (f) Quantification of the circularity of the nuclei of daughter cells 2 h after metaphase was observed in control cells or cells treated with 5 µM myriocin for 20 h. See Videos 1 and 2. n > 30, *P < 0.05, unpaired t test. (g) Time-lapse images of RPE-1 cells using a Nanolive microscope in LD-FBS without and with 5 µM myriocin for 20 h. The nuclear shape of the daughter cell is highlighted in the 60-min time point by a white line contour. Scale bar = 20 µm. See Videos 3 and 4.
Figure 9.
Figure 9.
Lack of LCBs causes genomic instability. (a) Representative immunofluorescence images of RPE-1 cells upon knockdown of scramble (Control), SPTLC1, or SPTLC2 cultured for 96 h, or treated with 5 µM myriocin or 10 µM fumonisin B1 in lipid-depleted medium for 48 h. Green, anti-alpha-tubulin; purple, Hoechst 33342 (DNA); and red, anti-lamin B1. Scale bar, 5 µm. Some images are also shown in Fig. S4 c. (b) Quantification of cells with micronuclei. Error bars represent the standard deviation of three biological replicates (each replicate, n > 100 cells). *P < 1e-4, one-way ANOVA. (c) Representative immunofluorescence image of RPE-1 nuclei showing NE blebs upon knockdown of SPTLC1 or SPTLC2. Scale bar, 5 µm. (d) Representative immunofluorescence image of RPE-1 cells with an anaphase bridge upon knockdown of SPTLC1 or SPTLC2. Scale bar, 5 µm. (e) Quantification of cells with nuclear blebs. Error bars represent the standard deviation of three biological replicates (each replicate, n > 100 cells). *P < 1e-4, one-way ANOVA. (f) Quantification of cells with anaphase bridge. Error bars represent the standard deviation of 3 biological replicates (each replicate, n > 100 cells). *P < 1e-4, one-way ANOVA. (g) Representative immunofluorescence images of RPE-1 cells 45 min after release from a G2 arrest. Green, anti-gamma-tubulin; blue, Hoechst 33342 (DNA); and red, anti-CDK5RAP2 (centrosome). Scale bar, 5 µm. (h and i) Quantification of cells with misaligned chromosomes (h) or multipolar spindle (i). Error bars represent the standard deviation of three biological replicates (each replicate, n > 100 cells). *P < 1e-3, one-way ANOVA.
Figure S5.
Figure S5.
Lack of LCB causes genomic instability. (a) Western blot of SPT subunits in HeLa cells upon their knockdown. (b) Quantification of mitotic events in HeLa cells upon SPTLC1 or SPTLC2 knockdowns. Error bars represent the standard deviation of three biological replicates. (c) Representative images highlighting chromosome missegregation events in HeLa cells upon knockdown of SPTLC1 or SPTLC2. Quantification of the phenotypes is shown on the right. Source data are available for this figure: SourceData FS5.
Figure 10.
Figure 10.
Centrosome position is affected by lowering the levels of LCBs. (a) Representative immunofluorescence images of RPE-1 cells upon knockdown of scramble (Control), SPTLC1, or SPTLC2 cultured for 96 h, or treated with 5 µM myriocin or 10 µM fumonisin B1 in lipid-depleted medium for 48 h. Green, anti-alpha-tubulin; purple, Hoechst 33342 (DNA); and red, anti-lamin B1. Scale bar, 5 µm. (b) Quantification of yH2AX in RPE-1 cells upon knockdown of scramble (Control), SPTLC1, or SPTLC2. N = 5 western blots, NS, P > 5 e-2, one-way ANOVA. (c) Representative immunofluorescence images of RPE-1 cells with BRCA1 deletion (left) showing increased 53BP1 foci (red). RPE-1 cells cultured in LD-FBS (middle) or arrested in G2 in LD-FBS with abnormal nuclear morphology (right) do not show 53BP1 foci. Scale bar, 5 µm. (d) Quantification of cells shown 53BP1 foci (n > 200). (e) Representative immunofluorescence images of RPE-1 cells upon knockdown of scramble (Control), SPTLC1, or SPTLC2 cultured for 96 h. Scale bar, 10 µm. (f) Quantification of the centrosome distance to the NE in RPE-1 cells. *P < 1 e-4, one-way ANOVA. (g) Representative immunofluorescence images of RPE-1 cells treated with 5 µM myriocin, 40 µM C75, 10 µM TOFA, 10 µM cerulenin, or 1 µM lovastatin cells for 24 h. Scale bar, 10 µm. (h) Quantification of the centrosome distance to the NE in RPE-1 cells. *P < 1e-4, one-way ANOVA. NS, P > 0.05.

References

    1. Aganezov, S., Yan S.M., Soto D.C., Kirsche M., Zarate S., Avdeyev P., Taylor D.J., Shafin K., Shumate A., Xiao C., et al. 2022. A complete reference genome improves analysis of human genetic variation. Science. 376:eabl3533. 10.1126/science.abl3533 - DOI - PMC - PubMed
    1. Alvarez-Vasquez, F., Sims K.J., Cowart L.A., Okamoto Y., Voit E.O., and Hannun Y.A.. 2005. Simulation and validation of modelled sphingolipid metabolism in Saccharomyces cerevisiae. Nature. 433:425–430. 10.1038/nature03232 - DOI - PubMed
    1. Atilla-Gokcumen, G.E., Muro E., Relat-Goberna J., Sasse S., Bedigian A., Coughlin M.L., Garcia-Manyes S., and Eggert U.S.. 2014. Dividing cells regulate their lipid composition and localization. Cell. 156:428–439. 10.1016/j.cell.2013.12.015 - DOI - PMC - PubMed
    1. Bielawski, J., Pierce J.S., Snider J., Rembiesa B., Szulc Z.M., and Bielawska A.. 2009. Comprehensive quantitative analysis of bioactive sphingolipids by high-performance liquid chromatography-tandem mass spectrometry. Methods Mol. Biol. 579:443–467. 10.1007/978-1-60761-322-0_22 - DOI - PubMed
    1. Blank, H.M., Perez R., He C., Maitra N., Metz R., Hill J., Lin Y., Johnson C.D., Bankaitis V.A., Kennedy B.K., et al. 2017. Translational control of lipogenic enzymes in the cell cycle of synchronous, growing yeast cells. EMBO J. 36:487–502. 10.15252/embj.201695050 - DOI - PMC - PubMed

MeSH terms

Substances

LinkOut - more resources