. 2025 Jul 3;230(6):110.
doi: 10.1007/s00429-025-02976-8.

Individual uniqueness of connectivity gradients is driven by the complexity of the embedded networks and their dispersion

Affiliations

Individual uniqueness of connectivity gradients is driven by the complexity of the embedded networks and their dispersion

Yvonne Serhan et al. Brain Struct Funct. .

Abstract

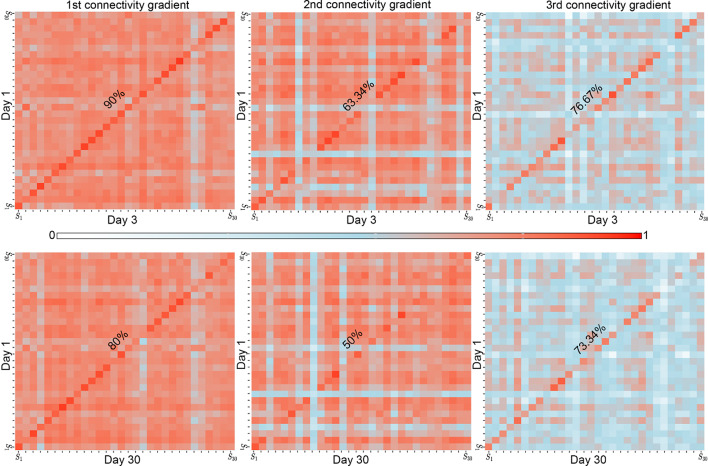
Connectivity gradients are widely used to characterize meaningful principles of functional brain organization in health and disease. However, the degree of individual uniqueness and shared common principles is not yet fully understood. Here, we leveraged the Hangzhou test-retest dataset, comprising repeated resting-state fMRI scans over the span of 1 month, to investigate the balance between individual variation and shared patterns of brain organization. We quantified the short- and long-term stability for the first three connectivity gradients and used connectome fingerprinting to establish the associated individual identification rate. We found that all three connectivity gradients are highly correlated over both short and long time intervals, demonstrating connectome fingerprinting utility. Individual uniqueness was dictated by the complexity of the networks such that heteromodal networks had higher connectome fingerprinting rates than unimodal networks. Importantly, the dispersion of the gradient coefficients associated with canonical functional networks was correlated with identification rates, irrespective of the position along the gradients. Beyond individual uniqueness, between subject similarity was high along the first connectivity gradient, which captures the dissociation between unimodal and heteromodal cortices, and the second connectivity gradient, which differentiates sensory cortices. Our results support the usage of connectivity gradients for the purposes of both group comparisons and prediction of individual behaviours. Our work adds to existing knowledge on the shared versus unique organizational principles and offers insights into the importance of network dispersion to the individual uniqueness it carries.

Keywords: Connectome fingerprinting; Dimensionality reduction; Identity analysis; Resting-state fMRI; Test-retest similarity.


Conflict of interest statement

Declarations. Competing interests: The authors declare no competing interests.

Figures

Fig. 1
Fig. 1
Connectivity gradients represent a continuum based on similarity of functional connectivity patterns. a Average gradient coefficient score values for all subjects for each vertex, color coded according to Yeo’s parcellation (Thomas Yeo et al. 2011). Along the first connectivity gradient (x-axis), a hierarchical gradient is captured such that default-mode network (DMN) is on the one end and sensorimotor network (SMN) and visual network (VN) are on the other end. Along the second connectivity gradient (y-axis) VN is distinguished from the SMN and most other networks. b Along the third connectivity gradient (y-axis), fronto-parietal network (FPN), dorsal attention network (DAN), and salience network (SN) are on the one end and DMN is on the other end. Different functional networks are represented in different locations along the different gradients, and each gradient captures a different representation. Along the different gradients, networks can change their dispersion of coefficient values. c Example data from an individual subject scanned over time. Connectivity space is represented along the first and second connectivity gradients (left), and along the first and third connectivity gradients (right). The general structure captured in the connectivity space is retained showcasing stability, yet slight changes are still evident over time
Fig. 2
Fig. 2
Connectivity gradients are stable within individuals over short and long-term intervals. a Pearson’s correlation coefficient values for connectivity gradients across subjects’ data pairs. Along the diagonal, all three gradients show ‘high’ correlation values (mean r values > 0.79), indicating high stability within subjects. In the identification analysis, the first gradient demonstrates the highest accuracy rates with 90% for Day 1–Day 3, and 80% for Day 1–Day 30. The second gradient showed slightly lower accuracies: 63.34% for Day 1–Day 3, and 50% for Day 1–Day 30. The third gradient shows accuracies of 76.67% for Day 1–Day 3, and 73.34% for Day 1–Day 30. Connectivity gradients are therefore individually unique in both short and long-term intervals for all three connectivity gradients
Fig. 3
Fig. 3
Within/between correlation values for the three connectivity gradients over short and long intervals. a Average Pearson’s correlation values for short-term (day 1–day 3) and long-term (day 1–30 days) sessions across the first, second, and third gradients, within (plain) and between (dotted) subjects. Bars represent mean values with standard error. Between subjects’ correlation values are lower than within subjects’ correlation values yet are high along the first and second connectivity gradients and moderate along the third connectivity gradient. Within subjects’ correlation values are high along all three gradients and time intervals. b Within-to-between ratio distributions for short and long intervals across gradients. Violin plots display the distribution, box plots show the median and interquartile range, and whiskers represent variability. A value above 1 indicates higher correlation values for within-subject correlations compared to between-subject correlations. All three gradients show a mean ratio above 1. Significant differences were found between the first and third gradient and between the second and the third gradient
Fig. 4
Fig. 4
Networks of higher complexity show higher accuracies in individual identification analysis. Accuracy rates for short-term (dashed bars) and long-term (plain bars) sessions across different brain networks for the first three connectivity gradients (left). Box plots comparing accuracy rates for heteromodal (HETERO) and unimodal networks (UNI) (right). a Accuracy rates for Yeo parcellation, including the Dorsal Attention Network (DAN), Frontoparietal Network (FPN), Default-mode Network (DMN), Salience Network (SN), Somatomotor Network (SMN), and Visual Network (VN). b Accuracy rates for Cole parcellation, incorporating the Cingulo-Opercular Network (CON), Language Network (LAN), Posterior Multimodal (PMM), Visual 2 (VIS2), Visual 1 (VIS1), and Auditory Network (AUD). Along the first and third gradients, networks of higher complexity show consistently higher rates of individual fingerprinting. Interestingly, along the second connectivity gradient, the visual network achieves high accuracy, but there is no significant difference between unimodal and heteromodal networks. A closer look shows that accuracy is slightly higher on VIS2, which represents higher-order visual areas, with less contribution from VIS1, representing low-order visual areas
Fig. 5
Fig. 5
Identity accuracies in networks positively correlate with their dispersion along the gradients and time intervals. Each point represents a network’s mean dispersion along one of the first three connectivity gradients (G1–G3; denoted by marker shape) and its identification accuracy a Yeo parcellation; b Cole parcellation. Left panels show short-term accuracy (Day 1–Day 3) and corresponding average dispersion; right panels show long-term accuracy (Day 1–Day 30) and corresponding average dispersion. Each scatterplot presents a linear fit (black line) with 95% confidence interval (shaded area). Correlation values (Pearson’s r) and Bonferroni-corrected p values are reported within each panel. In both parcellations, higher network dispersion is associated with higher accuracy rates, indicating that a broader range of connectivity leads to a more predictive network of individually unique organization. Brain maps illustrate corresponding networks for each parcellation

Similar articles

References

    1. Adelstein JS, Shehzad Z, Mennes M, DeYoung CG, Zuo X-N, Kelly C, Margulies DS, Bloomfield A, Gray JR, Castellanos FX, Milham MP (2011) Personality is reflected in the brain’s intrinsic functional architecture. PLoS ONE 6(11):e27633. 10.1371/journal.pone.0027633 - PMC - PubMed
    1. Bayrak Ş, Khalil AA, Villringer K, Fiebach JB, Villringer A, Margulies DS, Ovadia-Caro S (2019) The impact of ischemic stroke on connectivity gradients. NeuroImage Clin 24(April):101947. 10.1016/j.nicl.2019.101947 - PMC - PubMed
    1. Bernhardt BC, Smallwood J, Keilholz S, Margulies DS (2022) Gradients in brain organization. NeuroImage 251:118987. 10.1016/j.neuroimage.2022.118987 - PubMed
    1. Bertolero MA, Yeo BTT, Bassett DS, D’Esposito M (2018) A mechanistic model of connector hubs, modularity and cognition. Nat Hum Behav 2(10):765–777. 10.1038/s41562-018-0420-6 - PMC - PubMed
    1. Bethlehem RAI, Paquola C, Seidlitz J, Ronan L, Bernhardt B, Consortium C-C, Tsvetanov KA (2020) Dispersion of functional gradients across the adult lifespan. NeuroImage, 222, 117299. 10.1016/j.neuroimage.2020.117299 - PMC - PubMed

LinkOut - more resources