

Decomposition of driving factors and peak prediction of carbon emissions in key cities in China
- PMID: 40608212
- PMCID: PMC12225531
- DOI: 10.1186/s13021-025-00310-7
Decomposition of driving factors and peak prediction of carbon emissions in key cities in China
Abstract
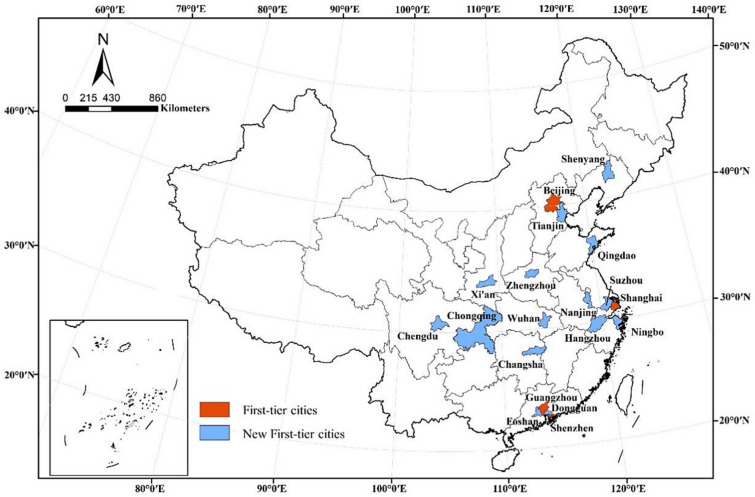
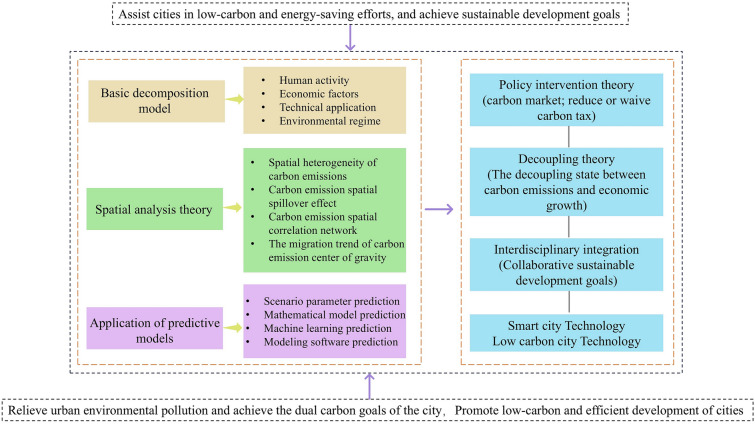
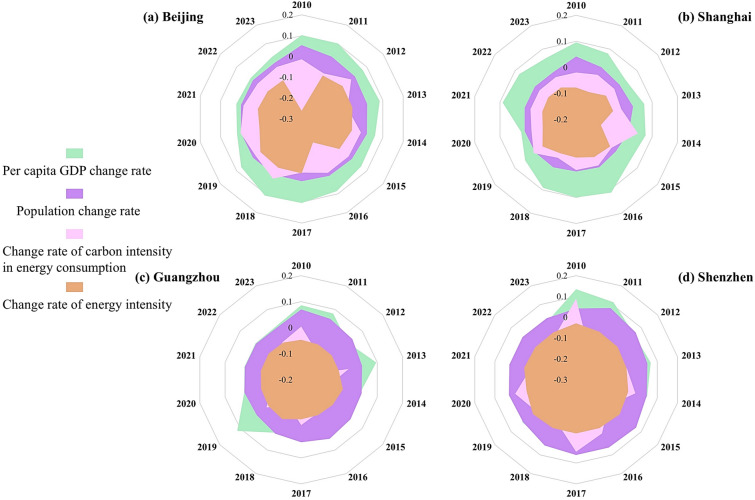
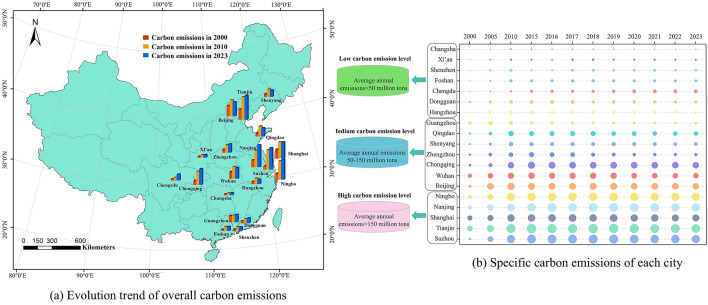
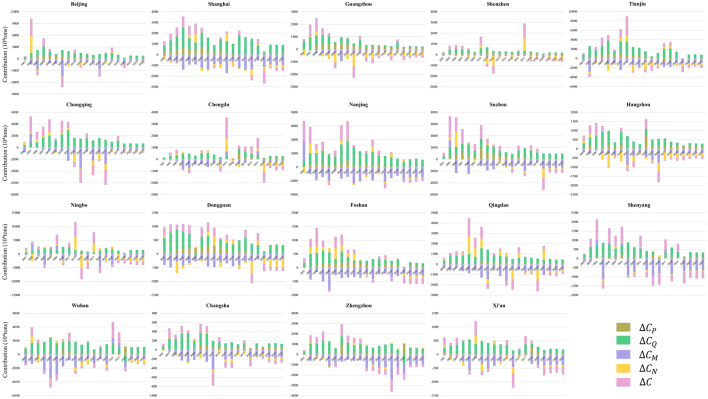
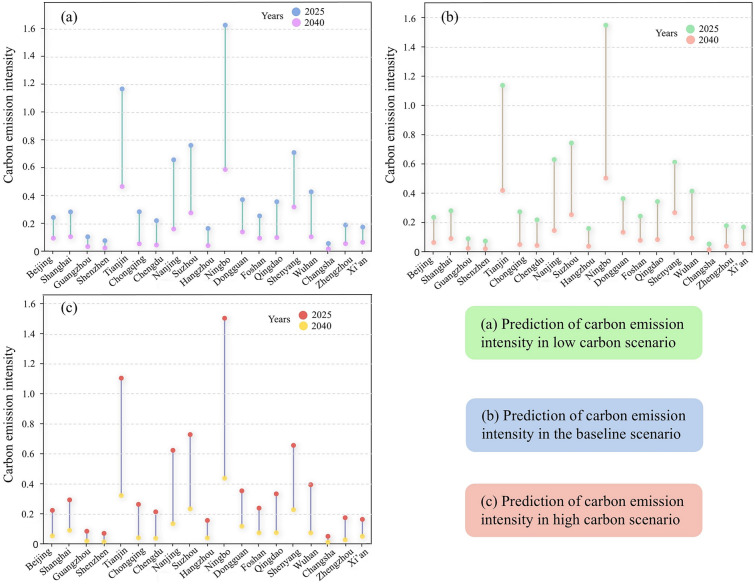
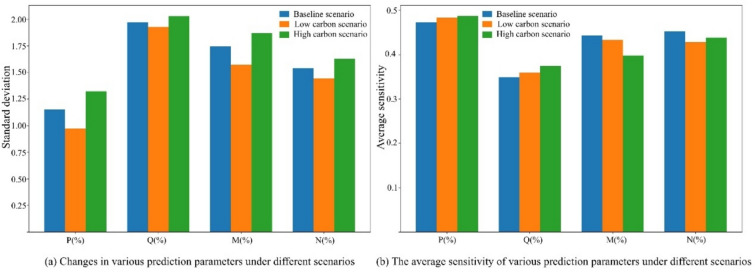
Urban areas are pivotal contributors to carbon emissions, and achieving carbon peaking at the urban level is crucial for meeting national carbon reduction targets. This study estimates the carbon emissions and intensity changes of 19 cities from 2000 to 2023 using urban statistical data. By employing the logarithmic mean Divisia index (LMDI) method, the driving factors of carbon emissions across these cities are analyzed. Additionally, a multi-scenario prediction approach is utilized to forecast the timing of carbon peaking and trends in carbon emission intensity under various scenarios. The findings reveal that, during the study period, carbon emissions exhibited an overall upward trend, while carbon emission intensity demonstrated a year-by-year decline. The population effect and per capita GDP effect were identified as significant drivers of urban carbon emissions during urban development. Conversely, reducing energy intensity and the carbon intensity of energy consumption can effectively curb the growth of carbon emissions. Under the low-carbon scenario, all cities are projected to achieve carbon peaking before 2030. In the baseline scenario, the vast majority of cities (89.47%) are expected to reach carbon peaking before 2030. However, under the high-carbon scenario, only 63.16% of cities are anticipated to achieve carbon peaking by the same deadline.
Keywords: Carbon emission; Carbon emission intensity; LMDI; Scenario prediction.
© 2025. The Author(s).
Conflict of interest statement
Declarations. Ethics approval and consent to participate: Not applicable. Consent for publication: Not applicable. Competing interests: The authors declare no competing interests.
Figures


Similar articles
-
Decomposition of drivers and identification of decoupling states for the evolution of carbon emissions from energy consumption in China.Environ Sci Pollut Res Int. 2023 Jun;30(30):75629-75654. doi: 10.1007/s11356-023-27745-0. Epub 2023 May 24. Environ Sci Pollut Res Int. 2023. PMID: 37222887
-
[Spatio-temporal Correlation Between Green Space Landscape Pattern and Carbon Emission in Three Major Coastal Urban Agglomerations].Huan Jing Ke Xue. 2025 Jun 8;46(6):3509-3523. doi: 10.13227/j.hjkx.202403256. Huan Jing Ke Xue. 2025. PMID: 40582792 Chinese.
-
[Carbon Peak Prediction of Energy Consumption in China: Based on STIRPAT Extended Model].Huan Jing Ke Xue. 2025 Jul 8;46(7):4052-4064. doi: 10.13227/j.hjkx.202406016. Huan Jing Ke Xue. 2025. PMID: 40677029 Chinese.
-
Intravenous magnesium sulphate and sotalol for prevention of atrial fibrillation after coronary artery bypass surgery: a systematic review and economic evaluation.Health Technol Assess. 2008 Jun;12(28):iii-iv, ix-95. doi: 10.3310/hta12280. Health Technol Assess. 2008. PMID: 18547499
-
A rapid and systematic review of the clinical effectiveness and cost-effectiveness of paclitaxel, docetaxel, gemcitabine and vinorelbine in non-small-cell lung cancer.Health Technol Assess. 2001;5(32):1-195. doi: 10.3310/hta5320. Health Technol Assess. 2001. PMID: 12065068
References
-
- Huang H, Wei Z, Ge Q, et al. Analysis of spatial-temporal evolution and influencing factors of carbon emission efficiency in Chinese cities. Front Environ Sci. 2023;11:310.
-
- Zhang E, He X, Xiao P. Does Smart City construction decrease urban carbon emission intensity? Evidence from a difference-in-difference estimation in China. Sustainability. 2022;14(23):16097–16097.
LinkOut - more resources
Full Text Sources
