Comparative Study
. 2025 Jul 3;135(17):e194586.
doi: 10.1172/JCI194586. eCollection 2025 Sep 2.

Marburg virus glycoprotein mRNA vaccine is more protective than a virus-like particle-forming mRNA vaccine

Affiliations
Comparative Study

Marburg virus glycoprotein mRNA vaccine is more protective than a virus-like particle-forming mRNA vaccine

Chandru Subramani et al. J Clin Invest. .

Abstract

Although virus-like particle (VLP) vaccines were shown to be effective against several viruses, their advantage over vaccines that include envelope protein only is not completely clear, particularly for mRNA-encoded VLPs. We conducted a side-by-side comparison of the immunogenicity and protective efficacy of mRNA vaccines encoding the Marburg virus (MARV) full-length glycoprotein (GP) delivered alone or as a VLP. Electron microscopy confirmed VLP formation when MARV GP and matrix protein VP40 were coexpressed. We vaccinated guinea pigs with a 2-component mRNA vaccine encoding GP and VP40 (VLP) or GP alone. At the highest dose, both vaccines protected fully, although the VLP vaccine elicited a slightly lower humoral response than did the GP-only mRNA vaccine. However, at low doses, GP-only mRNA conferred 100% protection, whereas the VLP vaccine conferred only partial protection. In mice, VLP mRNA induced a moderate preference for GP-specific CD8+ T cell responses, whereas the GP-only mRNA somewhat favored CD4+ T cell responses. Guinea pig whole-blood RNA-Seq revealed that the VLP vaccine downregulated genes associated with various biological and metabolic processes, including the NF-κB signaling pathway, whereas the GP-only vaccine upregulated IFN signaling. Overall, the VLP mRNA vaccine was less immunogenic and protective, whereas the GP-only mRNA vaccine conferred robust protection with a dose of as little as 1 μg in guinea pigs.

Keywords: Cellular immune response; Immunoglobulins; Infectious disease; Vaccines; Virology.


Conflict of interest statement

Conflict of interest: SH and AC are employees of Moderna Inc.

Figures

Figure 1
Figure 1. Optimization of MARV VLP generation from GP and VP40 mRNA in HEK293T cells.
(A) Schematic of MARV GP and VLP mRNA LNP vaccines. Schematic was created with BioRender. (B) Immunoblots of GP and VP40 mRNA–transfected HEK293T cell lysates. (C) Immunoblots of GP and VP40 for the sucrose cushion concentrated VLPs. (D and E) The indicated concentrations of GP mRNA (μg) were transfected with VP40 mRNA in HEK293T cells to determine the optimal ratio for VLP generation. Immunoblots of cell lysates (D) and VLPs (E). GAPDH was used as a loading control. (F and G) Comparison of the intensity of GP and VP40 bands in the blots in D and E. Molecular weights in kDa are shown at the left.
Figure 2
Figure 2. Electron microscopy of MARV VLPs.
(A) HEK293T cells transfected with GP mRNA (control). The arrow indicates a membrane protrusion. Scale bar: 0.2 μm. (B) VLPs in HEK293T cells transfected with GP and VP40 mRNA. The arrows indicate VLP structures. Scale bars: 0.2 μm. (C) Negative staining of VLPs. Scale bar: 0.10 μm (D) Immunogold and negative staining of VLPs. The arrows indicate gold nanoparticle deposition. Scale bar: 0.10 μm.
Figure 3
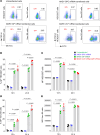
Figure 3. Comparison of surface staining of membrane-bound GP protein levels in mRNA-transfected cells.
(A) Representative flow cytometry plots for a 24-hour incubation. (B) Percentages of GP+ HEK293T cells. (C) MFI of GP+ HEK293T cells. (D) Percentages of GP+ Vero E6 cells. (E) MFI of GP+ Vero E6 cells. Data are presented as the mean ± SEM. Statistical significance was calculated by 1-way ANOVA analysis followed by Tukey’s multiple-comparison test.
Figure 4
Figure 4. Assessment of MARV GP and VLP mRNA vaccines in guinea pig study 1: immunogenicity.
(A) Study design: guinea pigs (n = 5) were vaccinated with GP mRNA (green) or VLP mRNA (red) via the intramuscular route on days 0 and 29. Serum samples were collected on days 27 and 54. On day 56, guinea pigs were challenged with guinea pig–adapted MARV, and serum samples were collected on the indicated days for viremia analysis. The study was terminated on post-challenge day 28. Schematic was created with BioRender. (B) MARV GP-specific ELISA absorbance values. (C) GP IgG antibody titers. (D) MARV VP40-specific binding ELISA absorbance values. (E) VP40 IgG antibody titers. (F) MARV-neutralizing antibody responses expressed as a percentage of the plaque count reduction. (G) PRNT60 titer. Data are presented as the median and IQR (BG). Statistical significance was calculated by Kruskal-Wallis analysis followed by Dunn’s multiple-comparison test (C, E, and G).
Figure 5
Figure 5. Assessment of MARV GP and VLP mRNA vaccines in guinea pig study 1: protective efficacy.
(A) Survival curve. (B) Body weight percentage change. (C) Disease score. (D) Viremia. (EG) Viral load in the spleen, liver, and kidneys, respectively. Data are presented as individual values (A, C, and D) and the median and IQR (B, EG). The log-rank (Mantel-Cox) test was used to analyze survival data. Statistical significance was calculated by 2-way ANOVA followed by Dunnett’s multiple-comparison test (B) and the Kruskal-Wallis test followed by Dunn’s multiple-comparison test (EG). #Same P value for all vaccinated groups versus NTFIX (control).
Figure 6
Figure 6. Assessment of MARV GP and VLP mRNA vaccines in guinea pig study 2: immunogenicity.
(A) Study design: guinea pigs (n = 5) were vaccinated with GP mRNA (green) or VLP mRNA (red). Study 2 was conducted as described in study 1. Schematic was created with BioRender. (B and C) MARV GP–specific ELISA absorbance values. (D) GP IgG antibody titers. (E and F) MARV VP40–specific binding ELISA absorbance values. (G) VP40 IgG antibody titers. (H and I) MARV-neutralizing antibody responses expressed as a percentage of the plaque count reduction. (J) PRNT60 titer. Data are represented as the median and IQR (B–J). Statistical significance was calculated by Kruskal-Wallis analysis followed by Dunn’s multiple-comparison test (D, G, and J).
Figure 7
Figure 7. Assessment of MARV GP and VLP mRNA vaccines in guinea pig study 2: protective efficacy.
(A) Guinea pig survival curve. (B and C) Percentage of body weight change. (D) Disease score. (E) Viremia. (FH) Viral load in the spleen, liver, and kidneys, respectively. Data are represented as individual values (AE) and the median and IQR (FH). The log-rank (Mantel-Cox) test was used to analyze the survival data. Statistical significance was calculated by 2-way ANOVA followed by Dunnett’s multiple-comparison test (B) and the Kruskal-Wallis test followed by Dunn’s multiple-comparison test (FH). #Same P value for all vaccinated groups versus the PBS control; otherwise, the specific P values are indicated.
Figure 8
Figure 8. Histopathology of liver and spleen tissues from control and vaccinated groups from the dose-down study.
Liver and spleen tissues collected from the guinea pigs were stained with H&E. #For the VLP group (1.33 μg and 4 μg), the images represent the guinea pigs that succumbed to infection. Scale bars: 100 μm. (A) Control liver section shows the following characteristics: apoptosis/necrosis (red asterisks), hepatocellular vacuolation (red arrow), and councilman-like bodies (black arrows). (B–D) Liver sections from the indicated vaccine groups. (E) The control spleen section shows apoptosis/necrosis in the red pulp (red star) and lymphocyte depletion in the white pulp (blue arrow). (FH) Spleen sections from the indicated vaccine groups.
Figure 9
Figure 9. MARV GP–specific T cell responses to GP and VLP mRNA vaccines.
(A) Study design: 6- to 7-week-old female BALB/c mice (n = 5) were vaccinated with GP mRNA (green) or VLP mRNA (red) via the intramuscular route on days 0 and 29. Control mice received PBS (black). Spleens were collected and processed to isolate splenocytes. Splenocytes were stimulated with DMSO or GP-peptide pool to measure GP-specific CD4+ and CD8+ T cells by flow cytometry. Schematic was created with BioRender. (B) Percentages of the indicated cell populations. (C) Percentages of total CD4+ T cells producing the indicated cytokines. Each bar indicates the value for the individual percentage of CD4+ T cells for each mouse. (D) Percentages of total CD8+ T cells producing the indicated cytokines. Each bar indicates the value for the individual percentage of CD8+ T cells for each mouse. Data are presented as the median and IQR (BG) and values for individual animals (C and D). Statistical significance was calculated by Kruskal-Wallis analysis followed by Dunn’s multiple-comparison test (BG).
Figure 10
Figure 10. GP mRNA vaccine induces minimal changes in the guinea pig whole blood transcriptome compared with the VLP mRNA vaccine.
(A) PCA of genes expressed in the control and vaccinated groups. (B) Total number of up- and downregulated genes in the whole blood of vaccinated groups versus PBS. The graph shows genes with a log2(fold change) of 1 or greater and an adjusted P value of 0.05 or less. (C) Functional enrichment analysis of significantly differentially expressed genes. Arrows pointing up or down indicate up- and downregulated genes, respectively. (D) Venn diagram of overlapping genes between GP and VLP mRNA–vaccinated groups versus PBS. (E) List of overlapping genes between the GP and VLP mRNA–vaccinated groups versus PBS with log2(fold change) values.
Figure 11
Figure 11. Vaccinated guinea pig groups show reduced expression of antiviral response genes compared with the unvaccinated group.
(A) PCA of genes expressed in control and vaccinated groups. The 2 outlier samples from the control group were removed for better visualization. (B) Total numbers of up- and downregulated genes in the whole blood of vaccinated groups versus PBS treatment. The graph shows genes with a log2(fold change) of 1 or greater and an adjusted P value of 0.05 or less. (C) Venn diagram showing the intersection of overlapping downregulated genes among all vaccinated groups versus PBS. The numbers in parentheses indicate the total number of genes in the indicated group. The numbers in parentheses indicate the total number of genes in the indicated group. (D) Functional enrichment analysis of overlapping downregulated genes. (E) Genes related to the immune response and apoptosis with log2(fold change) values.

References

    1. Srivastava S, et al. Emergence of Marburg virus: a global perspective on fatal outbreaks and clinical challenges. Front Microbiol. 2023;14:1239079. doi: 10.3389/fmicb.2023.1239079. - DOI - PMC - PubMed
    1. Sibomana O, Kubwimana E. First-ever Marburg virus disease outbreak in Equatorial Guinea and Tanzania: an imminent crisis in West and East Africa. Immun Inflamm Dis. 2023;11(8):e980. doi: 10.1002/iid3.980. - DOI - PMC - PubMed
    1. Sidik S. Lethal Marburg virus is on the rise in Rwanda: why scientists are worried. Nature. 2024;634(8034):522–523. doi: 10.1038/d41586-024-03275-8. - DOI - PubMed
    1. CDC. Marburg Outbreak in Rwanda Situation Summary. https://www.cdc.gov/marburg/situation-summary/index.html Updated December 2, 2024. Accessed July 10, 2025.
    1. WHO. Marburg virus disease – United Republic of Tanzania. https://www.who.int/emergencies/disease-outbreak-news/item/2025-DON559 Updated March 13, 2025. Accessed July 10, 2025.

Publication types

MeSH terms