. 2025 Jul 3;20(7):e0326373.
doi: 10.1371/journal.pone.0326373. eCollection 2025.

Galectin-3 inhibition ameliorates hepatic steatosis in a multilineage 3D spheroid model

Affiliations

Galectin-3 inhibition ameliorates hepatic steatosis in a multilineage 3D spheroid model

Francesca Sedda et al. PLoS One. .

Abstract

Background: Metabolic dysfunction-associated steatotic liver disease (MASLD) is the leading cause of chronic liver disease, and liver-related morbidity and mortality worldwide. MASLD is a multifactorial condition, which still needs to be completely understood. Galectin 3 (Gal-3) is up-regulated in several liver disorders suggesting its implication in the mechanisms underlying liver damage.

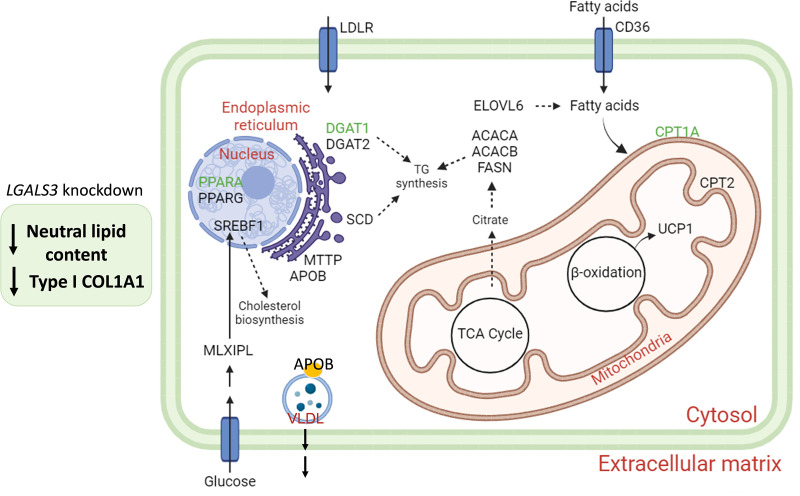
Methods: A human multilineage 3D model was utilized to investigate the role of Gal-3 in MASLD development. Human hepatoma cell line (HepG2) and human stellate cell line (LX-2) were co-cultured in a physiological ratio of 24:1 and treated with a mixture of palmitic and oleic acid (PAOA, ratio 1:2) to induce hepatocyte steatosis and facilitate the development of fibrosis. While the effect of LGALS3 silencing on neutral fat content was assessed by Oil-Red-O (ORO) staining, type I collagen production was analysed by immunofluorescent staining for collagen type I alpha 1 (COL1A1).

Results: Gal-3 depletion caused a reduction of neutral lipid content and COL1A1 accumulation in 3D spheroids. While LGALS3 silencing did not significantly alter the respiratory state, analysis of genes involved in lipid metabolism demonstrated significant changes in genes involved in β-oxidation and triglyceride synthesis.

Conclusion: These results suggest a role of Gal-3 in the regulation of fatty acid and collagen accumulation, thereby indicating that approaches aimed at inhibiting Gal-3 may represent a promising therapeutic strategy in MASLD.


Conflict of interest statement

The authors declare that the research was conducted in the absence of any commercial or financial relationships that could be construed as a potential conflict of interest.

Figures

Fig 1
Fig 1. Cell viability is not affected following LGALS3 silencing.
A. LGALS3 mRNA expression levels in human hepatoma (HepG2, Huh7, Hep3B2) and hepatic stellate (LX-2) cell lines. All measurements were normalized to β-actin. Relative quantification was calculated by 2‐ΔΔCt method. Groups were compared by using one-way ANOVA followed by Tukey post hoc analysis. B. HepG2 cells viability was not modified in siRNA SCR and siRNA LGALS3 after 24, 48 or 72 hours of silencing. The viability was expressed as percentage normalized to the siRNA SCR, from the absorbance measured at 490 nm. C. Spheroids viability was not affected by the LGALS3 ablation. The viability was expressed as percentage of ATP normalized to the spheroids volume. The volume was determined by the following formula: 4/3 π r 3, where “r” was the mean of the long diameter and short diameter of the spheroid divided by two. Graphs represent N = 3 independent experiments. * p < 0.05, ** p < 0.01, *** p < 0.001, **** p < 0.0001. Bars represent mean ± SD. Abbreviations: SCR, scramble.
Fig 2
Fig 2. Effect of LGALS3 silencing on mitochondrial energetics.
Mitochondrial respiration rates of permeabilized siRNA SCR and siRNA LGALS3 HepG2 cells (0.5 ∙ 106 cells ml-1) obtained with intact cell (BR), malate and pyruvate (PN), permeabilized cell with digitonin (PL,N), OxPhos state with malate and pyruvate (PP), succinate (SP), uncoupled mitochondria to measure maximal electron transport chain capacity with CCCP (ET), rotenone (R), (ET-R) is contribution of the C-I on respiration of uncoupled mitochondria (ET) and also ET-R indicates the respiration rate difference between that indicated with ET and R, C-IV indicates the respiration rate difference between that with ascorbate plus TMPD and azide. Mitochondrial respiration rate data are mean ± SD.
Fig 3
Fig 3. LGALS3 silencing causes a significant reduction of the intracellular neutral lipid content.
A. qRT-PCR analysis of LGALS3 mRNA levels in HepG2 cells. Measurements were normalized to β-actin. Relative quantification was calculated by 2‐ΔΔCt method. B. Western Blot analysis showing Gal-3 levels in siRNA SCR and siRNA LGALS3 HepG2 cells. β-actin was used as loading control. C. Western blot quantification of Gal-3 related to the corresponding β-actin. D. Representative images (20x) from cells stained with ORO; nuclei were stained with Carazzi Hematoxylin. E. Quantification of intracellular ORO-stained area by ImageJ. Graphs represent N = 3 independent experiments. Unpaired t-test was performed to compare the two groups. ** p < 0.01, **** p < 0.0001. Bars represent mean ± SD. Abbreviations: SCR, scramble; ORO, Oil Red O.
Fig 4
Fig 4. LGALS3 silencing reduces the neutral fat accumulation in 3D spheroids.
A. LGALS3 mRNA levels in 3D spheroids composed of HepG2/LX-2 cells (ratio 24:1) treated with BSA 1% or a mix of palmitic acid and oleic acid 500 µM (1:2). β-actin was used as an endogenous control. Relative quantification was calculated by 2‐ΔΔCt method. B. qRT-PCR analysis of LGALS3 mRNA levels in siRNA SCR and siRNA LGALS3 groups. Measurements were normalized to β-actin. Relative quantification was calculated by 2‐ΔΔCt method. C. Western Blot analysis showing Gal-3 levels in siRNA SCR and siRNA LGALS3. β-actin was used as loading control. D. Western blot quantification of Gal-3 related to the corresponding β-actin. E. Representative images (20x) of spheroids sections stained with ORO; nuclei were stained with DAPI. E. Quantification of intracellular ORO-stained area by ImageJ. Graphs represent N = 3 independent experiments. Unpaired t-test was performed to compare the two groups. * p < 0.05, ** p < 0.01, **** p < 0.0001. Bars represent mean ± SD. Abbreviations: SCR, scramble; ORO, Oil red O; PAOA, palmitic acid + oleic acid (1:2).
Fig 5
Fig 5. LGALS3 silencing reduces collagen type I secretion.
A. Immunofluorescence staining of COL1A1 (red), DAPI (blue), and merged images of 3D spheroids (HepG2/LX-2, 24:1) treated with a mix of palmitic acid and oleic acid 500 µM (PAOA 1:2). B. Quantification of COL1A1 levels by ImageJ normalized to number of nuclei. Unpaired t-test was performed to compare the two groups. * p < 0.05. Bars represent mean ± SD. Graphs represent N = 3 independent experiments. Abbreviations: SCR, scramble; COL1A1, type I collagen; PAOA, palmitic acid + oleic acid (1:2).
Fig 6
Fig 6. Gene expression analysis of genes involved in A) lipid biosynthesis and storage, B) transport and C) β-oxidation.
Measurements were normalized to β-actin. Relative quantification was calculated by 2‐ΔΔCt method. Groups were compared using unpaired two-tailed Student’s t-test and. Graphs represent N = 3 independent experiments. Values are shown as mean ± standard deviation. * p < 0.05, ** p < 0.01 *** p < 0.001, **** p < 0.0001.
Fig 7
Fig 7. Summary representation of the effects of LGALS3 silencing on the main enzymes involved in lipid biosynthesis, storage, transport and
β-oxidation. The figure depicts the main genes involved in lipid biosynthesis, storage, transport and β-oxidation. Reduction in neutral lipid content and type I collagen production in 3D spheroids observed following LGALS3 knockdown was accompanied by a significant decrease in the mRNA levels of DGAT1, CPT1A and PPARA, evidenced in green. Green: down-regulated genes. Abbreviations: KO, knockout; TG, triglycerides; TCA, tricarboxylic acid cycle. Created with BioRender.com.

References

    1. Newlaczyl AU, Yu L-G. Galectin-3--a jack-of-all-trades in cancer. Cancer Lett. 2011;313(2):123–8. doi: 10.1016/j.canlet.2011.09.003 - DOI - PubMed
    1. Argüeso P, Panjwani N. Focus on molecules: Galectin-3. Exp Eye Res. 2010;92:2. - PMC - PubMed
    1. Barondes SH, Castronovo V, Cooper DN, Cummings RD, Drickamer K, Feizi T, et al. Galectins: a family of animal beta-galactoside-binding lectins. Cell. 1994;76(4):597–8. doi: 10.1016/0092-8674(94)90498-7 - DOI - PubMed
    1. Mazurek N, Sun YJ, Price JE, Ramdas L, Schober W, Nangia-Makker P, et al. Phosphorylation of galectin-3 contributes to malignant transformation of human epithelial cells via modulation of unique sets of genes. Cancer Res. 2005;65(23):10767–75. doi: 10.1158/0008-5472.CAN-04-3333 - DOI - PubMed
    1. Menon RP, Hughes RC. Determinants in the N-terminal domains of galectin-3 for secretion by a novel pathway circumventing the endoplasmic reticulum-Golgi complex. Eur J Biochem. 1999;264(2):569–76. doi: 10.1046/j.1432-1327.1999.00671.x - DOI - PubMed

LinkOut - more resources