. 2025 Jul 3;20(7):e0327169.
doi: 10.1371/journal.pone.0327169. eCollection 2025.

Refining the Martin-Hopkins method for estimating low-density lipoprotein cholesterol levels: Median versus optimal TG/VLDL-C ratio

Affiliations

Refining the Martin-Hopkins method for estimating low-density lipoprotein cholesterol levels: Median versus optimal TG/VLDL-C ratio

Jongseok Lee et al. PLoS One. .

Abstract

Background: Low-density lipoprotein cholesterol (LDL-C), a major modifiable risk factor for cardiovascular diseases, is typically calculated using the Friedewald formula when triglyceride (TG) levels are below 400 mg/dL. Recent studies have demonstrated the superior accuracy of the Martin-Hopkins method across diverse populations. While this method estimates very-low-density lipoprotein cholesterol (VLDL-C) using strata-specific median TG/VLDL-C ratios, its reliance on median statistics raises questions about whether these ratios are truly optimal.

Objectives and methods: This study evaluated the performance of the Martin-Hopkins method compared to the Friedewald formula, focusing on its potential for improvement by applying optimal TG/VLDL-C ratios. Using data from 18,322 individuals in the Korea National Health and Nutrition Examination Survey (KNHANES), we derived strata-specific optimal TG/VLDL-C ratios designed to maximize concordance with directly measured LDL-C values, based on LDL-C categories defined by clinical guidelines. We compared the performance of four LDL-C estimation models: the Friedewald formula (LDL-CF), the original Martin-Hopkins method (LDL-CM-N), and two alternative models that applied TG/VLDL-C ratios derived from our data-one using median values (LDL-CKM-N) and the other using optimal values tailored to each stratum (LDL-CKO-N).

Results: The Martin-Hopkins method showed significantly higher concordance than the Friedewald formula for TG levels < 400 mg/dL (79.6% for LDL-CF vs. 83.2% for LDL-CM-180, p < 0.001). Concordance improved by less than 2% for TG levels < 150 mg/dL (83.3% vs. 84.9%), but by approximately 10% for TG levels of 150-399 mg/dL (68.8% vs. 78.0%). The largest discrepancy was observed in classifying LDL-C levels < 70 mg/dL among individuals with TG levels of 150-399 mg/dL (47.5% for LDL-CF vs. 90.3% for LDL-CM-180). However, the overall concordance differed only modestly between the 10-cell and 180-cell Martin-Hopkins equations (82.8% for LDL-CM-10 vs. 83.2% for LDL-CM-180, a difference of 0.4%), indicating only a marginal benefit despite the substantial increase in the number of strata. Using optimal TG/VLDL-C ratios increased overall concordance compared to median ratios within the same stratification, with LDL-CKO-N estimates outperforming their LDL-CKM-N counterparts. However, this improvement was not statistically significant in LDL-C estimates derived from TG-only stratification.

Conclusions: Applying optimal TG/VLDL-C ratios within the Martin-Hopkins method improves accuracy compared to median ratios, particularly when stratifications incorporate both TG and non-high-density lipoprotein cholesterol (non-HDL-C) levels. This enhancement can be achieved without increasing the number of strata, offering a practical pathway to refine LDL-C estimation while avoiding excessive stratification. Our findings suggest that while median statistics may be sufficient for TG-only stratifications, they do not fully capture optimal TG/VLDL-C ratios for combined TG and non-HDL-C stratifications.


Conflict of interest statement

The authors have declared that no competing interests exist.

Figures
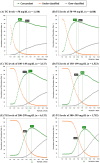
Fig 1
Fig 1. Optimal TG/VLDL-C ratios across six TG strata.
Panels (A–F) depict the concordance (green line), under-classification (orange line), and over-classification (gray line) rates based on the NCEP–ATP III guideline classification as a function of TG/VLDL-C ratio across six TG strata. In each panel, the vertical green line represents the TG/VLDL-C ratio that achieved the highest concordance (i.e., the optimal value). Dashed black lines indicate the fixed ratio of 5 used in the Friedewald formula. Abbreviations: TG/VLDL-C ratio: ratio of triglycerides to very-low-density lipoprotein cholesterol; TG: triglyceride; NCEP–ATP III: National Cholesterol Education Program Adult Treatment Panel III.
Fig 2
Fig 2. Median and optimal TG/VLDL-C ratios by TG and non–HDL-C strata (28-cell).
The left and right panels display the median and optimal TG/VLDL-C ratios, respectively. Color bands represent the TG/VLDL-C ratio ranges as follows: blue (< 4.0), light blue (4.0–4.9), green (5.0–5.9), yellow (6.0–6.9), and red (≥ 7.0). Abbreviations: TG/VLDL-C ratio: ratio of triglycerides to very-low-density lipoprotein cholesterol; TG: triglyceride; non–HDL-C: non–high-density lipoprotein cholesterol.
Fig 3
Fig 3. Comparison of concordance rates between Friedewald and Martin–Hopkins LDL-C estimates by TG levels: < 150 mg/dL and 150–399 mg/dL, based on NCEP–ATP III guideline.
Panel (A) shows results for individuals with TG levels < 150 mg/dL, and Panel (B) for those with TG levels of 150–399 mg/dL. Bars represent concordance rates ± 95% confidence intervals for each LDL-C estimate. From left to right, bars correspond to the following LDL-C estimates: LDL-CF, LDL-CM-180, LDL-CKO-6, LDL-CKO-12, and LDL-CKO-28. * Bars labeled with the same letters indicate no statistically significant difference in concordance between LDL-C estimates (α = 0.05), based on pairwise comparisons using McNemar’s exact test for correlated proportions (see S9 and S10 Tables). The 95% confidence intervals for concordance rates were calculated using the Clopper–Pearson exact method. Abbreviations: NCEP–ATP III: National Cholesterol Education Program Adult Treatment Panel III; TG: triglyceride; LDL-C: low-density lipoprotein cholesterol; LDL-CF: LDL-C calculated using the Friedewald formula; LDL-CM-180: LDL-C calculated using the original 180-cell Martin–Hopkins equation proposed by Martin et al. [14]; LDL-CKO-N (LDL-CKO-6-TG, LDL-CKO-12, and LDL-CKO-28): LDL-C calculated using the N-cell tables with the optimal ratios of triglycerides to very-low-density lipoprotein cholesterol (TG/VLDL-C) derived from our dataset.
Fig 4
Fig 4. Bland–Altman plots comparing estimated LDL-C values with directly measured LDL-C.
Each panel displays the bias (i.e., the difference between LDL-CE and LDL-CD) plotted against the mean of LDL-CE and LDL-CD. The black dashed line represents the mean bias, while the orange and red dashed lines indicate the upper and lower 95% limits of agreement (mean ± 1.96 SD), respectively. Panels (A), (B), and (C) correspond to LDL-CF, LDL-CM-180, and LDL-CKO-28, respectively. These plots illustrate differences in bias magnitude and variability, reflecting the level of agreement between each LDL-CE and LDL-CD. Green dots indicate individuals with TG levels of 300–399 mg/dL. Abbreviations: LDL-C: low-density lipoprotein cholesterol; TG: triglyceride; LDL-CE: estimated LDL-C; LDL-CD: LDL-C directly measured using a homogeneous enzymatic assay; LDL-CF: LDL-C calculated using the Friedewald formula; LDL-CM-180: LDL-C calculated using the original 180-cell Martin–Hopkins equation proposed by Martin et al. [14]; LDL-CKO-28: LDL-C calculated using the 28-cell table (Fig 2) with the optimal ratios of triglycerides to very-low-density lipoprotein cholesterol (TG/VLDL-C) derived from our dataset; SD: standard deviation.
Fig 5
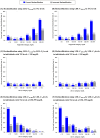
Fig 5. Concordance in the NCEP–ATP III guideline classification: Friedewald vs. Martin–Hopkins LDL-C estimates.
The figure compares concordance rates for LDL-C estimates stratified by TG levels: < 150 mg/dL (A) and 150–399 mg/dL (B). The LDL-C estimates include LDL-CF (gray), LDL-CM-180 (dark blue), and LDL-CKO-28 (blue). The bars indicate concordance rates for each estimated LDL-C category according to the NCEP–ATP III guideline classification, illustrating differences in concordance across the methods. Abbreviations: NCEP–ATP III: National Cholesterol Education Program Adult Treatment Panel III; LDL-C: low-density lipoprotein cholesterol; TG: triglyceride; LDL-CF: LDL-C calculated using the Friedewald formula; LDL-CM-180: LDL-C calculated using the original 180-cell Martin–Hopkins equation proposed by Martin et al. [14]; LDL-CKO-28: LDL-C calculated using the 28-cell table (Fig 2) with the optimal ratios of triglycerides to very-low-density lipoprotein cholesterol (TG/VLDL-C) derived from our dataset.
Fig 6
Fig 6. Discordance rates in LDL-C classification according to the NCEP–ATP III guideline: Friedewald vs. Martin–Hopkins LDL-C estimates.
This figure illustrates differences in discordance rates between two LDL-C estimates calculated using the Friedewald formula (LDL-CF) and the optimized 28-cell Martin–Hopkins method (LDL-CKO-28). Discordance is divided into under-classification (black bars) and over-classification (gray bars), and is stratified by either TG levels or estimated LDL-C categories. Panels (A) and (B) show discordance rates by TG levels for LDL-CF and LDL-CKO-28, respectively. Panels (C) and (D) display discordance by LDL-C categories in individuals with TG levels < 150 mg/dL. Panels (E) and (F) present corresponding results for individuals with TG levels of 150–399 mg/dL. This arrangement allows direct visual comparison between the two LDL-C estimates across different lipid profiles. Abbreviations: NCEP–ATP III: National Cholesterol Education Program Adult Treatment Panel III; TG: triglyceride; LDL-C: low-density lipoprotein cholesterol; LDL-CF: LDL-C calculated using the Friedewald formula; LDL-CKO-28: LDL-C calculated using the 28-cell table (Fig 2) with the optimal ratios of triglycerides to very-low-density lipoprotein cholesterol (TG/VLDL-C) derived from our dataset.
Fig 7
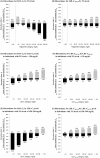
Fig 7. Correct and incorrect reclassification using LDL-CM-180 and LDL-CKO-28 compared with LDL-CF. Reclassification was defined as a shift in the NCEP–ATP III guideline-based treatment category initially assigned by LDL-CF when using either LDL-CM-180 or LDL-CKO-28.
The correctness of reclassification was evaluated against directly measured LDL-C, and each panel illustrates the proportions of correct (blue) and incorrect (gray) reclassifications. Panels (A) and (B) show reclassification by triglyceride levels (< 50, 50–99, 100–149, 150–199, 200–299, and 300–399 mg/dL) using LDL-CM-180 and LDL-CKO-28, respectively. Panels (C) and (D) show reclassification by LDL-CF treatment categories among individuals with TG levels <150 mg/dL, using LDL-CM-180 and LDL-CKO-28, respectively. Panels (E) and (F) present the same comparisons for individuals with TG levels of 150–399 mg/dL. Abbreviations: NCEP–ATP III: National Cholesterol Education Program Adult Treatment Panel III; LDL-C: low-density lipoprotein cholesterol; LDL-CF: LDL-C calculated using the Friedewald formula; LDL-CM-180: LDL-C calculated using the original 180-cell Martin–Hopkins equation proposed by Martin et al. [14]; LDL-CKO-28: LDL-C calculated using the 28-cell table (Fig 2) with the optimal ratios of triglycerides to very-low-density lipoprotein cholesterol (TG/VLDL-C) derived from our dataset.

Similar articles

References

    1. World Health Organization. Cardiovascular diseases (CVDs). http://www.who.int/news-room/fact-sheets/detail/cardiovascular-diseases-.... 2021. Accessed 2024 November 8.
    1. Gaziano JM, Gaziano TA. What’s new with measuring cholesterol?. JAMA. 2013;310(19):2043–4. doi: 10.1001/jama.2013.282775 - DOI - PubMed
    1. Expert Panel on Detection, Evaluation, and Treatment of High Blood Cholesterol in Adults. Executive Summary of The Third Report of The National Cholesterol Education Program (NCEP) Expert Panel on Detection, Evaluation, And Treatment of High Blood Cholesterol In Adults (Adult Treatment Panel III). JAMA. 2001;285(19):2486–97. doi: 10.1001/jama.285.19.2486 - DOI - PubMed
    1. Steinberg D. Thematic review series: the pathogenesis of atherosclerosis: an interpretive history of the cholesterol controversy, part III: mechanistically defining the role of hyperlipidemia. J Lipid Res. 2005;46(10):2037–51. doi: 10.1194/jlr.R500010-JLR200 - DOI - PubMed
    1. National Health Insurance Service. 2015 National Health Screening Statistical Yearbook; 2016.