. 2025 Jul 3;20(7):e0325145.
doi: 10.1371/journal.pone.0325145. eCollection 2025.

Bioinformatics-guided construction of a tumor microenvironment-derived prognostic model in acute myeloid leukemia

Affiliations

Bioinformatics-guided construction of a tumor microenvironment-derived prognostic model in acute myeloid leukemia

Amir Abbas Navidinia et al. PLoS One. .

Abstract

Background: The tumor microenvironment (TME) exerts a profound influence on the progression, therapeutic responses, and clinical outcomes of acute myeloid leukemia (AML), a prevalent hematologic malignancy in adults. This study aimed to establish a TME-based prognostic model to unveil novel therapeutic and prognostic avenues for AML.

Methods: Gene expression profiles and clinical information for 134 AML patients were retrieved from The Cancer Genome Atlas (TCGA). The TME cellular components were evaluated using the ESTIMATE algorithm, and differentially expressed genes (DEGs) were identified. A Microenvironment Prognostic Model (MPM) was subsequently constructed through univariate Cox regression, LASSO regression, and multivariate Cox regression analyses. The predictive performance of the MPM was validated in a separate cohort of 312 AML patients from the TARGET database.

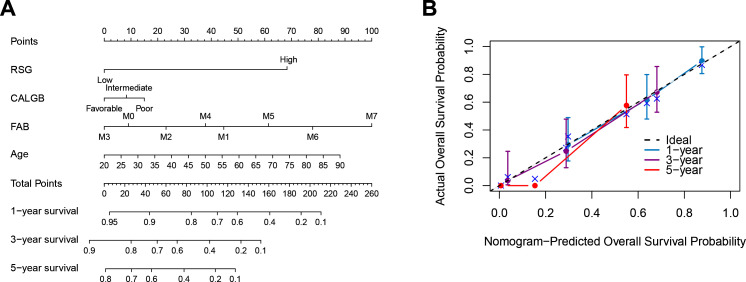
Results: Kaplan-Meier analysis revealed significant associations between the TME, French-American-British (FAB) classification, and overall survival (p-values = 3.6e-07 and 0.011, respectively). LASSO-Cox regression identified eight essential genes (CXCL12, GZMB, ITPR2, LYN, RAB9B, RGMB, RUFY4, TRIM16) that exhibited a strong correlation with survival (p-value < 0.0001). The MPM demonstrated excellent prognostic performance, with area under the curve (AUC) values of 84.05, 85.73, and 89.54 for predicting 1-, 3-, and 5-year survival, respectively. External validation with the TARGET database underscored the robustness of this model, yielding AUC values of 60.5%, 56.7%, and 55.7% at the corresponding intervals.

Conclusion: These findings present a TME-based prognostic model that offers a promising avenue for precise risk stratification and targeted therapeutic strategies in AML.


Conflict of interest statement

The authors have declared that no competing interests exist.

Figures

Fig 1
Fig 1. Association of ESTIMATE scores with AML clinical features.
A, The correlation between ESTIMATE scores and AML cytogenetic risk (P = 0.16). B, Distribution of ESTIMATE scores for AML subtypes (p-value = 9.7e-08). C, Kaplan-Meier survival curve reveals that higher ESTIMATE scores are associated with significantly shorter overall survival (log-rank test, p-value = 0.011).
Fig 2
Fig 2. Identification of DEGs based on ESTIMATE scores.
A, Volcano plot of DEGs from the low vs. high stromal score groups. Genes with p < 0.05 are shown in red (fold change > 1.5) and blue (fold change <−1.5). Grey plots represent the remaining genes (those with no significant difference). B, PCA plot of TCGA data based on ESTIMATE scores and FAB classification. C, Heatmap of top-20 upregulated-DEGs and top-20 downregulated-DEGs for the ESTIMATE score groups.
Fig 3
Fig 3. GO term enrichment analysis of common DEGs.
A, the top 30 significantly enriched GO terms, including three sub-ontologies, biological process, molecular function, and cellular component, are shown. B, Interrelation analysis of KEGG and REACTOME pathways of common DEGs.
Fig 4
Fig 4. The PPI network consists of the top 10 hub upregulated and downregulated DEGs according to the cytoHubba analysis.
The algorithms are: A, betweenness of top 10 upregulated-DEGs; B, closeness of top 10 upregulated-DEGs; C, Degree of top 10 upregulated-DEGs. D, betweenness of top 10 downregulated-DEGs; E, closeness of top 10 downregulated-DEGs; F, Degree of top 10 downregulated-DEGs. The red indicates a higher score, and the yellow indicates a lower score.
Fig 5
Fig 5. Establishment of MPM.
A, LASSO coefficient profiles of the prognostic DEGs. B, Ten-fold cross-validation for tuning parameter selection in the LASSO model. The partial likelihood deviance is plotted against log (λ), where λ is the tuning parameter. Partial likelihood deviance values are shown, with error bars representing SE. The dotted vertical lines are drawn at the optimal values by minimum criteria and 1-SE criteria. C, Forest plot of hazard ratios for 8 prognostic DEGs. D, Distributions of risk score and overall survival status according to risk score increment. E, Expression profile of signature genes in high and low risk score groups.
Fig 6
Fig 6. Evaluating the Prognostic Efficacy of MPM in AML.
A-C, Kaplan–Meier analysis substantiates the robust prognostic relevance of MPM within the training, test, and overall patient cohorts, exhibiting statistical significance (p-values <0.0001, = 0.0004, < 0.0001, respectively). D-F, Time-dependent ROC curves elucidate the precision of MPM in forecasting 1-, 3-, and 5-year Overall Survival rates among patients within the TCGA dataset. G, External validation using TARGET data corroborates MPM’s significant relationship with AML prognosis. H, Time-dependent ROC curves further highlight the MPM’s competence in predicting 1-, 3-, and 5-year OS rates within the TARGET AML patient population.
Fig 7
Fig 7. Nomogram Development for Survival Prediction in AML.
A, Nomogram displaying the predictive factors, including RSG, age, FAB classification, and CALGB category, with survival probabilities for 1, 3, and 5 years. B, CI illustrating the comparison between the nomogram-predicted overall survival probability and the actual overall survival probability.
Fig 8
Fig 8. Validation of the MPM in Clinical Characteristics of AML Patients.
A, MPM significantly correlates with AML patient age, distinguishing those under and above 60 years. (p-value = 1.1e-05). B, MPM shows a significant relationship with FAB classification, aiding in subtype-specific survival predictions (P = 6.1e-06). C, MPM is notably associated with cytogenetic status (CALGB criteria), offering precise risk stratification for favorable, intermediate, and poor cytogenetic patients (p-value = 2.7e-07).

References

    1. Mizani S, Keshavarz A, Vazifeh Shiran N, Bashash D, Allahbakhshian Farsani F. Expression changes of SIRT1 and FOXO3a significantly correlate with oxidative stress resistance genes in AML patients. Indian Journal of Hematology and Blood Transfusion. 2022;1–10. - PMC - PubMed
    1. Bakhtiyari M, Liaghat M, Aziziyan F, Shapourian H, Yahyazadeh S, Alipour M, et al. The role of bone marrow microenvironment (BMM) cells in acute myeloid leukemia (AML) progression: immune checkpoints, metabolic checkpoints, and signaling pathways. Cell Commun Signal. 2023;21(1):252. doi: 10.1186/s12964-023-01282-2 - DOI - PMC - PubMed
    1. Cheung HL, Wong YH, Li YY, Yang X, Ko LH, Tan Kabigting JE, et al. Microenvironment matters: In vitro 3D bone marrow niches differentially modulate survival, phenotype and drug responses of acute myeloid leukemia (AML) cells. Biomaterials. 2025;312:122719. doi: 10.1016/j.biomaterials.2024.122719 - DOI - PubMed
    1. Lisi-Vega LE, Pievani A, García-Fernández M, Forte D, Williams TL, Serafini M, et al. Bone marrow mesenchymal stromal cells support translation in refractory acute myeloid leukemia. Cell Rep. 2025;44(1):115151. doi: 10.1016/j.celrep.2024.115151 - DOI - PMC - PubMed
    1. Balkwill FR, Capasso M, Hagemann T. The tumor microenvironment at a glance. J Cell Sci. 2012;125(Pt 23):5591–6. doi: 10.1242/jcs.116392 - DOI - PubMed

Substances